

Abstract
P-glycoprotein (P-gp) is known to transport a diverse array of xenobiotics, including therapeutic drugs. A member of the ATP-binding cassette (ABC) transporter family, P-gp is a protein encoded by the gene Mdr1 in humans and Abcb1 in rodents (represented by 2 isoforms Abcb1a and Abcb1b). Lining the luminal and abluminal membrane of brain capillary endothelial cells, P-gp is a promiscuous efflux pump extruding a variety of exogenous toxins and drugs. In this study, we measured dynamic changes in Abcb1a and Abcb1b transcripts and P-gp protein in the brain, liver, and kidney after experimental stroke. P-glycoprotein has been shown to increase in brain endothelial cells following hypoxia in vitro or after exposure to proinflammatory cytokines. Using a rat model of ischemic stroke, we hypothesized that P-gp expression will be increased in the brain, liver, and kidney in response to neuroinflammation following ischemic stroke. Adult Sprague Dawley rats underwent middle cerebral artery occlusion (MCAO) for 90 minutes and were killed at 4, 14, 24, and 48 hours postreperfusion onset to determine the time course of P-gp expression. To mimic ischemia occurring at the blood-brain barrier, rat brain endothelial (RBE4) cells were subjected to hypoxia and low glucose (HLG) for 16 hours. Immunoblotting analyses showed P-gp increases in brain and liver following 90-minute MCAO, as well as in cultured RBE4 cells after 16-hour HLG treatment, but fluctuated in the kidney depending on the time point. The relative roles of each isoform in the protein expression were analyzed with quantitative reverse transcriptase polymerase chain reaction. Ischemic stroke leads to significant increases in P-gp levels not only in the brain but also in the liver. The increase in P-gp could dramatically reduce the bioavailability and efficacy of neuroprotective drugs. Therefore, P-gp represents a big hurdle to drug delivery to the ischemic brain.
Keywords: P-glycoprotein, ischemia, stroke, liver, kidney, Abcb1/Mdr1
Introduction
Targeted drug delivery to the brain is notoriously complicated due to the privileged status of the brain conferred by the blood-brain barrier (BBB). The BBB comprises endothelial cells connected by tight junctions, astrocytic endfeet, pericytes, perivascular microglia, and extracellular matrix—which act in concert to restrict the penetration of xenobiotics and large and/or charged molecules.1 Many pharmaceuticals are extruded via active diffusion mediated by ATP-binding cassette (ABC) transporters such as P-glycoprotein (P-gp). Because of its promiscuity and high levels of expression at the BBB, P-gp is a powerful gatekeeper to the brain. P-glycoprotein binds to a variety of structurally diverse molecules and has been located on the astrocytic endfeet,2 the abluminal and luminal sides of brain capillary endothelial cells,3,4 the bile-facing canaliculi of the liver,5 and the urine-facing side of kidney proximal tubes.5
P-glycoprotein is a drug efflux pump encoded by Mdr1/Abcb1 in humans and 2 isoforms in rodents: Abcb1a/Mdr1a and Abcb1b/Mdr1b. The half-life of P-gp is dependent on the G1/G0 phase of the cell cycle, which in turn is dependent on physiological stresses in multidrug-resistant cells.6 P-glycoprotein is altered in response to inflammation,7 oxidative stress,8 radiation, and heat shock.9 Globally, cytokines affect P-gp messenger RNA (mRNA), function, and protein expression.10 Work in rodent models of liver inflammation has shown that Mdr1b is a less expressed but more inducible isoform, whereas Mdr1a is constitutive,11 and reduced Mdr1a mRNA leads to reduced P-gp function.12,13
Ischemic stroke occurs when a blood vessel that supplies oxygen and nutrients to the brain is blocked and is therefore one such effector of inflammation and oxidative stress. Lack of sufficient oxygen activates hypoxia-inducible factor 1 alpha (HIF-1α)14 and nuclear factor κB,15 both of which have been shown to increase P-gp expression.16,17 P-glycoprotein is increased in the ischemic brain18–20 likely in an attempt to maintain a functional barrier between the blood and the brain when the BBB is compromised.
In our study, male rats underwent 90 minutes of transient ischemic stroke and were killed after 4, 14, 24, and 48 hours of reperfusion to establish a time course of P-gp protein levels and mRNA in the brain, liver, and kidney. In addition to in vivo data, we examined protein and mRNA from rat brain endothelial (RBE4) cells exposed to 16 hours of starvation in hypoxia and low glucose (HLG) conditions. We also confirmed P-gp localization on endothelial cells in the brain using immunofluorescence. We hypothesized that the biochemical changes that occur due to ischemic stroke will not only increase P-gp in the brain but also increase P-gp in the liver and kidney; however, P-gp was only increased in the cerebral cortex and liver 48 hours after ischemia. As many therapeutic strategies for ischemic stroke involve targeted pharmaceuticals delivered to the brain, increased P-gp expression in ischemic stroke could mean higher rates of drug transport out of the brain and ultimately reduce the beneficial effects of treatment. Furthermore, knowing how P-gp expression is temporally altered in the liver and kidney, organs vital to drug metabolism and elimination, is essential to maximizing pharmacotherapeutic effects of potential neuroprotective drugs.
Materials and Methods
Animals
All animal procedures were approved by the University of Florida Institutional Animal Care and Use Committee and in accordance with National Institutes of Health guidelines. Every effort was made to minimize the number of animals used in this study and to reduce pain and suffering. Adult male rats (9-11 weeks; Sprague Dawley from Charles River Laboratories International, Wilmington, MA, USA) between 280 and 320 g were housed in the university’s vivarium on a 12-hour light/dark cycle with ad libitum access to food and water.
Transient middle cerebral artery occlusion
Using an intraluminal filament model of transient middle cerebral artery occlusion (MCAO) previously delineated by our group,21 male rats were subjected to focal ischemia and killed after 4, 14, 24, and 48 hours of reperfusion. Animals were anesthetized with isoflurane in medical grade oxygen. To occlude the middle cerebral artery (MCA), a small midline incision was made ventrally along the rat’s neck to expose the internal carotid artery (ICA), the common carotid artery (CCA), and the external carotid artery. The CCA was ligated; a small arteriotomy was performed on the CCA to insert a 4-0 monofilament silicone-coated nylon suture and was gently forwarded about 18 to 20 mm into the ICA until slight resistance was felt to block the MCA. The incision was sealed, and the rats were allowed to recover from anesthesia in a temperature-controlled chamber maintained at 37°C and were then transferred to their cages for the remainder of the ischemic event. Behavioral confirmation of stroke was demonstrated by animal curling and circling. About 5 minutes prior to filament removal, rats were again anesthetized, the incision was reopened, the filament was slowly retracted to allow MCA reperfusion, and the wound was resealed. Total occlusion time was 90 minutes, and data are presented as a function of total reperfusion time until being killed.
RNA Extraction and Quantitative Reverse Transcriptase Polymerase Chain Reaction
After intraperitoneal injection of pentobarbital at 150 mg/kg to achieve profound anesthetization, animals were intracardially perfused with ice-cold 0.9% saline. The brain was harvested, placed in a rat brain matrix (Item Code BSRLS001-1; Zivic Instruments, Pittsburgh, PA, USA), and sliced coronally at 2 mm intervals. The third slice was dedicated to RNA/polymerase chain reaction (PCR) experiments, and the fourth slice was dedicated to immunoblotting analysis. The third and fourth slices were separated into ipsilateral and contralateral hemispheres and further dissected into cerebral cortex and striatum. Two samples were each dissected from the kidney and liver: one for RNA/PCR and the other for Western blotting. To preserve RNA integrity, immediately after harvesting, the tissue was placed in RNAlater at 10 µg of tissue/µL of RNAlater (Catalog No. AM7021; Life Technologies, Carlsbad, CA, USA). The tissue in RNAlater was kept at 4°C for 24 hours and then placed at −20°C until further processing.
RNA was extracted using the Aurum Total RNA Fatty and Fibrous Tissue Kit (Catalog No. 738-6830; Bio-Rad, Hercules, CA, USA) according to the manufacturer’s instructions. Quality and concentration were measured with a Take3 Micro-Volume Plate and Gen5 Data Analysis Software (Biotek Instruments, Winooski, VT, USA). One microgram of RNA was reverse transcribed with iScript Reverse Transcription Supermix (Catalog No. 170-884; Bio-Rad), and 20 ng of the resulting cDNA was used to measure target gene expression levels in quadruplicate using Sso Advanced Universal SYBR Green Supermix (Catalog No. 172-5272; Bio-Rad). Primers for Abcb1a and Abcb1b were used to measure the 2 P-gp isoforms and were normalized against the housekeeping gene Ywhaz (Integrated DNA Technologies, Coralville, IA, USA). Ywhaz was chosen because it is one of the few housekeeping genes not significantly altered after ischemic stroke.22,23 The primers had the following sequences: Abcb1a forward 5′-AACGGAAGAGCAGACAAGAAC-3′ and reverse 5′-CAACCTGCATAGCGAAACATTG-3′, Abcb1b forward 5′-CGACTCCGATACATGGTCTTC-3′ and reverse 5′-ACATTAGAAGCGTCACTAGCG-3′, Ywhaz forward 5′-GAAGAGTCGTACAAAGACAGCA-3′ and reverse 5′-GCTTCTGCTTCGTCTCCTTG-3′. Using a CFX96 Touch Real-Time PCR Detection System (Bio-Rad), we ran an initial polymerase activation/DNA denaturation step at 95°C for 30 seconds, and then 40 cycles of denaturation at 95°C for 5 seconds and annealing at 60°C for 30 seconds. Primer specificity was confirmed with a melt curve analysis: the initial temperature was 65°C with increasing increments of 0.5°C/cycle. The normalized expression ΔΔCq values given by the CFX Manager software represent the relative quantity of the target gene normalized to the housekeeping gene Ywhaz and further normalized to the biological control/sham samples.
Tissue homogenization
After dissecting the fourth slice, tissue was immediately frozen in dry ice. Tissue was weighed and homogenized in radioimmunoprecipation assay lysis buffer (50 mM Tris-HCl, 150 mM NaCl, 1% IGEPAL CA-630, 1% sodium deoxycholate, and 1% SDS) at 100 µL/mg of tissue containing HALT Protease Inhibitor Cocktail (Catalog No. 78430; Thermo Fisher Scientific, Rockford, IL, USA), HALT Phosphatase Inhibitor Cocktail (Catalog No. 78428; Thermo Fisher Scientific), and 0.5 M EDTA. Protease and phosphatase inhibitors and EDTA were added at 10 µL/mL lysis buffer. Tissue was homogenized using a Tissue-Tearor homogenizer (Catalog No. 985370; BioSpec, Inc, Bartlesville, OK, USA), sonicated twice with a Vibra-Cell sonicator (Model No. VCX130PB; Sonics & Materials, Inc, Newton, CT, USA), and centrifuged at 4°C for 20 minutes at 14 000g. The resulting supernatant was aliquoted and stored at −80°C until needed. Protein concentrations were assessed using a bicinchoninic acid protein assay (Catalog No. 23227; Thermo Fisher Scientific).
Fixing the brain and immunohistochemistry
After intraperitoneal injection of 150 mg/kg of pentobarbital to achieve profound anesthetization, animals were intracardially perfused with ice-cold 0.9% saline and then perfused with about 250 mL of HistoChoice (Catalog No. H120; VWR, Radnor, PA, USA). Brains were harvested and stored in HistoChoice for 24 hours and then equilibrated to 30% sucrose in phosphate-buffered saline (PBS) for 48 to 72 hours. Finally, brains were frozen in Tissue-Tek O.C.T. and kept at −20°C until cryosectioned at 20 µm.
Mounted tissue was dried at 50°C for 30 minutes to ensure tissue was adhered to the slide. The tissue was washed twice with PBS containing 0.1% Triton X-100 and blocked for 1 hour at room temperature in a solution containing 1% bovine serum albumin (BSA) and 5% normal goat serum. A primary antibody for P-gp (1:000; Catalog No. ab170904; Abcam; Cambridge, MA, USA) was co-incubated with RECA-1 (MCA970GA mouse monoclonal; 1:1000; AbD Serotec, Raleigh, NC, USA) in 0.5% BSA in tris-buffered saline (TBS) containing 0.1% Triton X-100 overnight at 4°C. The sections were washed 3 times with PBS/Triton X-100 before blocking again for 20 minutes at room temperature and then incubating with the secondary antibody for 90 minutes at room temperature using Alexa 488 goat anti-rabbit (Code No. 115-545-144; 1:1000; Jackson ImmunoResearch Laboratories, Inc., West Grove, PA, USA) and Cy3 goat anti-mouse (Code No. 115-165-166; 1:1000 Jackson ImmunoResearch). Finally, sections were dipped in 100 nM 4′,6-diamidino-2-phenylindole in PBS for 10 seconds before 3 rinses in water, mounted with Fluoromount (Catalog No. F4680; Sigma-Aldrich, St. Louis, MO, USA), and coverslipped.
Western blotting
To quantify relative protein levels, 50 µg of total protein per sample was denatured with 2% β-mercaptoethanol and separated on a 4% to 20% TGX Precast Gel (Catalog No. 456-1095; Bio-Rad) with sodium dodecyl sulfate polyacrylamide gel electrophoresis and then transferred at 25 V onto an Immobilon-FL polyvinylidene difluoride membrane with a Trans-Blot Turbo (Bio-Rad) for 30 minutes. Membranes were blocked in 5% nonfat milk in TBS and probed with rabbit monoclonal anti–P-gp (1:1000; Catalog No. ab170904) or rabbit polyclonal anti–P-gp antibody (Catalog No. sc8313; Santa Cruz Biotechnology, Santa Cruz, CA, USA) overnight at 4°C, washed, and then incubated in goat anti-rabbit IRDye 800 CW (1:40,000; Li-Cor, Lincoln, NE, USA) for an hour at room temperature. Equal protein loading was confirmed using mouse anti–β-actin (1:10,000; Catalog No. 1978; Sigma-Aldrich) and donkey anti-mouse 680 LT IRDye (1:40,000; Li-Cor). Confirmation of hypoxic conditions in our ischemia-like treatment of the RBE4 cells was determined by measuring HIF-1α (1:500; Catlog No. 10006421; Cayman Chemical Company, Ann Arbor, MI, USA). Blots were imaged and densitometrically analyzed with a Li-Cor Odyssey infrared scanner and Image Studio 2.0 software (Li-Cor).
RBE4 cell culture and HLG conditions
RBE4 cells were gifted to us by Dr. Michael Aschner from the Albert Einstein College of Medicine at Yeshiva University. Because astrocytes are vital to the integrity of the BBB,24 RBE4 cells were cultured using astrocyte-conditioned media (ACM) as described previously by our group.25 Rat astrocytes, CTX-TNA2 (Catalog No. CRL-2006; American Type Culture Collection, Manassas, VA, USA), were cultured with media containing 44% Ham’s F-10 Nutrient mixture (Catalog No. 11550-043; Invitrogen, Grand Island, NY, USA), 44% α-minimum essential medium (Catalog No. 12571-06; Invitrogen), 10% fetal bovine serum (FBS) (Catalog No. F4135; Sigma-Aldrich), 1% (100 U/mL) penicillin/100 µg/mL streptomycin (Catalog No. 15140-122; Invitrogen), and 1% Geneticin (G418 Catalog No. A1720; 300 µg/mL; Sigma-Aldrich) in a 5% CO2 incubator at 37°C. On confluency, media was harvested every 3 days for use in RBE4 cell culture as described in our recent study.25
Rat brain endothelial cells were cultured at 2 × 10⁴ cells/cm2 on collagen I–coated (Catalog No. C3867; Sigma-Aldrich) T75 flasks with ACM composed of a 1:1 mixture of fresh astrocyte growth media and the conditioned media harvested from confluent CTX-TNA2 cells supplemented with 1 ng/mL basic fibroblast growth factor. Cells are harvested and trypsinized after reaching confluency.
To mimic ischemia in vitro, trypsinized RBE4 cells were seeded at 2 × 10⁵ cells/cm2 onto a 35-mm dish (Catalog No. 627160; Greiner Bio-One, Monroe, NC, USA) and incubated with ACM with supplements and growth factors (EGM-2MV SingleQuot Kit Supplement & Growth Factors; Catalog No. CC4147; Lonza, Basel, Switzerland) at 37 °C in a 5% CO2 incubator. After 6 days, the media was substituted with Earle’s Balanced Salt Solution (EBSS) consisting of 117 mM NaCl, 5.5 mM KCl, 1.8 mM CaCl2, 1 mM MgCl2, 20 mM HEPES, 26 mM NaHCO3, and 1 mM NaH2PO4 plus 1.1 mM d-glucose and 5% FBS and placed into a hypoxic chamber containing 93% N2, 2% O2, and 5% CO2 for 16 hours before being harvested. Anaerobic conditions in the incubator were confirmed using an electronic oxygen/carbon dioxide analyzer (ProOx Model C21; BioSpherix, Lacona, NY, USA). Control cultures were maintained with normal EBSS containing 5.6 mM d-Glucose plus 5% FBS for 16 hours at 37°C in 95% air and 5% CO2.
Statistics
To analyze data, we used a Student’s t test, one-way analysis of variance (ANOVA) with a Dunnett posttest, or two-way ANOVA with a Bonferroni posttest, where appropriate. Data were considered significant if P < .05. Bar graphs include mean ± SEM.
Results
P-gp is increased in brain tissue after ischemic stroke and endothelial cells exposed to ischemia-like conditions
To develop a time course of P-gp expression in the brain after ischemic stroke, we measured P-gp in the cerebral cortex normalized to actin and found that P-gp was increased at 48 hours (P < 0.05) postreperfusion onset as shown in Figure 1A and C. Compared with the sham group, P-gp was also increased in the contralateral hemispheres at 48 hours, but this effect was not significant (P = 0.12). In the striatum, there was also a nonsignificant increasing trend at later time points (Figure 1B and D).
Figure 1.

(A) and (C) Western blot data of cortical tissue and representative image showing P-glycoprotein (P-gp) levels normalized to actin in sham (n = 6), 4-hour (n = 5), 14-hour (n = 6), 24-hour (n = 7), and 48-hour (n = 6) groups in the ipsilateral (i) and contralateral (c) hemispheres. Data are presented as a function of total reperfusion time until being killed. P-gp is significantly increased by 48 hours in the ipsilateral cortex (*P < 0.05). (B) and (D) Western blot in subcortical tissue showing P-gp levels normalized to actin in sham (n = 6), 4-hour (n = 5), 14-hour (n = 6), 24-hour (n = 7), and 48-hour (n = 6) groups. There are nonsignificant increases in P-gp at 24 and 48 hours in the ipsilateral hemisphere. (E) Abcb1a expression normalized to Ywhaz in cortical samples from sham (n = 6), 4-hour (n = 5), 14-hour (n = 6), 24-hour (n = 7), and 48-hour (n = 6) groups; *P < 0.05, **P < 0.01, ***P < 0.001. (F) Abcb1b expression normalized to Ywhaz in cortical samples from sham (n = 6), 4-hour (n = 5), 14-hour (n = 6), 24-hour (n = 7), and 48-hour (n = 6) groups; *P < 0.05, ***P < 0.001. (G) Abcb1a expression normalized to Ywhaz in subcortical samples from sham (n = 6), 4-hour (n = 5), 14-hour (n = 6), 24-hour (n = 7), and 48-hour (n = 6) groups; ***P < 0.001. (H) Abcb1b expression normalized to Ywhaz in subcortical samples from sham (n = 6), 4-hour (n = 5), 14-hour (n = 6), 24-hour (n = 7), and 48-hour (n = 6) groups; **P < 0.01, ***P < 0.001.
We are the first to measure dynamic fluctuations in Abcb1a and Abcb1b transcripts after experimental ischemic stroke. We ran quantitative reverse transcriptase polymerase chain reaction with rat brain cDNA to measure both isoforms of P-gp, Abcb1a and Abcb1b (Figure 1). In the ipsilateral cerebral cortex (Figure 1E), Abcb1a was initially downregulated at 4, 14, and 24 hours (P < 0.001, P < 0.01, and P < 0.001, respectively), until a surge in expression at 48 hours (P < 0.05). In Figure 1F, Abcb1b cortical expression continuously increased with longer intervals of reperfusion time, particularly at 48 hours (P < 0.05). In the subcortex, where cell death is the greatest in this stroke model, Abcb1a is significantly upregulated at 24 and 48 hours (Figure 1G; P < 0.01 and P < 0.001, respectively), whereas Abcb1b increases as early as 4 hours postreperfusion onset until fluctuating from 24 to 48 hours (Figure 1H). Although levels are reduced from 24 hours, at 48 hours, P-gp expression is still much higher than sham (Figure 1E to H).
To determine the major source of P-gp increase measured at 48 hours with immunoblotting, we performed immunohistochemistry on naïve, sham, and 48-hour rat brain tissue (Figure 2). P-glycoprotein expression was confined solely to endothelial cells in naïve, sham, and ischemic brains 48 hours after stroke, which is in line with previous reports.26,27
Figure 2.

Immunohistochemistry (IHC) of the brain. Rat brain diagram with rectangle depicts region where images were taken within the ipsilateral cortex near the border between infarcted and “healthy” tissue. IHC at ×40 with naïve, sham, and middle cerebral artery occlusion 48 hours post-reperfusion onset showing co-localization of P-glycoprotein (P-gp) and endothelial cells with RECA-1. DAPI indicates 4′,6-diamidino-2-phenylindole.
Because immunohistochemistry revealed that P-gp is primarily expressed on endothelial cells, we measured P-gp in RBE4 cell lysate comparing control and 16-hour HLG groups and found P-gp increased as a result of HLG (Figure 3B). We confirmed hypoxic conditions of our HLG treatment by measuring increased HIF-1α (Figure 3A). Our data showing increased P-gp in the brain after ischemia are in agreement with previous findings that show increased expression in brain microvessel endothelial cells cocultured with astrocytes27 and RBE4 cells28 exposed to oxygen-glucose deprivation and rats subjected to MCAO.19,29
Figure 3.
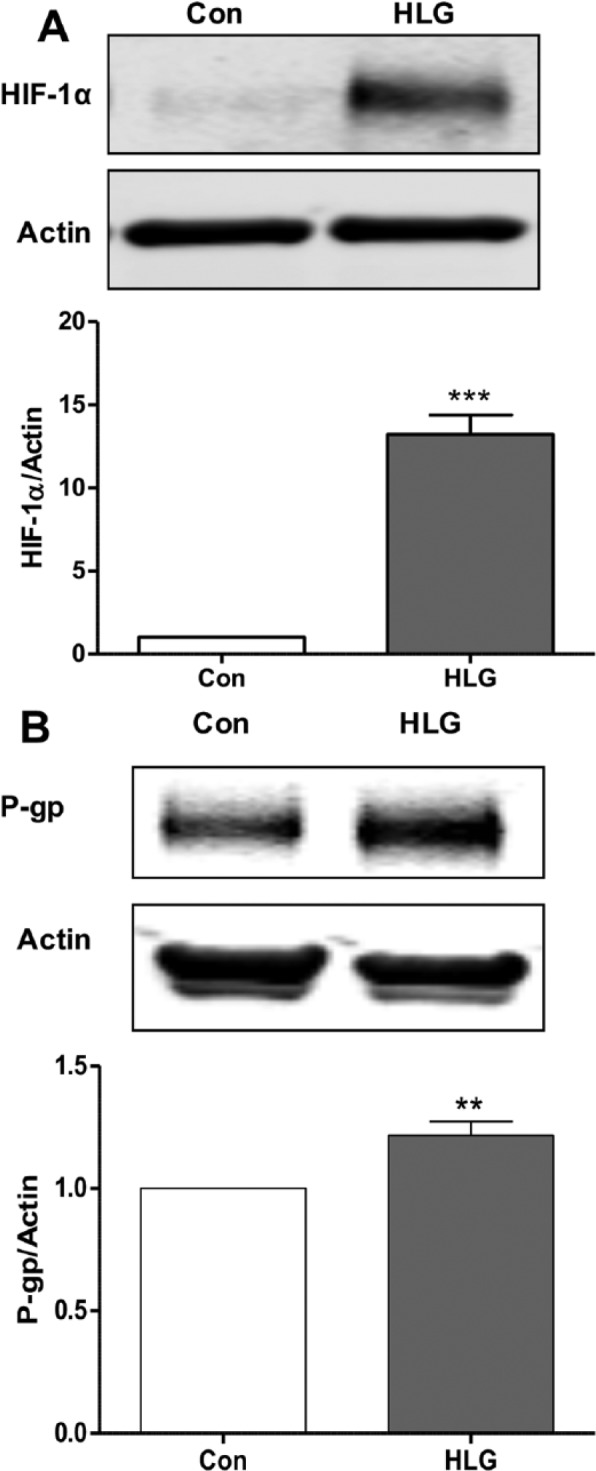
(A) Western blot of RBE4 cell lysate measuring HIF-1α in response to 16 hours of HLG compared with control and representative image (n = 4, ***P < 0.001). (B) Western blot of RBE4 cell lysate showing increased P-gp with 16 hours of hypoxia/low glucose compared with control and representative image (n = 5, ** P < 0.01). HIF-1α indicates hypoxia-inducible factor 1 alpha; HLG, hypoxia and low glucose; P-gp, P-glycoprotein; RBE4, rat brain endothelial cells.
P-gp is upregulated in the periphery after ischemic stroke
After ischemic stroke, P-gp expression in the liver and kidney fluctuated (Figure 4). Mirroring brain mRNA, hepatic Abcb1b appeared to increase with increasing time points after reperfusion onset (Figure 4B; 48 hour P < 0.001). In the kidney, Abcb1a was downregulated at 14 and 24 hours (P < 0.05 and P < 0.001, respectively), but fluctuated from 24 to 48 hours (Figure 4C). Like the liver, Abcb1b demonstrated very little change across time points until increasing at 48 hours in the kidney (Figure 4D; P < 0.05). In the liver, P-gp increased at later time points after ischemia, particularly at 48 hours (Figure 4F and H; P < 0.05). There was very little change in P-gp between the sham, 24-hour, and 48-hour groups in the kidney, but at earlier times (ie, 4 and 14 hours), there are reduced protein levels (Figure 4E and G).
Figure 4.

(A) and (B) Quantitative reverse transcriptase polymerase chain reaction (qRT-PCR) changes in Abcb1a and Abcb1b expression in the liver of sham (n = 6), 4-hour (n = 5), 14-hour (n = 6), 24-hour (n = 7), and 48-hour (n = 6) groups normalized to Ywhaz. Data are presented as a function of total reperfusion time until being killed. Abcb1b is increased in a time-dependent manner (***P < 0.001). (C) and (D) qRT-PCR changes in Abcb1a (*P < 0.05, *** P < 0.001) and Abcb1b (**P < 0.01) expression in the kidney of sham (n = 6), 4-hour (n = 5), 14-hour (n = 6), 24-hour (n = 7), and 48-hour (n = 6) groups normalized to Ywhaz. (E) and (G) Western blot data of kidney tissue and representative image showing P-gp levels normalized to actin in sham (n = 6), 4-hour (n = 5), 14-hour (n = 6), 24-hour (n = 7), and 48-hour (n = 6) groups. P-gp is significantly decreased by 4 hours (*P < 0.05) and 14 hours (*** P < 0.001). (F) and (H) Western blot data and representative image of P-gp normalized to actin in the liver showing sham (n = 6), 4-hour (n = 5), 14-hour (n = 6), 24-hour (n = 7), and 48-hour (n = 6) groups. P-gp is significantly increased by 48 hours (**P < 0.01). P-gp indicates P-glycoprotein.
Discussion
We are the first group to establish that 90 minutes of transient MCAO increases P-gp in the liver in conjunction with increased P-gp in the brain, in addition to measuring the dynamic changes in P-gp transcripts, Abcb1a and Abcb1b, in the brain, liver, and kidney. Middle cerebral artery occlusion results in oxidative stress, and the infarcted tissue induces production of interleukin 6 (IL-6), tumor necrosis factor α (TNF-α), interleukin-1 beta (IL-1β)30 and HIF-1α,31 all of which mediate P-gp transcription. Abcb1/mdr1 is upregulated after hypoxia due to HIF-1α production in human microvascular endothelial cells.17 In isolated rat brain microvessels subjected to MCAO, TNF-α was increased along with P-gp levels,19 and in primary rat hepatocytes incubated with TNF-α, Abcb1b mRNA was induced in addition to increased P-gp protein and activity.32 Conversely, culturing rat hepatocytes with IL-1β or IL-6 reduces P-gp and activity,33 so the time course of cytokine release after ischemic stroke and their differential effects on P-gp expression might partially account for protein and mRNA fluctuations observed in our study. The relatively stable, low expression of Abcb1a and Abcb1b in the hemisphere contralateral to the MCAO may be due to endothelial cell polarity in the BBB that limits receptor-dependent cytokine transcytosis into the brain parenchyma as the BBB in the contralateral hemisphere is more intact than in ipsilateral hemisphere.27,34,35
Our data show that brain Abcb1a decreased at 4, 14, and 24 hours, until increasing beyond sham expression at 48 hours. Abcb1b was continuously upregulated at each time point compared with sham levels. However, there were negligible changes in P-gp protein until 24 to 48 hours after ischemia. The discrepancy between the mRNA and protein levels may be due to the cumulative effect of differing isoform expression as the P-gp antibody used is not specific for a particular isoform. In the liver, Abcb1a slightly decreases at 4 hours and then greatly decreases to below baseline, whereas Abcb1b expression continuously increases. In the kidney, Abcb1a decreases at 14 and 24 hours and then increases at 24 and 48 hours; Abcb1b fluctuates particularly from 24 to 48 hours. If this model sufficiently represents P-gp expression in the brain and liver after stroke in humans, these data indicate that pharmaceutical treatment would be most advantageous before 48 hours if the drug is a P-gp substrate. This is important to not only increasing the drug concentration in the brain but also to reducing drug metabolism in the liver.
Earlier studies have shown that peripheral inflammation affects P-gp in the brain.36 Increased P-gp expression in the brain should enhance the functional barrier between the brain and circulating toxicants in the blood, and in support of this hypothesis, Zhang et al37 showed that liver failure due to hyperammonemia increased expression and function of P-gp at the rat BBB. Similarly, in a rat model of hepatic ischemia, hepatic and cerebral P-gp expression increased 24 hours after reperfusion.38 Also, increased P-gp levels in the kidney have been documented in response to renal ischemia in the mouse up to 7 days post reperfusion.39 The liver and kidney seem to be affected by compounds extruded from the ischemic brain into the blood, and activated immune cells in the infarct and in circulation secrete IL-1β, IL-6, and TNF-α, all of which influence P-gp expression.33,40,41 Circulating cytokines may be at least partially responsible for changes in P-gp in the periphery especially as renal and hepatic capillaries are highly fenestrated.
It is unclear whether P-gp itself is a pathological mediator as mdr1a knockout mice show decreased infarct size after transient brain ischemia compared with wild-type mice.42 The underlying mechanisms of P-gp deficiency in stroke are not understood, but in other models of neuroinflammation, increased P-gp levels are associated with increased transport of chemokines, which exacerbate injury.43 Previous data have shown that liver inflammation affects P-gp at the BBB, but there has been little work in the other direction, namely, studying changes in the liver and kidney after insults to the brain, such as ischemia. Inhibition of mdr1 increased the efficacy of neuroprotective therapy administered to mice that were subjected to 30 and 90 minutes of MCA occlusion.20
One limitation of our study is the lack of analysis of P-gp transport function in different tissues after stroke, in particular, the biological significance of increased P-gp levels in the liver compared with the ischemic brain. The increases in P-gp levels in the liver and brain in our study are around 2-fold of sham levels, which is in line with previous studies showing that this relatively modest increase had significant implications for transport activity of P-gp.19,20
Currently, the only Food and Drug Administration–approved drug for treating ischemic stroke, tissue plasminogen activator, inhibits P-gp in rat brain endothelial cells,44 but because it can cause severe hemorrhaging and has a small effective time window, its use is limited to an extremely small percentage of patients.45 There is a lack of effective therapies to salvage healthy tissue damaged by the spread of cell death after stroke, and understanding the fluctuations of P-gp after ischemic stroke may be a glimpse into a possible mechanism to enhance the efficacy of neuroprotective drug therapies.
In summary, we are the first to establish that P-gp increases in the liver as well as in the brain after transient ischemic stroke and outline a time course of the protein and mRNA expression in the aforementioned tissues. Increases in P-gp expression in the brain and the liver will affect the bioavailability, drug distribution, and elimination of neuroprotective drugs, and it is therefore invaluable to establish a time window after ischemia before P-gp increases to maximize pharmaceutical efficacy.
Footnotes
Peer review:Nine peer reviewers contributed to the peer review report. Reviewers’ reports totaled 1948 words, excluding any confidential comments to the academic editor.
Funding:The author(s) disclosed receipt of the following financial support for the research, authorship, and/or publication of this article: This work was supported by the McKnight Brain Institute, University of Florida, Gainesville, FL.
Declaration of conflicting interests:The author(s) declared no potential conflicts of interest with respect to the research, authorship, and/or publication of this article.
Author Contributions: KMD, AOM, DMS, KEH, and CY performed experiments. ECJ designed and planned the experiments. KMD and ECJ analyzed the data and prepared the figures. KMD, ECJ, and KEH wrote the paper. ECJ conceived and led the project. All authors read and approved the final version of the paper.
References
- 1. Abbott NJ. Blood-brain barrier structure and function and the challenges for CNS drug delivery. J Inherit Metab Dis. 2013;36:437–449. [DOI] [PubMed] [Google Scholar]
- 2. Decleves X, Regina A, Laplanche JL, et al. Functional expression of P-glycoprotein and multidrug resistance-associated protein (Mrp1) in primary cultures of rat astrocytes. J Neurosci Res. 2000;60:594–601. [DOI] [PubMed] [Google Scholar]
- 3. Miller DS, Nobmann SN, Gutmann H, Toeroek M, Drewe J, Fricker G. Xenobiotic transport across isolated brain microvessels studied by confocal microscopy. Mol Pharmacol. 2000;58:1357–1367. [DOI] [PubMed] [Google Scholar]
- 4. Bendayan R, Ronaldson PT, Gingras D, Bendayan M. In situ localization of P-glycoprotein (ABCB1) in human and rat brain. J Histochem Cytochem. 2006;54:1159–1167. [DOI] [PMC free article] [PubMed] [Google Scholar]
- 5. Fromm MF. Importance of P-glycoprotein at blood-tissue barriers. Trends Pharmacol Sci. 2004;25:423–429. [DOI] [PubMed] [Google Scholar]
- 6. Zhang W, Ling V. Cell-cycle-dependent turnover of P-glycoprotein in multidrug-resistant cells. J Cell Physiol. 2000;184:17–26. [DOI] [PubMed] [Google Scholar]
- 7. Sanchez-Covarrubias L, Slosky LM, Thompson BJ, Davis TP, Ronaldson PT. Transporters at CNS barrier sites: obstacles or opportunities for drug delivery? Curr Pharm Design. 2014;20:1422–1449. [DOI] [PMC free article] [PubMed] [Google Scholar]
- 8. Felix RA, Barrand MA. P-glycoprotein expression in rat brain endothelial cells: evidence for regulation by transient oxidative stress. J Neurochem. 2002;80:64–72. [DOI] [PubMed] [Google Scholar]
- 9. Zhou SF. Structure, function and regulation of P-glycoprotein and its clinical relevance in drug disposition. Xenobiotica. 2008;38:802–832. [DOI] [PubMed] [Google Scholar]
- 10. Fernandez C, Buyse M, German-Fattal M, Gimenez F. Influence of the pro-inflammatory cytokines on P-glycoprotein expression and functionality. J Pharm Pharm Sci. 2004;7:359–371. [PubMed] [Google Scholar]
- 11. Teeter LD, Estes M, Chan JY, et al. Activation of distinct multidrug-resistance (P-glycoprotein) genes during rat liver regeneration and hepatocarcinogenesis. Mol Carcinog. 1993;8:67–73. [DOI] [PubMed] [Google Scholar]
- 12. Goralski KB, Hartmann G, Piquette-Miller M, Renton KW. Downregulation of mdr1a expression in the brain and liver during CNS inflammation alters the in vivo disposition of digoxin. Br J Pharmacol. 2003;139:35–48. [DOI] [PMC free article] [PubMed] [Google Scholar]
- 13. Ando H, Nishio Y, Ito K, et al. Effect of endotoxin on P-glycoprotein-mediated biliary and renal excretion of rhodamine-123 in rats. Antimicrob Agents Chemother. 2001;45:3462–3467. [DOI] [PMC free article] [PubMed] [Google Scholar]
- 14. Wang GL, Jiang BH, Rue EA, Semenza GL. Hypoxia-inducible factor 1 is a basic-helix-loop-helix-PAS heterodimer regulated by cellular O2 tension. Proc Natl Acad Sci U S A. 1995;92:5510–5514. [DOI] [PMC free article] [PubMed] [Google Scholar]
- 15. Koong AC, Chen EY, Giaccia AJ. Hypoxia causes the activation of nuclear factor kappa B through the phosphorylation of I kappa B alpha on tyrosine residues. Cancer Res. 1994;54:1425–1430. [PubMed] [Google Scholar]
- 16. Ogretmen B, Safa AR. Negative regulation of MDR1 promoter activity in MCF-7, but not in multidrug resistant MCF-7/Adr, cells by cross-coupled NF-kappa B/p65 and c-Fos transcription factors and their interaction with the CAAT region. Biochemistry. 1999;38:2189–2199. [DOI] [PubMed] [Google Scholar]
- 17. Comerford KM, Wallace TJ, Karhausen J, Louis NA, Montalto MC, Colgan SP. Hypoxia-inducible factor-1-dependent regulation of the multidrug resistance (MDR1) gene. Cancer Res. 2002;62:3387–3394. [PubMed] [Google Scholar]
- 18. Lazarowski A, Caltana L, Merelli A, Rubio MD, Ramos AJ, Brusco A. Neuronal mdr-1 gene expression after experimental focal hypoxia: a new obstacle for neuroprotection? J Neurol Sci. 2007;258:84–92. [DOI] [PubMed] [Google Scholar]
- 19. Cen J, Liu L, Li MS, et al. Alteration in P-glycoprotein at the blood-brain barrier in the early period of MCAO in rats. J Pharm Pharmacol. 2013;65:665–672. [DOI] [PubMed] [Google Scholar]
- 20. Spudich A, Kilic E, Xing H, et al. Inhibition of multidrug resistance transporter-1 facilitates neuroprotective therapies after focal cerebral ischemia. Nat Neurosci. 2006;9:487–488. [DOI] [PubMed] [Google Scholar]
- 21. Candelario-Jalil E, Gonzalez-Falcon A, Garcia-Cabrera M, Leon OS, Fiebich BL. Post-ischaemic treatment with the cyclooxygenase-2 inhibitor nimesulide reduces blood-brain barrier disruption and leukocyte infiltration following transient focal cerebral ischaemia in rats. J Neurochem. 2007;100:1108–1120. [DOI] [PubMed] [Google Scholar]
- 22. Gubern C, Hurtado O, Rodriguez R, et al. Validation of housekeeping genes for quantitative real-time PCR in in-vivo and in-vitro models of cerebral ischaemia. BMC Mol Biol. 2009;10:57. [DOI] [PMC free article] [PubMed] [Google Scholar]
- 23. Frankowski JC, DeMars KM, Ahmad AS, et al. Detrimental role of the EP1 prostanoid receptor in blood-brain barrier damage following experimental ischemic stroke. Sci Rep. 2015;5:17956. [DOI] [PMC free article] [PubMed] [Google Scholar]
- 24. Yang J, Aschner M. Developmental aspects of blood-brain barrier (BBB) and rat brain endothelial (RBE4) cells as in vitro model for studies on chlorpyrifos transport. Neurotoxicology. 2003;24:741–745. [DOI] [PubMed] [Google Scholar]
- 25. Yang C, DeMars KM, Hawkins KE, Candelario-Jalil E. Adropin reduces paracellular permeability of rat brain endothelial cells exposed to ischemia-like conditions. Peptides. 2016;81:29–37. [DOI] [PubMed] [Google Scholar]
- 26. Dazert P, Suofu Y, Grube M, et al. Differential regulation of transport proteins in the periinfarct region following reversible middle cerebral artery occlusion in rats. Neuroscience. 2006;142:1071–1079. [DOI] [PubMed] [Google Scholar]
- 27. Garbuzova-Davis S, Rodrigues MC, Hernandez-Ontiveros DG, et al. Blood-brain barrier alterations provide evidence of subacute diaschisis in an ischemic stroke rat model. PLoS ONE. 2013;8:e63553. [DOI] [PMC free article] [PubMed] [Google Scholar]
- 28. Robertson SJ, Kania KD, Hladky SB, Barrand MA. P-glycoprotein expression in immortalised rat brain endothelial cells: comparisons following exogenously applied hydrogen peroxide and after hypoxia-reoxygenation. J Neurochem. 2009;111:132–141. [DOI] [PubMed] [Google Scholar]
- 29. Fang W, Lv P, Geng X, et al. Penetration of verapamil across blood brain barrier following cerebral ischemia depending on both paracellular pathway and P-glycoprotein transportation. Neurochem Int. 2013;62:23–30. [DOI] [PubMed] [Google Scholar]
- 30. Nayak AR, Kashyap RS, Kabra D, Purohit HJ, Taori GM, Daginawala HF. Time course of inflammatory cytokines in acute ischemic stroke patients and their relation to inter-alfa trypsin inhibitor heavy chain 4 and outcome. Ann Indian Acad Neurol. 2012;15:181–185. [DOI] [PMC free article] [PubMed] [Google Scholar]
- 31. Bergeron M, Yu AY, Solway KE, Semenza GL, Sharp FR. Induction of hypoxia-inducible factor-1 (HIF-1) and its target genes following focal ischaemia in rat brain. Eur J Neurosci. 1999;11:4159–4170. [DOI] [PubMed] [Google Scholar]
- 32. Hirsch-Ernst KI, Ziemann C, Foth H, Kozian D, Schmitz-Salue C, Kahl GF. Induction of mdr1b mRNA and P-glycoprotein expression by tumor necrosis factor alpha in primary rat hepatocyte cultures. J Cell Physiol. 1998;176:506–515. [DOI] [PubMed] [Google Scholar]
- 33. Sukhai M, Yong A, Pak A, Piquette-Miller M. Decreased expression of P-glycoprotein in interleukin-1beta and interleukin-6 treated rat hepatocytes. Inflamm Res. 2001;50:362–370. [DOI] [PubMed] [Google Scholar]
- 34. Garbuzova-Davis S, Haller E, Williams SN, et al. Compromised blood-brain barrier competence in remote brain areas in ischemic stroke rats at the chronic stage. J Comp Neurol. 2014;522:3120–3137. [DOI] [PMC free article] [PubMed] [Google Scholar]
- 35. Herz J, Reitmeir R, Hagen SI, et al. Intracerebroventricularly delivered VEGF promotes contralesional corticorubral plasticity after focal cerebral ischemia via mechanisms involving anti-inflammatory actions. Neurobiol Dis. 2012;45:1077–1085. [DOI] [PMC free article] [PubMed] [Google Scholar]
- 36. McCaffrey G, Staatz WD, Sanchez-Covarrubias L, et al. P-glycoprotein trafficking at the blood-brain barrier altered by peripheral inflammatory hyperalgesia. J Neurochem. 2012;122:962–975. [DOI] [PMC free article] [PubMed] [Google Scholar]
- 37. Zhang J, Zhang M, Sun B, et al. Hyperammonemia enhances the function and expression of P-glycoprotein and Mrp2 at the blood-brain barrier through NF-kappaB. J Neurochem. 2014;131:791–802. [DOI] [PubMed] [Google Scholar]
- 38. Miah MK, Shaik IH, Bickel U, Mehvar R. Effects of hepatic ischemia-reperfusion injury on the P-glycoprotein activity at the liver canalicular membrane and blood-brain barrier determined by in vivo administration of rhodamine 123 in rats. Pharm Res. 2014;31:861–873. [DOI] [PubMed] [Google Scholar]
- 39. Huls M, van den Heuvel JJ, Dijkman HB, Russel FG, Masereeuw R. ABC transporter expression profiling after ischemic reperfusion injury in mouse kidney. Kidney Int. 2006;69:2186–2193. [DOI] [PubMed] [Google Scholar]
- 40. Conze D, Weiss L, Regen PS, et al. Autocrine production of interleukin 6 causes multidrug resistance in breast cancer cells. Cancer Res. 2001;61:8851–8858. [PubMed] [Google Scholar]
- 41. Mukherjee B, Mukhopadhyay R, Bannerjee B, et al. Antimony-resistant but not antimony-sensitive Leishmania donovani up-regulates host IL-10 to overexpress multidrug-resistant protein 1. Proc Natl Acad Sci U S A. 2013;110:E575–E582. [DOI] [PMC free article] [PubMed] [Google Scholar]
- 42. Murozono M, Matsumoto S, Okada S, Nagaoka D, Isshiki A, Watanabe Y. Reduction of brain infarction induced by a transient brain ischemia in mdr1a knockout mice. Neurochem Res. 2009;34:1555–1561. [DOI] [PubMed] [Google Scholar]
- 43. Kooij G, Mizee MR, van Horssen J, et al. Adenosine triphosphate-binding cassette transporters mediate chemokine (C-C motif) ligand 2 secretion from reactive astrocytes: relevance to multiple sclerosis pathogenesis. Brain. 2011;134:555–570. [DOI] [PubMed] [Google Scholar]
- 44. Deli MA, Abraham CS, Takahata H, Niwa M. Tissue plasminogen activator inhibits P-glycoprotein activity in brain endothelial cells. Eur J Pharmacol. 2001;411:R3–R5. [DOI] [PubMed] [Google Scholar]
- 45. Del Zoppo GJ, Saver JL, Jauch EC, Adams HP, Jr; American Heart Association Stroke C. Expansion of the time window for treatment of acute ischemic stroke with intravenous tissue plasminogen activator: a science advisory from the American Heart Association/American Stroke Association. Stroke. 2009;40:2945–2948. [DOI] [PMC free article] [PubMed] [Google Scholar]