Abstract
A main source of failures in systems projects (including systems pharmacology) is poor communication level and different expectations among the stakeholders. A common and not ambiguous language that is naturally comprehensible by all the involved players is a boost to success. We present bStyle, a modeling tool that adopts a graphical language close enough to cartoons to be a common media to exchange ideas and data and that it is at the same time formal enough to enable modeling, analysis, and dynamic simulations of a system. Data analysis and simulation integrated in the same application are fundamental to understand the mechanisms of actions of drugs: a core aspect of systems pharmacology.
Keywords: Graphical modeling, design tools and techniques, user-centered design, data analysis, modeling and simulation, stochastic and hybrid simulation algorithms
Introduction
There is no single definition of systems pharmacology, but the most used ones refer to the understanding of how administered drugs work on biological networks at different scales of the human body. In addition, the word systems is a clear link to the field of systems biology that aims at understanding how biological processes as a whole run and control our organism. Finally, even if not necessarily included in the definition, current practice of systems disciplines consists in acquiring huge amounts of data of many different kinds. Reconciling the findings from different data types in a single model view is a current challenge that also systems pharmacology has to face.
Systems disciplines applied to biology-related fields stem from control theory, engineering, and physiology.1–5 A main tool to understand the mechanistic details of biological processes is network theory in all its aspects: inference, construction, analysis, and simulation.1,6,7 Recently, computer science has added to the discipline the huge experience gained in the development and maintenance of complex networks such as the Internet. Many authors are indeed comparing biological systems with computational systems, and the biological processes are information-processing activities.2,5,8
The metaphor connecting biology and computer networks or information-processing systems opens many avenues to reuse all the theory and tools developed to manage large computer networks in a biological context. A particularly relevant field for systems pharmacology is modeling and simulation to explore the mechanisms of action of drugs. There are many different techniques to model and simulate biological systems: equation-based, network-based, or programming language–based techniques. Unfortunately, all of these approaches require deep mathematical and formal-language expertise that usually are not among the competences of biologists or medical doctors. At the same time, project management clearly shows that modeling activities fail if not all the stakeholders are actively participating in the development since the very first phases.
Graphical modeling technologies in biology have emerged as a way of closing the gap between biologists and mathematicians during the modeling phase.9–11 The syndrome of a new problem means a new graphical symbol has quickly led to an excessive graphical complexity to serve the purpose of helping biologists being part of the modeling process.12 Furthermore, the large number of basic symbols makes the graphical formalisms proposed difficult to use for the modelers who tend to look back at the real math for speeding up their job.
Recently, in a study by Gostner et al,13 we proposed a minimal graphical language that has only 5 symbols and 3 types of arrows and that is suitable to model most of the molecular mechanisms in a classical pathway framework. The graphical language has been implemented as part of the visual modeling approach of bStyle, an application that not only can help modelers to easily interact with biologists but also can support the goal of standardizing the repositories of models a company or a group produces, allowing for exchange and upgrades at later stages. This article reviews the graphical components of the language and presents the visual modeling approach in the software. Brief details of the simulation and analytical capacity of bStyle are presented as well.
Methods and Results
Several tools,12,14–17 each with its own strengths, are currently being widely used to help researchers in modeling biological processes, but none of them can be used easily without an appropriate amount of training and adaptation. We avoided the new modeling case, new graphical symbols syndrome of which many graphical languages and tools seem to suffer.12,16,17 An additional issue of large and ever-growing graphical languages is that it becomes more and more difficult to disambiguate representations in such a way that an automatic translation into a formal language suitable to analysis and simulation becomes difficult to manage.
We have previously devoted a huge effort in identifying a minimal set of graphical symbols that allows to model most of the biological systems at molecular level.13 We also conducted an online survey (as detailed in a study by Gostner et al13 with the results and the comparison with other graphical languages) to check with biologists the look of the language design to ensure easiness of communication between the modelers and their customers, ie, biologists and medical doctors. The resulting graphical language STYLE has 3 types of arrows and 5 types of nodes to build a biological interaction network on top of a rich cellular spatial structure to enable localization of molecules and reactions. Figure 1 shows the symbols of the language, and the caption of the figure briefly recalls their meaning.
Figure 1.
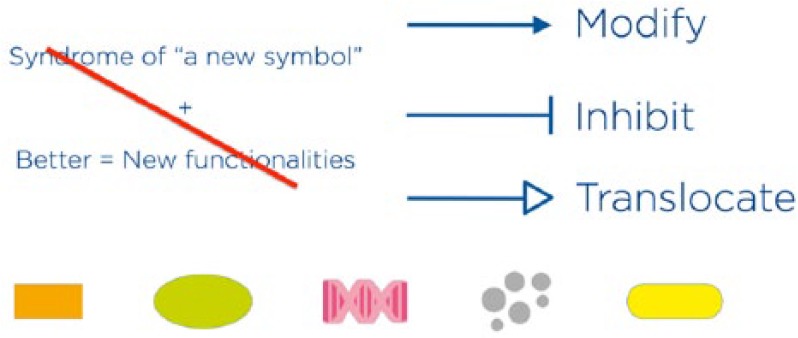
The 3 arrows on the top-right corner of the figure represent, respectively, modifications (actions of a molecule on another, such as phosphorylation and ubiquitination, with positive results), inhibitions (negative effect of a molecule on another), and translocations (movement of a molecule from one compartment to another). An additional dashed line arrow is available for adding narrative clues with no specific biomolecular counterpart. The symbols at the bottom of the figure represent from left to right small molecules (eg, metabolites or drugs), proteins, gene-related material (eg, DNA, RNA, messenger RNA, and microRNA), raw material to represent de novo synthesis and degradation of components, and generic node to model whatever cannot be modeled with the previous node types.
The bStyle modeling platform
bStyle was implemented as a user-centered application providing intuitive access to powerful tools for modeling, analysis, and simulation of biological systems. The application is an integrated environment organizing together several contextual core features. A biology-oriented graphical user interface sporting the interactive painting of cell components offers a natural experience in modeling molecular processes in their hierarchical spatial structure by simply drawing in the cellular space. In fact, molecular species are created with a single click, and interactions and membranes are interactively painted underneath the mouse pointer.
A rich compartmental structure can be modeled using the membrane tools Cytosol, Nucleus, Mitochondrion, Endoplasmic Reticulum, Golgi and Organelle. The Cell Membrane delimiting the painted Cytosol can host molecules, interactions, and translocations. The appealing and intuitive visual modeling process in bStyle ensures that any drawn model corresponds to a biological structure. In case a biologically unreal painting is attempted, interactive visual highlights and unobtrusive status messages help the user understand why the mouse movements are not being instantly translated into biomolecular entities.
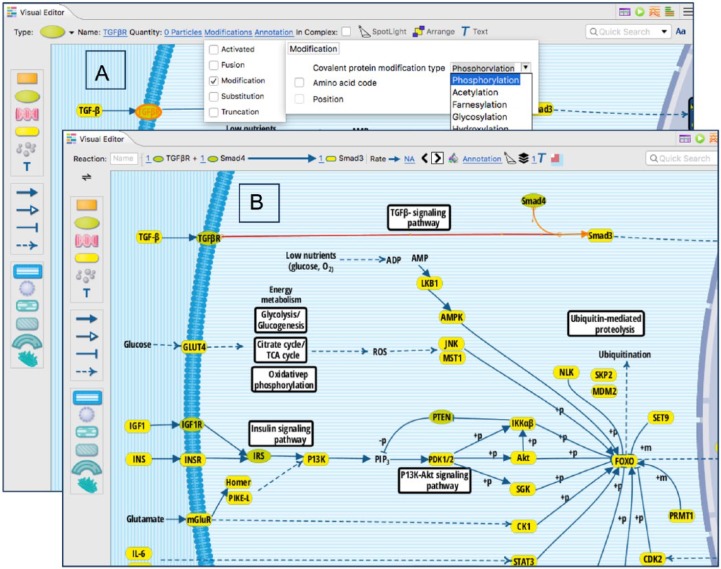
The available substance tools, each with its own peculiar visual style, are small molecule, protein, nucleic acid, generic element, and raw material. Substances can appear as substrates, products, or catalysts in graphical reactions describing modifications, inhibitions, or translocations across the cellular compartments as, for instance, protein transport. The minimal number of molecules and interaction types available has been visually characterized to help user’s entity recognition and simplify model drawing. Nonetheless, each visual category can be further biologically categorized as easily as clicking on a checkbox to describe alterations and changes of species, such as truncations, fusions, or phosphorylations (Figure 2A). Extra subclassifications appear as indicators on the original shapes.
Figure 2.
The visible model is an excerpt of the KEGG (Kyoto Encyclopedia of Genes and Genomes) FoxO signaling pathway in humans as appears after importing in bStyle. The 2 screenshots show the parameterizations for 2 different selected objects that bStyle highlights with an orange border. (A) Transforming growth factor receptor (TGF-βR) on the cytomembrane is selected and the toolbar presents its configurable details. New subclassification user interface levels are available from the toolbar to fulfill user’s need for fine-grained properties. In this case, the click sequence of the user was “Modifications” in toolbar, “Modification” in the selection list, and then “Phosphorylation” from a complete list of possible covalent protein modification statuses. (B) The TGF-β signaling pathway, that KEGG simplifies to a horizontal cascade arrow, is presented accordingly in the model and in its counterpart toolbar representation, showing the intervention of SMAD4 to result in SMAD3.
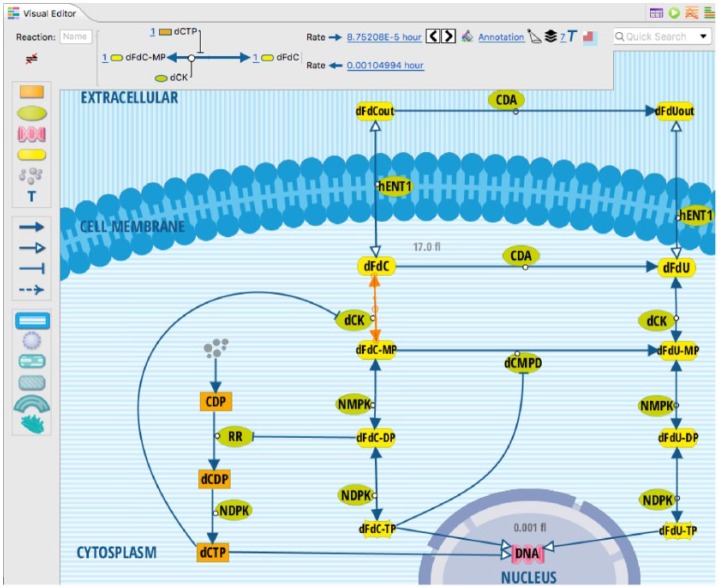
The live model senses user’s interaction and displays entity-specific parameterizations only when needed, avoiding the cluttered workspaces as usually seen in other applications. The intelligent toolbars featured in bStyle offer a handwritten-like text representation of the biochemistry corresponding to the selected visual entity. The textual representation is annotated with active figures for the parameters that can be edited inline with a single click. The smart representation scheme combining text and graphics delivers a rational and enjoyable manipulation of the involved components, being convenient when multiple products and substrates are involved in multiply catalyzed reactions or processes involving enzymatic transformations or compounds, all of them typically requiring accurate definition and parameterization (Figure 3).
Figure 3.
The gemcitabine cascades described in Garcĺa-Manteiga et al.18, here modeled with bStyle. The user has selected the phosphorylation by deoxycytidine kinase (dCK) of gemcitabine (dFdC) to its monophosphate dFdC-MP. The entire transformation is presented in the toolbar with a familiar symbolism. Additional nonuser-selected entities are presented as well to provide the most complete representation of the modeled process. In this case, the competition of gemcitabine with the natural nucleoside deoxycytidine diphosphate (dCTP) modeled as the inhibition on dCK via binding with dCTP is clear. Link numbers in the toolbar stand for the corresponding stoichiometric coefficients that can be edited with a click as happens for the rates.
To add visual insights to their models, modelers can use the text & shape tool to create customizable shapes or utf-8 labels supporting any usual math and Greek sign (Figure 2B). The graphical text & shape objects can be colored and configured either ad hoc per single element or through a data-driven mapping rule applied to the entire model. In the latter case, the resulting colors, sizes, and shapes of the graphical elements are a function of the value of their attributes, thereby directly associating the observed visual characters of the model with its underlying data. All interaction arrows can be applied custom colors as well (Figure 6) to mark specific subprocesses and can be bended by simply stirring with the mouse pointer the line of the arrow. The resulting high-end looking model can be exported as vector graphics or raster formats for publications. To the best of our knowledge, all these user-centered features cannot be found in any other tool.
Figure 6.
When many attributes and annotations are added to the model, bStyle offers a comfortable way of accessing them all from the visual model. Clicking on the “Annotation” link, a compartmentalized view of the selected element is presented along with all its attributes and annotations, if any, as if it was seen on the tabular view. In complex models, this verticalization is helpful together with the visual model not only by instantly showing the full hierarchy of the selected model but also by providing all associated data right at one’s fingertip. Note how the user changed the color of selected interaction arrows to facilitate the visual aggregation and identification of specific subprocesses of interest.
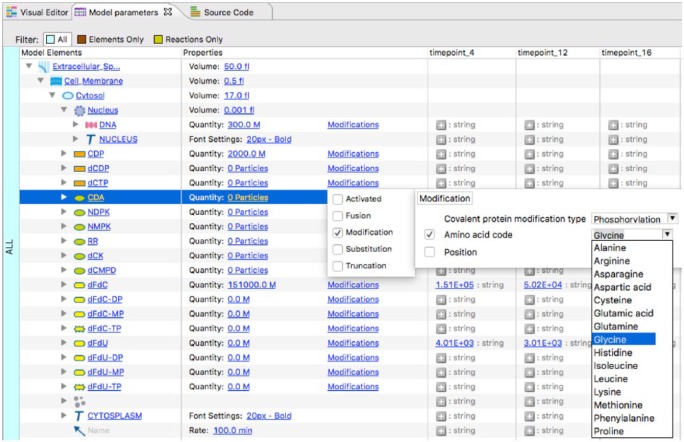
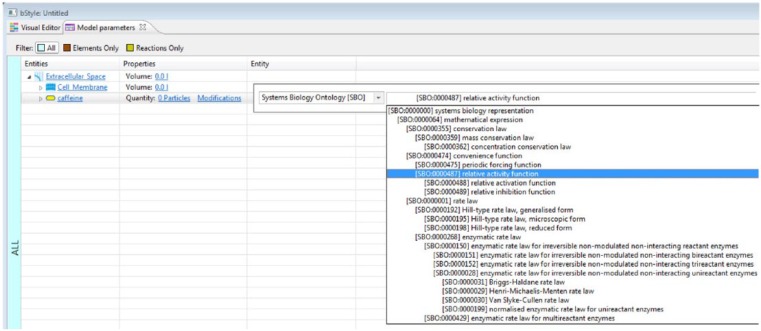
The visual model can also be explored and revised in a tabular view resembling the usual excel worksheets improving on the narrative and tabular styles introduced in COSBI LAB.19 The table preserves the hierarchical compartmental structure that can be navigated with simple 1-click expansions and contractions of the membranes (Figure 4). The tabular model lists all elements accompanied by their editable details rendered in a handwriting-like format. The visual and tabular views are always in sync, and the changes from one tab are immediately reflected in the other allowing for side-by-side work, thereby exploiting the specific features of each view. The instant search available in the tabular view pinpoints specific items out of, possibly, hundreds of thousands but retaining the hierarchical modeling context. Along with traditional biochemical parameters, custom attributes can be added to enrich the model with specific information. Each attribute appears as an additional column reporting the value. External data set files containing information on the model can be imported in bStyle, a typical example being the integration of external transcription data. Hierarchical annotations, or ontologies, that typically refer to an external knowledge repository can be easily attributed to model elements. For example, Gene Ontology or System Biology Ontology terms are easily listed, searched for, and assigned to the model components (Figure 5). Finally, the tabular hierarchical verticalization of every element is accessible directly from the visual model as well, unifying the 2 views (Figure 6).
Figure 4.
Tabular view of the gemcitabine model, whose inner compartments have been expanded to show the hierarchical structure. All elements contain active links that allow, in a customary tabular format, to easily inspect or edit any detail of the model. The tree can be filtered via instant search (see also Figure 6) or predefined filters as “Show All,” “Elements only,” or “Reactions only.” The parameterization happens through the same user interfaces seen in the visual model for the best usage experience. Besides the predefined columns “Model Elements” and “Properties,” additional columns can be added manually via user interface or by importing data files. For example, time-series data have been added here as data columns timepoint_4, timepoint_12, and timepoint_16.
Figure 5.
Besides attribute columns of common types as numeric, texts, or series thereof, it is possible to enrich model elements with annotations referring external hierarchically organized ontologies. The Systems Biology Ontology annotation process is shown here, typically used within SBML models and natively supported even when working with non-SBML models. In contrast to other attribute types, the nested structure of IDs with their corresponding descriptions is preserved in the dropdown lists.
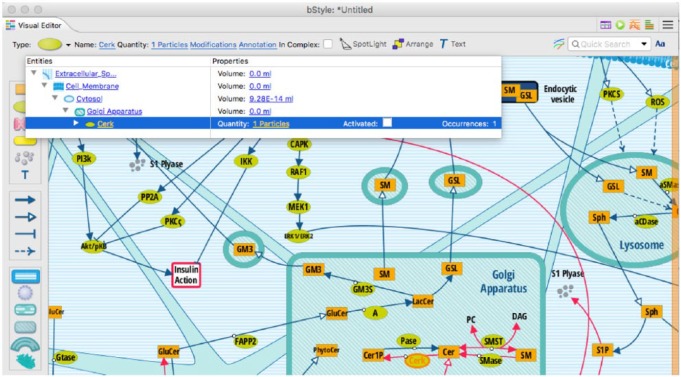
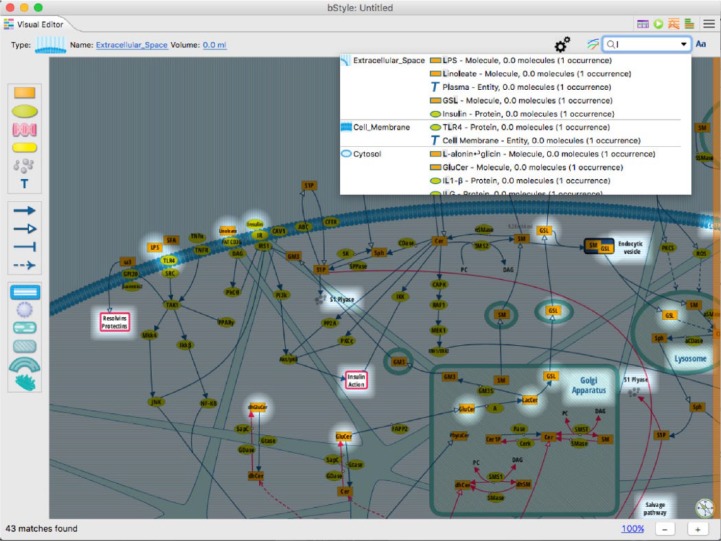
The application supports both deterministic and stochastic parameterizations easing the entire process by allowing the user to enter concentrations and rates in the preferred unit of measures, which may just be the original kinetic or concentration from the reference source. The application recognizes when the modeler opts for entering heterogeneous units and can automatically convert all parameters into consistent units before running the simulation. Supported kinetics for the reaction rates includes mass-action, Michaelis-Menten, Hill, and custom functions. To help the modeler in the process, known volumes for the compartments are automatically provided. The ease of creation and revision of huge models is enhanced by the built-in instant search. Its autosuggestions from partially typed-in text are valuable in quickly identifying the localization of specific items using a spotlight visualization accompanied by textual property details (Figure 7).
Figure 7.
When the modeling complexity increases, spotlight search comes into play to help quickly spot specific elements in crowded models. By autosuggesting search results, the feature assists the user in picking the desired biochemical name. In addition, the visual spotlight highlights the elements identified by the typed characters. The spotlight search view can be retained and saved for publication as well. A “spotlight view” is also available: from the entire model in the shadow, the user can manually turn on the spotlight on the desired elements (with a click). The spotlight mode of the elements is retained internally and can be iteratively updated along time. Spotlights and spotlight searches allow dramatic model picks that can be saved or sent to print.
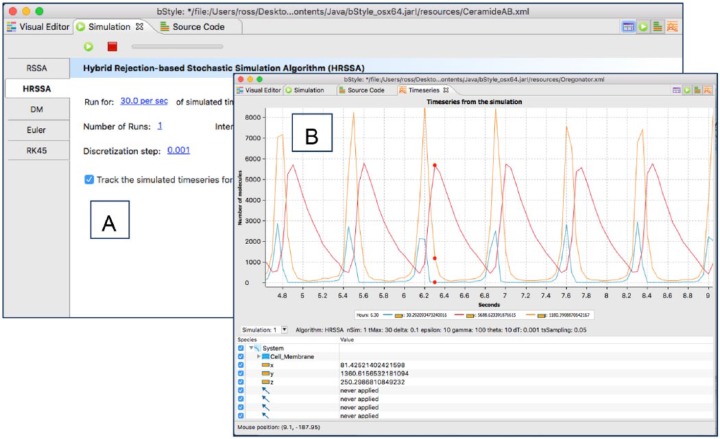
Besides the traditional Euler and Runge-Kutta-Fehlberg-45 deterministic approaches, a set of stochastic simulation algorithms is coherently integrated in bStyle, such as the 2 first-class rejection-based stochastic simulation algorithm20 and hybrid rejection-based stochastic simulation algorithm.21 It is also available an implementation of the traditional stochastic Gillespie22 direct method for comparing the resulting dynamics. In all cases, a uniform user interface allows the configuration of the parameters and the exploration of the associated dynamics (Figure 8A). Customizable time-series viewers are part of the simulation tools integrated in bStyle allowing to filter subsets of the entire model and exporting both graphics and simulated data (Figure 8B). A bStyle bridge to COmplex PAthway SImulator23 is already available, enabling researchers to compare with or extend the number of simulation tools at their disposal into the workspace.
Figure 8.
The simulation toolkit is organized into 2 main tabs, the “Simulation” tab and the “Timeseries” tab. (A) An extensible set of simulation algorithms can be hosted within the rational interface of bStyle. Besides the built-in RSSA, HRSSA, DM, Euler, and RK45 algorithms, a COmplex PAthway SImulator simulation bridge is available to instruct their simulation engines after the currently open model. When the same simulation parameter represents the same concept across different algorithms, then it is presented at the same location on screen allowing to compare different algorithms on the same parameters. Common for all algorithms is the possibility to preselect, before running the simulation, a subset of the model either through a direct selection from the hierarchical element list or using only the selected or spotlighted elements (if any). (B) The simulated model is graphically presented through the time series of its elements. A compartment filter is available along with a rich set of useful graphical options to analyze the results. DM indicates direct method; HRSSA, hybrid rejection-based stochastic simulation algorithm; RSSA, rejection-based stochastic simulation algorithm.
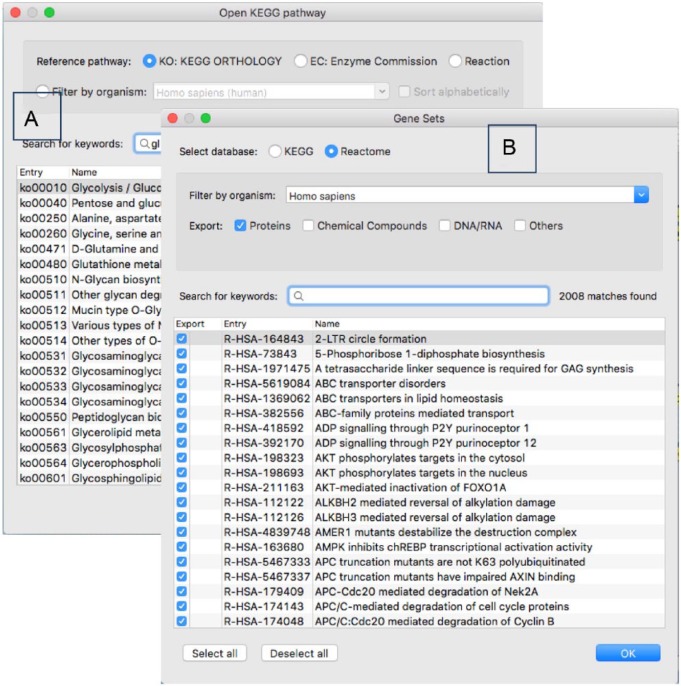
bStyle provides direct connection to selected relevant external databases (DBs), such as Reactome24 and Kyoto Encyclopedia of Genes and Genomes.25 From the DB window, it is possible to instantly search and identify organisms and pathway maps of interest. The networks are then imported into bStyle from the Internet, thereby allowing to quickly build models starting from the reference pathways. An additional benefit is that the naming conventions adopted by different DBs are harmonized and presented in a single user interface again simplifying considerably all the work in navigating and selecting external resources (Figure 9). Particularly relevant in an analyst’s everyday work is the possibility to create and work with genesets and edgesets from the canonical pathways published on such web resources. bStyle allows to easily export, in a Gene Matrix Transposed (GMT)-compatible format used in MSigDB,26 the required pathway(s) selected from thousands of organisms available on the external resources. The accessibility of many DBs, each providing different identification schemes, motivates the existence of a conversion feature in bStyle allowing to easily translate names, possibly coming from many different DB namespaces, into a single selected target. The conversion can be applied to an entire model or only to a subset of selected components and allows to consistently map all names into a uniform namespace DB, for example, into Entrez identifiers.
Figure 9.
Interoperability with external services is naturally available with uniform interfaces harmonizing possible differences across different providers. Therefore, opening a pathway map or the creation of a geneset or an edgeset shows up with a very similar aspect with clear differences to differentiate the different processes. (A) Opening a remote pathway, it is just a matter of selecting the remote database (DB) and then picking the requested pathway with the customary autosuggest search boxes and DB-specific features. (B) For generating genesets and edgesets, the user can select the DB, the kind of molecules to export from the available ones in the selected DB, and save to standard GMT format for further external processing.
With the interactive visual editor in bStyle, a step forth is made in the exchange of ideas among different stakeholders during the modeling phase. Built-in tools then help to comfortably work on the network itself, its quantitative details, and the relations with external DBs and ontologies. Integrated simulation tools provide information on the process dynamics in a unified environment. To maximize the quality obtainable from the modeling phase, bStyle then strongly supports a range of interoperability mechanisms, allowing to easily combine the strengths of bStyle with those of other tools. Specifically, bStyle is currently able to import and export models encoded in BEL,27 XGMML,28 and all available levels and versions of SBML,29 including the support for the companion SBGN10 graphical notation. Each standard is naturally more targeted to specific areas of research that are bridged together through bStyle. A conversion report tool is being implemented to help users in case of unsupported constructs or alternatives in the interested standards. This is especially useful with SBML due to the variety of constructs allowed across different levels and versions, but turns out to be crucial having a clear map of what was translated and how also for other formats.
For maximum portability, bStyle is developed as a Java application. Improving the user-centered design implemented in study by Lombardo et al,30 bStyle exploits the SWT library,31 offering a native look and feel on each platform and supplying the best modeling experience to every user. All tools in bStyle can be added or removed from the application as simple add-ons, thereby allowing to arrange the perfect feature set tailored around a user’s modeling needs.
The bStyle platform is a proprietary technology, but its usability is detailed in a video tutorial available at the URL http://www.cosbi.eu/modeling-and-simulation. If interested in using the platform, please contact the corresponding author.
Discussion
To illustrate the usage of bStyle, we briefly describe how it helped in some research projects covering modeling, simulation, as well as data analysis.
Algorithmic modeling quantifies the complementary contribution of metabolic inhibitions to gemcitabine efficacy
Gemcitabine (2,2-difluorodeoxycytidine [dFdC]) is used in the treatment of various carcinomas and as a chemotherapeutic agent, although very often patients are resistant to gemcitabine.32 To gain a better understanding of the mechanisms of resistance to gemcitabine in cancer treatment, a modeling and simulation approach was undertaken in a study by Kahramanoğullari et al.33 The effect of gemcitabine on tumor cells18,34–36 is produced by the inhibition of the DNA synthesis (see Figure 3). In fact, when gemcitabine is transformed into its triphosphate metabolite dFdC-TP and into its deaminated uracil triphosphate metabolite dFdU-TP, the latter replaces the cytidine, one of the building blocks of nucleic acids during DNA replication. This prevents cells from further processing DNA, blocking the cell cycle in the early S phase and causing apoptosis. The absorption of gemcitabine into DNA takes place in competition with the natural nucleoside deoxycytidine diphosphate (dCTP). Gemcitabine, by inhibiting the enzyme ribonucleotide reductase (RR), leads to a lowering of dCTP levels contributing to the enhancement of the dFdC cytotoxic effect. A secondary competition comes from the inhibitions between the 2 synthesis cascades of the metabolites dFdC-TP and dCTP, exerting a direct competition between the 2 metabolites RR and deoxycytidine kinase (dCK). To better understand how deficiency in dCK, increased dCTP levels, and decreased influx into cell act as interconnected inhibitory mechanisms to the gemcitabine machinery, a sequence of modeling and simulation steps are performed in conjunction with bStyle. bStyle makes the modeling phase as simple as just drawing the cascades, as shown in Figure 3. Species concentrations, taken from the study of Veltkamp et al,35 were used to build a model after some preliminary analytical steps, as described in Kahramanoğullari et al.33 Clicking on the simulation button (with a green “play” icon), the simulation pane opens in a new tab. The appropriate simulation strategy is selected with its parameters (Figure 8A), and on simulation completion, the “Timeseries” explorer automatically opens in a side tab (Figure 8B). By navigating the time-series plot, it is possible to identify process dynamics or isolate specific trajectories by filtering on the simulated hierarchical model. Computed dynamics can be used to further determine the color or layout of the model components enhancing the understanding of the resulting simulated process.
Systems view of adipogenesis via novel omics-driven and tissue-specific activity scoring of network functional modules
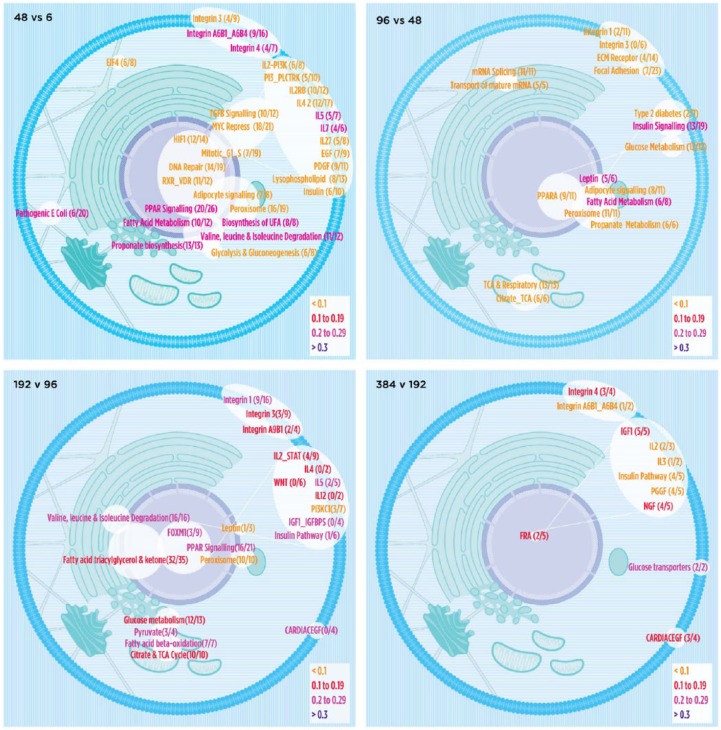
Adipocyte differentiation, or adipogenesis is the process by which pre-adipocytes differentiate into mature functional adipocytes by accumulation of triglycerides.37 Adipogenesis is a fairly well-characterized process, and many of the key genes involved have been previously described in the literature. However, information on the coordinated, time-dependent changes in the pathways involved and the interactions in the adipogenesis process was missing for human adipocytes. To provide the first systems view of human adipogenesis,38 a novel approach is proposed. Within the project, several bStyle features turned out essential especially during the data-preprocessing phase and at the last stages of high-level biological interpretation. Due to the number of different pathway DBs used, bStyle helped to create up-to-date genesets at the core of all the following enrichment steps. Even before, a number of naming conversion activities were easily performed in the visual user interface to ensure that the plethora of different namespaces found across different pathways, gene lists, and network modules could be uniformly and consistently used together. Specifically, those included Illumina IDs, Entrez IDs, UniProt IDs, and HUGO gene names. Finally, in bStyle, many results from the project were aggregated together, along with existing external information. The model was then graphically configured with the visual mappings to prepare the cell representations with the localization of identified results and proceed to the completion of the biological interpretation (Figure 10).
Figure 10.
Using external knowledge on the biological localization of the elements, bStyle was used to graphically render the identified pathways with different sizes and colors based on the value of their Network Activity Score. This resulted in the first global view of the active processes in human adipogenesis at the different time points and across time lapses.38
The above 2 are just a couple of examples of usage of bStyle in industrial research projects run at Centre for Computational and Systems Biology in the last months. Although many features are substantial to the success of the projects, the main one is the ability to let all the stakeholders sit around a table and look at the same model being on the same page. The neat outcome of this ability helps in reducing the failure rate of multidisciplinary systems projects by establishing a common language and framework that reduces misunderstanding and discrepancies among expectations of different team members.
Acknowledgments
The authors thank the whole COSBI team for useful discussions and support in the implementation of bStyle.
Footnotes
Peer Review:Seven peer reviewers contributed to the peer review report. Reviewers’ reports totaled 1167 words, excluding any confidential comments to the academic editor.
Funding:The author(s) disclosed receipt of the following financial support for the research, authorship, and/or publication of this article: This research was partially supported by project Zoomer funded by Provincia Autonoma di Trento.
Declaration of Conflicting Interests:The author(s) declared no potential conflicts of interest with respect to the research, authorship, and/or publication of this article.
Author Contributions: Both authors conceived and designed the material reported in the manuscript, wrote the first draft of the manuscript, reviewed, and approved the final manuscript.
References
- 1. Priami C, Morine MJ. Analysis of Biological Systems. London: Imperial College Press; 2015. [Google Scholar]
- 2. Hood L, Galas D. The digital code of DNA. Nature. 2003;421:444–448. [DOI] [PubMed] [Google Scholar]
- 3. Kitano H. Computational systems biology. Nature. 2002;420:206–210. [DOI] [PubMed] [Google Scholar]
- 4. Kitano H. Systems biology: a brief overview. Science. 2002;295:1662–1664. [DOI] [PubMed] [Google Scholar]
- 5. Priami C. Algorithmic systems biology. Comm ACM. 2009;52:80–88. [Google Scholar]
- 6. Barabasi AL, Oltvai ZN. Network biology: understanding the cell’s functional organization. Nat Rev Genet. 2004;5:101–103. [DOI] [PubMed] [Google Scholar]
- 7. Alon U. Introduction to Systems Biology. Boca Raton, FL: Chapman and Hall; 2006. [Google Scholar]
- 8. Nurse P. Life, logic and information. Nature. 2008;454:424–426. [DOI] [PubMed] [Google Scholar]
- 9. Kitano H, Funahashi A, Matsuoka Y, Oda K. Using process diagram for the graphical representation of biological networks. Nat Biotechnol. 2005;23:961–966. [DOI] [PubMed] [Google Scholar]
- 10. Le Novére N, Hucka M, Mi H, et al. The systems biology graphical notation. Nat Biotechnol. 2009;27:735–741. [DOI] [PubMed] [Google Scholar]
- 11. Faeder JR. Toward a comprehensive language for biological systems. BMC Biol. 2011;9:68. [DOI] [PMC free article] [PubMed] [Google Scholar]
- 12. Funahashi A, Tanimura N, Morohashi M, Kitano H. CellDesigner: a process diagram editor for gene-regulatory and biochemical networks. BIOSILICO. 2003;1:159–162. [Google Scholar]
- 13. Gostner R, Baldacci B, Morine MJ, Priami C. Graphical modelling tools for systems biology. ACM Comput Surv. 2014;47:1–21. [Google Scholar]
- 14. Shannon P, Markiel A, Ozier O, et al. Cytoscape: a software environment for integrated models of biomolecular interaction networks. Genome Res. 2003;13:2498–2504. [DOI] [PMC free article] [PubMed] [Google Scholar]
- 15. Resasco DC, Gao F, Morgan F, Novak IL, Schaff JC, Slepchenko BM. Virtual Cell: computational tools for modeling in cell biology. Wiley Interdiscip Rev Syst Biol Med. 2012;4:129–140. [DOI] [PMC free article] [PubMed] [Google Scholar]
- 16. Kurata H, Matoba N, Shimizu N. CADLIVE for constructing a large-scale biochemical network based on a simulation-directed notation and its application to yeast cell cycle. Nucleic Acids Res. 2003;31:4071–4408. [DOI] [PMC free article] [PubMed] [Google Scholar]
- 17. Chandran D, Bergmann FT, Sauro HM. TinkerCell: modular CAD tool for synthetic biology. J Biol Eng. 2009;3:19. [DOI] [PMC free article] [PubMed] [Google Scholar]
- 18. García-Manteiga J, Molina-Arcas M, Casado FJ, Mazo A, Pastor-Anglada M. Nucleoside transporter profiles in human pancreatic cancer cells: role of hCNT1 in 2′,2′-diuorodeoxycytidine-induced cytotoxicity. Clin Cancer Res. 2003;9:5000–5008. [PubMed] [Google Scholar]
- 19. COSBI LAB. http://www.cosbi.eu/research/cosbi-lab. Accessed September 27, 2016.
- 20. Thanh VH, Priami C, Zunino R. Efficient rejection-based simulation of biochemical reactions with stochastic noise and delays. J Chem Phys. 2014;141:134116. [DOI] [PubMed] [Google Scholar]
- 21. Marchetti L, Priami C, Thanh VH. HRSSA—efficient hybrid stochastic simulation for spatially homogeneous biochemical reaction networks. J Comput Phys. 2016;317:301–317. [Google Scholar]
- 22. Gillespie DT. Exact stochastic simulation of coupled chemical reactions. J Phys Chem. 1977;81:2340–2361. [Google Scholar]
- 23. Hoops S, Sahle S, Gauges R, et al. COPASI—a COmplex PAthway SImulator. Bioinformatics. 2006;22:3067–3074. [DOI] [PubMed] [Google Scholar]
- 24. Croft D, Mundo AF, Haw R, et al. The Reactome pathway Knowledgebase. Nucleic Acids Res. 2014;42:D472–D477. [DOI] [PMC free article] [PubMed] [Google Scholar]
- 25. Kanehisa M, Goto S. KEGG: Kyoto Encyclopedia of Genes and Genomes. Nucleic Acids Res. 2000;28:27–30. [DOI] [PMC free article] [PubMed] [Google Scholar]
- 26. Subramanian A, Tamayo P, Mootha VK, et al. Gene set enrichment analysis: a knowledge-based approach for interpreting genome-wide expression profiles. PNAS. 2005;102:15545–15550. [DOI] [PMC free article] [PubMed] [Google Scholar]
- 27. BEL v1.0 Language Documentation. http://wiki.openbel.org/. Accessed September 27, 2016.
- 28. Punin MKJ. XGMML (eXtensible Graph Markup and Modeling Language) 1.0 Draft Specification; vol 2005 http://www.cs.rpi.edu/research/groups/pb/punin/public_html/XGMML/draft-xgmml-20010628.html. Published August 9, 2001. [Google Scholar]
- 29. Hucka M, Finney A, Sauro HM, et al. The systems biology markup language (SBML): a medium for representation and exchange of biochemical network models. Bioinformatics. 2003;19:524–531. [DOI] [PubMed] [Google Scholar]
- 30. Lombardo R, Manca M. Milieu-M: visual manipulation and programming for multi-membranes. Int J Inf Theor Appl. 2012;19:319–327. [Google Scholar]
- 31. The Standard Widget Toolkit. http://www.eclipse.org/swt/. Accessed September 27, 2016.
- 32. Fryer RA, Barlett B, Galustian C, Dalgleish AG. Mechanisms underlying gemcitabine resistance in pancreatic cancer and sensitisation by the iMiDTM lenalidomide. Anticancer Res. 2011;31:3747–3756. [PubMed] [Google Scholar]
- 33. Kahramanoğullari O, Fantaccini G, Lecca P, Morpurgo D, Priami C. Algorithmic modeling quantifies the complementary contribution of metabolic inhibitions to gemcitabine efficacy. PLoS ONE. 2012;7:e50176. [DOI] [PMC free article] [PubMed] [Google Scholar]
- 34. Veltkamp SA, Beijnen JH, Schellens JH. Prolonged versus standard gemcitabine infusion: translation of molecular pharmacology to new treatment strategy. Oncologist. 2008;13:261–276. [DOI] [PubMed] [Google Scholar]
- 35. Veltkamp SA, Pluim D, Eijndhoven MA, et al. New insights into the pharmacology and cytotoxicity of gemcitabine and 2′,2′-diuorodeoxyuridine. Mol Cancer Ther. 2008;7:2415–2425. [DOI] [PubMed] [Google Scholar]
- 36. Ren Q, Kao V, Grem JL. Cytotoxicity and DNA fragmentation associated with sequential gemcitabine and 5-uoro-20-deoxyuridine in HT-29 colon cancer cells. Clin Cancer Res. 1998;4:2811–2818. [PubMed] [Google Scholar]
- 37. Ali AT, Hochfeld WE, Myburgh R, Pepper MS. Adipocyte and adipogenesis. Eur J Cell Biol. 2013;92:229–236. [DOI] [PubMed] [Google Scholar]
- 38. Nassiri I, Lombardo R, Lauria M, et al. Systems view of adipogenesis via novel omics-driven and tissue-specific activity scoring of network functional modules. Sci Rep. 2016;6:28851. [DOI] [PMC free article] [PubMed] [Google Scholar]


