Abstract
The 2-dimensional gel electrophoresis (2-DE) technique is widely used for the analysis of complex protein mixtures extracted from biological samples. It is one of the most commonly used analytical techniques in proteomics to study qualitative and quantitative protein changes between different states of a cell or an organism (eg, healthy and diseased), conditionally expressed proteins, posttranslational modifications, and so on. The 2-DE technique is used for its unparalleled ability to separate thousands of proteins simultaneously. The resolution of the proteins by 2-DE largely depends on the quality of sample prepared during protein extraction which increases results in terms of reproducibility and minimizes protein modifications that may result in artifactual spots on 2-DE gels. The buffer used for the extraction and solubilization of proteins influences the quality and reproducibility of the resolution of proteins on 2-DE gel. The purification by cleanup kit is another powerful process to prevent horizontal streaking which occurs during isoelectric focusing due to the presence of contaminants such as salts, lipids, nucleic acids, and detergents. Erythrocyte membrane proteins serve as prototypes for multifunctional proteins in various erythroid and nonerythroid cells. In this study, we therefore optimized the selected major conditions of 2-DE for resolving various proteins of human erythrocyte membrane. The modification included the optimization of conditions for sample preparation, cleanup of protein sample, isoelectric focusing, equilibration, and storage of immobilized pH gradient strips, which were further carefully examined to achieve optimum conditions for improving the quality of protein spots on 2-DE gels. The present improved 2-DE analysis method enabled better detection of protein spots with higher quality and reproducibility. Therefore, the conditions established in this study may be used for the 2-DE analysis of erythrocyte membrane proteins for different diseases, which may help to identify the proteins that may serve as markers for diagnostics as well as targets for development of new therapeutic potential.
Keywords: Gel electrophoresis, proteomics, erythrocyte membrane proteins, protein solubilization, isoelectric focusing
Introduction
The 2-dimensional gel electrophoresis (2-DE) technique, first established 4 decades ago by O’Farrell, is capable of resolving thousands of proteins in a single procedure.1,2 It is capable of resolving more than 1800 proteins in a single gel and is an important tool for proteomics research as it enables simultaneous analysis of hundreds to thousands of gene products.3,4 The 2-DE gel-based proteomics analysis finds application in determination of conditionally expressed proteins, posttranslational modifications, and in studies on qualitative and quantitative protein changes between 2 or more different states of a cell or an organism.5–7 Association of this technique with mass spectrometry, in combination with computer-assisted software for image evaluation, has enabled 2-DE analysis in comprehensive qualitative and quantitative examination of proteomes as well as in separation and selection of proteins.8 The technique is unique in its ability to detect post- and co-translational protein modifications, which cannot be predicted from the genome sequence.9 Besides proteome analysis, the applications of 2-DE electrophoresis include studies on cell differentiation, uncovering disease markers, monitoring treatments, cancer research, and protein purification.10,11 Currently, 2-DE technique has gained special attention for its enormous ability to study differentially expressed proteins between different groups for comparative proteomic analysis to screen biomarkers and identification of drug targets for therapeutic management.12
In 2-DE technique, during proteome analysis, we come across many challenges, such as sample preparation, solubilization and precipitation of proteins, first-dimension separation, equilibration, second-dimension separation, staining, imaging, image analysis, and protein identification. Therefore, in this study, we proposed to optimize the 2-DE conditions for resolution of proteins of erythrocyte membrane because these proteins serve as prototypes for the multifunctional proteins in various erythroid and nonerythroid cells and perform specific functions in different cell types and tissues.13 The qualitative and quantitative alteration in protein profile of these cell types or tissues may lead to the development of pathophysiology and ultimately the diseases.14 In line with this, we felt a necessity to resolve the erythrocyte membrane proteins by 2-DE. In 2-DE, one of the most important steps is the preparation of sample containing properly solubilized proteins, free from contaminants such as proteases, nucleic acids, lipids, and salts, which are known to interfere with the separation and staining of proteins in 2-DE gels.15–18 Sample preparation and protein solubilization from the cells, eg, human erythrocytes, which mostly contain hydrophobic proteins in association with lipids, need extra modifications of the existing methods to dissociate these proteins from the lipophilic environment. Thus, good sample preparation for solubilization of proteins, followed by protein extraction, is critical for efficient and reproducible 2-DE technique.18–22 Conventional approaches for protein solubilization and modification do not reliably provide the best samples for the technique. Commercially available kits for protein extraction and other purposes of 2-DE are considerably simple to use and have improved the sensitivity and reproducibility of the 2-DE technique, yet they have limited use and do not always give desired results. In addition, during first dimension, inappropriate isoelectric focusing (IEF) may lead to the horizontal streaking on 2-DE gels which may result in low resolution of protein spots.7,23 The horizontal streaking may be caused by a number of other factors as well, which include excess amount of rehydration buffer absorbed by the strips, sample solubility, high viscosity of protein samples, and overloading, along with the presence of nonproteinaceous material (eg, nucleic acid and lipids).17 To find the optimum and most robust conditions for 2-DE of erythrocyte membrane proteins, we established the condition for solubilization of the complex protein mixtures, protein purification for removal of contaminants, focusing time for IEF, incubation period in equilibrium buffers to minimize background, and storage condition of immobilized pH gradient (IPG) strips reported in this communication.
Materials and Methods
Chemicals and biochemicals
Acrylamide, agarose, bovine serum albumin (BSA), bromophenol blue, 3-[(3-cholamidopropyl) dimethylammonio]-1-propanesulfonate (CHAPS), dithiothreitol (DTT), Histopaque (specific gravity 1.077), iodoacetamide (IAA), methylenebisacrylamide, phenylmethane sulfonyl fluoride (PMSF), and Trizma were purchased from Sigma Chemical Co. (St. Louis, MO, USA). Immobilized pH gradient strips, BioLyte 3/10, mineral, 2-DE cleanup kit, and 2-DE sodium dodecyl sulfate polyacrylamide gel electrophoresis (SDS-PAGE) marker proteins (cat. no. 161-0320) were purchased from Bio-Rad (Hercules, CA, USA). Acetic acid, acetone, ammonium persulfate, ethanol, glycine, silver nitrate, sodium carbonate, sodium chloride, sodium dihydrogen phosphate, disodium hydrogen orthophosphate, sodium dodecyl sulfate (SDS), sodium thiosulfate, urea, and thiourea were purchased from Sisco Research Laboratories Pvt. Ltd. (Mumbai, India). Glycerol and formaldehyde were procured from Qualigen (Carlsbad, CA, USA). All other chemicals used were of analytical grade.
Collection of blood and preparation of erythrocyte membrane
The human subjects of either sex (age range: 18-60 years) were enrolled in the study from the outpatient department of Viswanathan Chest Hospital, Vallabhbhai Patel Chest Institute, University of Delhi, Delhi, India. All the subjects (n = 5) were healthy and nonsmokers and were not on any medication. The study was conducted after obtaining approval from the Ethics Committee of the Institute vide letter dated January 21, 2014.
Peripheral blood (5 mL) was collected from each subject by venipuncture in EDTA vials under aseptic conditions.14 Lymphocytes were separated by the method of Boyum.24 Briefly, the blood was diluted 1:1 with physiological saline (0.15 M NaCl solution), layered on Histopaque (specific gravity 1.077), and centrifuged at 2000 rpm (410g) (Z36 HK; Hermle Labortechnik GmbH, Wehingen, Germany) for 10 minutes at 4°C. The interface containing lymphocytes along with plasma was removed. The packed red cells were washed 4 times with 4 volumes of physiological saline by centrifugation at 6000 rpm (3700g) for 10 minutes at 4°C and used for preparation of the membrane.
The erythrocyte membrane was prepared by the method of Hanahan and Ekholm.25 To 1.0 mL of packed red blood cells, 40 mL of 5 mM sodium phosphate buffer, pH 8.0 (5P8) containing PMSF (1 mM) as a protease inhibitor was added. The contents were mixed thoroughly, kept at 4°C for 1 hour to lyse the cells, and then centrifuged at 15 000 rpm (23,140g) for 20 minutes at 4°C. The supernatant was discarded. The pellet containing erythrocyte membrane was washed thrice similarly, suspended in 5P8 buffer, and stored at −80°C for further study.
Two-dimensional gel electrophoresis
Solubilization and extraction of proteins
The erythrocyte membrane proteins were solubilized in urea lysis buffer (7 M urea, 2% wt/vol CHAPS, and 50 mM DTT). The protein concentration was estimated by reagent compatible and detergent compatible (RC-DC) protein assay kit (Bio-Rad), and the readings were taken at 750 nm (T90+ UV/VIS spectrophotometer; PG Instruments Ltd., Lutterworth, UK). To remove the contamination from the solubilized erythrocyte membrane protein samples, various combinations, namely, (a) urea lysis buffer (7 M urea, 2% wt/vol CHAPS, and 50 mM DTT) without cleanup, (b) urea lysis buffer (7 M urea, 2% wt/vol CHAPS, and 50 mM DTT) with cleanup, (c) urea/thiourea lysis buffer (7 M urea, 2 M thiourea, 4% CHAPS, 50 mM DTT) with cleanup, and (d) urea/thiourea lysis buffer with ice-cold acetone were used. The protein contents of the samples obtained after cleanup were again estimated by RC-DC protein assay kit. The cleanup resulted in 5% to 10% (mean ± SD: 8.95 ± 0.68) less protein contents in the sample. This could possibly be due to the removal of contaminants present in the protein samples. A loss of this magnitude of protein amount has also been considered to be acceptable by other workers so long the protein of interest is present in it in detectable amount.26–28 A standard curve of protein was prepared using BSA as reference protein. The erythrocyte membrane sample was also treated with ice-cold acetone for protein extraction. The precipitated proteins were suspended in rehydration buffer (7 M urea, 2% CHAPS, 50 mM DTT, 0.2% wt/vol BioLyte 3/10, and 0.001% wt/vol bromophenol blue).
Isoelectric focusing
The IPG strips (11 cm, pH: 3-10 and 4-7) were rehydrated for 12 hours at 25°C with 185 µL rehydration buffer containing 60 µg protein samples. The proteins on the strips were then focused on an IEF unit PROTEAN i12 IEF Cell (Bio-Rad) at 20°C. The IEF program was initiated at a low voltage (50 V, 2 hours, rapid gradient; 250 V, 1 hour, rapid gradient; 500 V, 1 hour, rapid gradient; 1000 V, 1 hour, rapid gradient) and then raised linearly to 8000 V for 1 hour with the maximum current limit of 50 µA/strip throughout the procedure. This was followed by focusing at 20 000, 30 000, and 40 000 V h in separate experiments.
Reduction and alkylation
Following IEF, the IPG strips were held vertically to remove residual rehydration buffer and mineral oil and equilibrated in equilibration buffer I (6 M urea, 2% wt/vol SDS, 0.375 M Tris [pH 8.8], 20% vol/vol glycerol, and 2% wt/vol DTT) for 20 minutes at 25°C with continuous gentle shaking. The strips were again equilibrated in buffer II (2.5% wt/vol IAA in place of DTT in buffer I) for 20 minutes. After equilibration, strips were rinsed 5 times in fresh 1× Tris-glycine-SDS buffer (25 mM Tris-base, 192 mM glycine [pH 8.3], 1% wt/vol SDS).
Proteins were separated in second dimension on 12% SDS-PAGE in a vertical electrophoresis unit (PROTEAN II XI; Bio-Rad) at a constant voltage of 100 V until the dye front reached 0.5 cm above the bottom of the gel. The gels were fixed in a mixture of 40% vol/vol ethanol and 10% vol/vol glacial acetic acid for 12 hours with continuous gentle shaking and then silver stained to visualize protein spots.29,30 For determining the pI and molecular weight (MW) of the proteins, 2-DE SDS-PAGE reference marker proteins (Bio-Rad) were used (Figure 1). The marker proteins (7.0 µL) diluted in rehydration buffer (total volume: 185 µL) were used for rehydration of IPG (pH: 3-10) followed by IEF and development of 2-DE gel as per the details mentioned above. The stained gels were scanned in a gel documentation system (Gel Doc XR+; Bio-Rad). The 2-DE gels of erythrocyte membrane proteins were superimposed with the marker protein gel image to determine pI and relative MW of the protein spots. The marker proteins consisted of a combination of 7 proteins, with MW ranging between 76 and 17.5 kDa. We focused on a specific area of the proteins with MW ranging between 36 and 21.5 kDa. The analysis of the images was done using PDQuest software (Bio-Rad).
Figure 1.
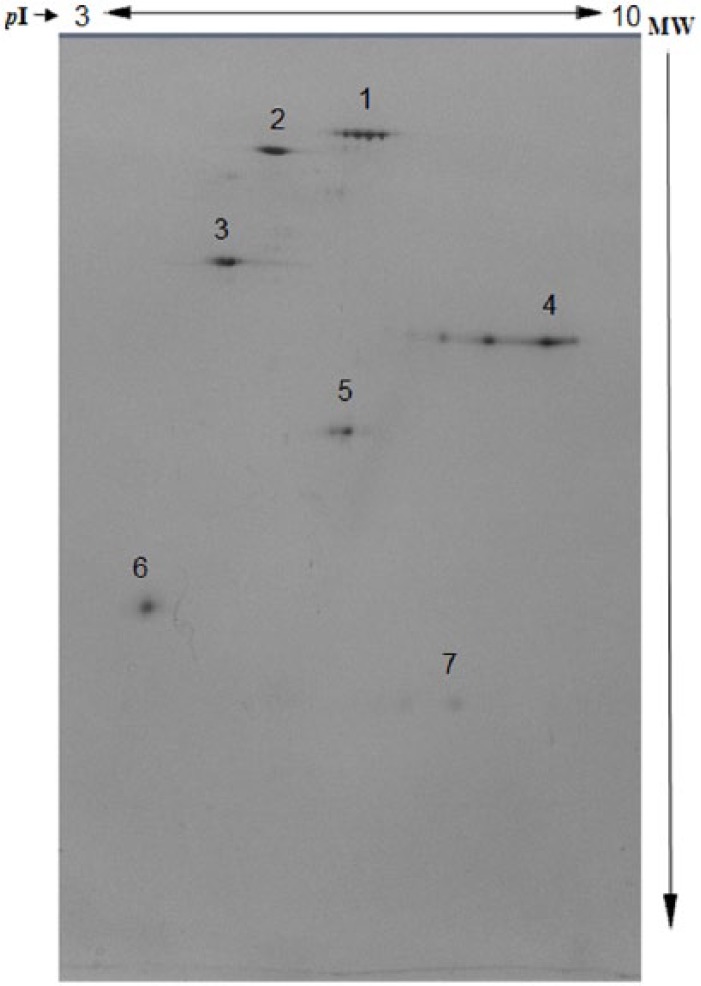
Representative image of 2-dimensional gel electrophoresis of marker proteins (Bio-Rad). 1: Hen egg white conalbumin type 1 (76 kDa; pI: 6.0, 6.3, 6.6); 2: bovine serum albumin (66.2 kDa; pI: 5.4, 5.6); 3: bovine muscle actin (43 kDa; pI: 5.0, 5.1); 4: rabbit muscle glyceraldehyde 3-phosphate dehydrogenase (36 kDa; pI: 8.3, 8.5); 5: bovine carbonic anhydrase (31 kDa; pI: 5.9, 6.0); 6: soybean trypsin inhibitor (21.5 kDa; pI: 4.5); and 7: equine myoglobin (17.5 kDa; pI: 7.0). The details are given in the “Materials and Methods” section.
Results and Discussion
The quality of the 2-DE analysis fundamentally depends on the proper solubilization of proteins of the sample followed by protein purification to remove interfering substances, IEF conditions, reduction and alkylation conditions of proteins, and storage condition of IPG strips after IEF. The following are the results of the experiments performed in line with these conditions.
Effect of buffer on solubilization and extraction of proteins
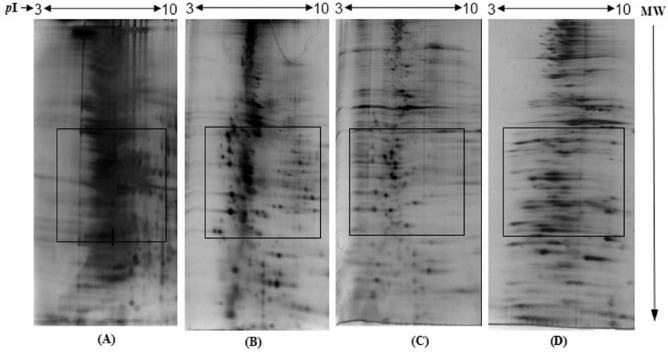
The erythrocyte membrane suspended in 5P8 buffer was initially solubilized in urea lysis buffer. To obtain the maximum solubilization and extraction of proteins, different experiments were conducted using different combinations of solubilization buffer and protein purification methods, namely, (a) urea lysis buffer without 2-DE cleanup kit, (b) urea lysis buffer with 2-DE cleanup kit, (c) urea/thiourea lysis buffer with 2-DE cleanup kit, and (d) urea/thiourea lysis buffer with ice-cold acetone. The buffer used for the solubilization and extraction of proteins influenced the quality and reproducibility of the 2-DE gel images. The results are shown in Figure 2. With urea lysis buffer without 2-DE cleanup kit (a), the protein separation was poor and the background was high (Figure 2A). This could be because of inadequate solubilization of hydrophobic membrane proteins, agglomeration of some proteins, and the presence of some interfering substances. This is in agreement with earlier reports which mentioned that urea lysis buffer is insufficient to solubilize hydrophobic proteins such as membrane proteins.12,15 With urea lysis buffer with 2-DE cleanup kit (b), the separation of proteins was enhanced and the background reduced effectively (Figure 2B). This may be due to elimination of interfering substances along with lipids. In another combination (c), urea/thiourea lysis buffer was used with the 2-DE cleanup kit. The combination of urea and thiourea is known to disrupt hydrogen bonding in proteins and remove unwanted agglomeration and reformation of secondary structure that affect protein movement.31 The CHAPS, a zwitterionic detergent, is used effectively to disrupt hydrophobic interactions which in turn results in increased solubility of proteins. In this study, the addition of thiourea (2 M) to urea lysis buffer and increased concentration of CHAPS (4% wt/vol) improved the solubilization of proteins, which resulted in higher resolution of protein spots and minimal streaking (Figure 2C). These findings further suggest that the solubilizing effect of urea-containing lysis buffer on protein can be dramatically increased by the addition of thiourea.32 In another combination (d), urea/thiourea was used with ice-cold acetone. The purpose to use this combination was to eliminate nonprotein molecules, such as lipids, salts, and nucleic acids, which are known to interfere during IEF and cause horizontal streaking on 2-DE gels. However, this combination again resulted in marked horizontal streaking (Figure 2D). Hence, the acetone method was not considered to be effective in comparison with 2-DE cleanup kit. The appearance of the marked horizontal streaking (Figure 2D) may be due to the presence of interfering substances, which could not be removed by acetone method. The optimized conditions were used for sample preparation for IEF.
Figure 2.
Effect of different solubilization and cleanup reagents on solubilization of human erythrocyte membrane proteins and their resolution by 2-dimensional gel electrophoresis (2-DE): (A) urea lysis buffer without 2-DE cleanup kit, (B) urea lysis buffer with 2-DE cleanup kit, (C) urea/thiourea lysis buffer with 2-DE cleanup kit, and (D) urea/thiourea lysis buffer with ice-cold acetone. IEF program: 50 V, 2 hours; 250 V, 1 hour; 500 V, 1 hour; 1000 V, 1 hour; 8000 V, 1 hour; 20 000 V h; maximum current limit: 50 µA/strip. The details are given in the “Materials and Methods” section.
Isoelectric focusing
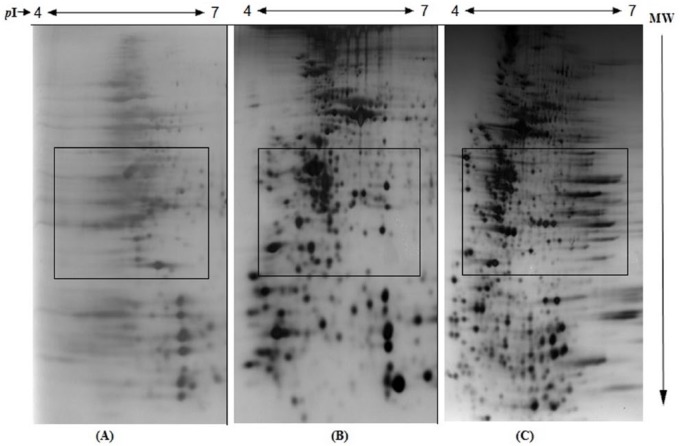
The steady-state IEF pattern is an essential step in achieving high-quality and reproducible 2-DE gel images. This was achieved by varying the volt hours for obtaining optimum focusing of proteins. In this study, we used different focusing time (V h) for IEF. The use of 20 000 V h resulted in incomplete focusing with marked horizontal streaking and poor resolution of spots, probably due to insufficient focusing time for most of the proteins to attain steady state during IEF (Figure 3A). The use of 30 000 V h resulted in reduced horizontal streaking and improved the resolution of the protein spots (Figure 3B). With 40 000 V h of IEF, moderate horizontal streaking was observed due to overfocusing of proteins (Figure 3C), although the spots appear sharper. Thus, the results of IEF at 30 000 V h showed proper focusing which could be considered as optimum resolution under these conditions. It is evident that insufficient focusing induced horizontal and vertical streaking, whereas overfocusing resulted in distorted protein patterns and loss of protein spots.
Figure 3.
Effect of varying volt hour (V h) on IEF on the resolution of human erythrocyte membrane proteins: (A) 20 000 V h, (B) 30 000 V h, and (C) 40 000 V h. The details are given in the “Materials and Methods” section.
Reduction and alkylation
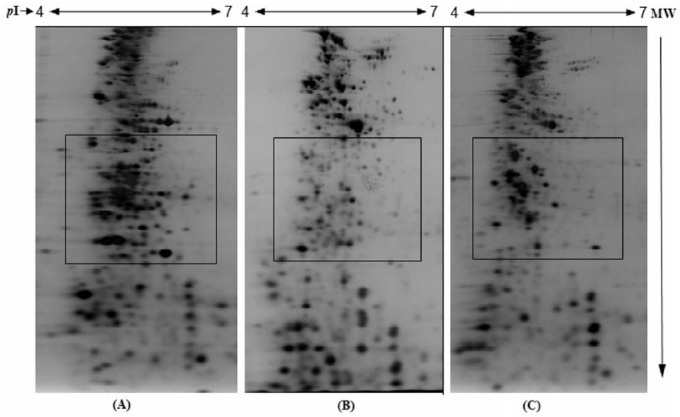
The reduction process is another important factor in protein detection by 2-DE analysis.12 Reducing agents cleave disulfide bond cross-links within and between protein subunits, thereby promoting protein unfolding and maintaining proteins in their fully reduced states. In this study, DTT, a strong reducing agent, was used. Dithiothreitol is known for breaking disulfide bonds and unfolding protein secondary and tertiary structures. Following reduction of the disulfide bonds by DTT, we used IAA to alkylate the free thiol groups of cysteine residues to prevent their reoxidation (back reaction) during electrophoresis. Our results show that lower period of reduction and alkylation caused aggregation of high-MW protein spots (Figure 4A), suggesting less unfolding of proteins due to less disulfide bond breakage. Prolonged equilibration of IPG strips prior to SDS-PAGE with DTT/IAA may result in the loss of low-MW proteins, as shown in Figure 4C. The results indicate that reduction and alkylation with DTT/IAA for 40 minutes yielded higher resolution and improved protein separation (Figure 4B).
Figure 4.
Effect of time of incubation on reduction and alkylation of proteins in immobilized pH gradient strips after isoelectric focusing: (A) 20 minutes, (B) 40 minutes, and (C) 60 minutes. Dithiothreitol (2%) and iodoacetamide (2.5%) were used as reducing and alkylating agents, respectively. The details are given in the “Materials and Methods” section.
Frozen versus nonfrozen IPG strip after IEF
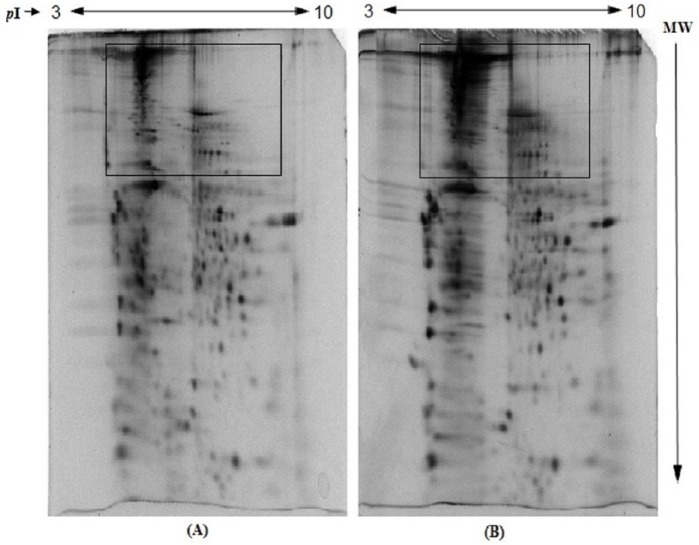
In this study, we have also assessed the effect of storage of IPG strips at −80°C for 24 hours or more after IEF. The findings show that the storage of IPG strips prior to SDS-PAGE resulted in relatively darker background in upper region and increased horizontal streaking (Figure 5A) compared with fresh IPG strips, suggesting that storage of IPG strips at −80°C prior to SDS-PAGE (after IEF) leads to lower resolution of proteins in 2-DE gels. These findings are comparable with the study on avian bursa of Fabricius by Wu et al.19 However, in another study, Wang et al33 reported improvement in resolution of 2-DE gels on longer storage of IPG strips at −20°C prior to SDS-PAGE.
Figure 5.
Effect of storage of immobilized pH gradient strips at −80°C prior to sodium dodecyl sulfate polyacrylamide gel electrophoresis on resolution of human erythrocyte membrane proteins: (A) without storage and (B) after storage at −80°C. The details are given in the “Materials and Methods” section.
Conclusions
The 2-DE analytical technique is generally applied in proteome analysis, identification of biomarkers, cancer research, cell differentiation, and so on. In this study, various conditions were applied during 2-DE to improve the resolution of erythrocyte membrane proteins. We observed that quality of 2-DE analysis primarily depends on the quality of protein sample preparation. Thiourea and increased concentration of zwitterionic detergent CHAPS resulted in improved solubilization of proteins. The solubilization of the membrane proteins in the samples and removal of interfering substances markedly increased the resolution and reproducibility of the 2-DE results. It also minimized the streaking and background noise. The 2-DE cleanup kit was significantly effective to remove interfering substances, whereas ice-cold acetone was completely ineffective to remove nonproteinaceous molecules such as lipids, salts, and nucleic acids, the presence of which may have interfered during IEF and caused horizontal streaking on 2-DE gels. An optimum amount of protein for rehydration prior to focusing was also required to minimize overlapping and aggregation of proteins. The reduction and alkylation of proteins embedded in the IPG strips resulted in appearance of low-MW proteins on 2-DE gels, improvement in the spot intensities, and reduction in the background noise.
In our experiments, best resolution of the erythrocyte membrane proteins was achieved when urea/thiourea lysis buffer (7 M urea, 2 M thiourea, 4% CHAPS, and 50 mM DTT) and 2-DE cleanup kit combination was used: 50 V, 2 hours, rapid gradient; 250 V, 1 hour, rapid gradient; 500 V, 1 hour, rapid gradient; 1000 V, 1 hour, rapid gradient; 8000 V, 1 hour, linear gradient and focusing at 30 000 V h were used for IEF, and 2% wt/vol DTT and 2.5% wt/vol IAA for 40 minutes each were used for reduction and alkylation.
Acknowledgments
The authors thankfully acknowledge the technical assistance provided by Mr Sanjay Goel, STA, in the department.
Footnotes
Peer Review:Four peer reviewers contributed to the peer review report. Reviewers’ reports totaled 745 words, excluding any confidential comments to the academic editor.
Funding:The author(s) disclosed receipt of the following financial support for the research, authorship, and/or publication of this article: Mr Manoj Kumar, Dr Rajendra Singh, and Mr Anil Meena are sincerely thankful to Department of Biotechnology—Government of India; University Grants Commission, New Delhi, India; and Indian Council of Medical Research, New Delhi, India, for providing financial assistance in the form of DBT-JRF, UGC-Dr DS Kothari PDF, and ICMR-JRF, respectively.
Declaration of Conflicting Interests:The author(s) declared no potential conflicts of interest with respect to the research, authorship, and/or publication of this article.
Author Contributions: MK, RS, RP, SKC, and SKB conceived and designed the experiments. MK and RS analyzed the data and wrote the first draft of the manuscript. AM and BSP contributed to the writing of the manuscript. RP, SKC, and SKB agree with manuscript results and conclusions. MK, RS, and SKB jointly developed the structure and argument for the paper. SKB made critical revisions and approved final version. All authors reviewed and approved the final manuscript.
References
- 1. O’Farrell PH. High resolution two-dimensional electrophoresis of proteins. J Biol Chem. 1975;250:4007–4021. [PMC free article] [PubMed] [Google Scholar]
- 2. Zukas AA, Breksa AP. Extraction methods for analysis of citrus leaf proteins by two-dimensional gel electrophoresis. J Chromatogr A. 2005;1078:201–205. [DOI] [PubMed] [Google Scholar]
- 3. Choe LH, Lee KH. A comparison of three commercially available isoelectric focusing units for proteome analysis: the multiphor, the IPGphor and the protean IEF cell. Electrophoresis. 2000;21: 993–1000. [DOI] [PubMed] [Google Scholar]
- 4. Aebersold R, Mann M. Mass spectrometry-based proteomics. Nature. 2003;422:198–207. [DOI] [PubMed] [Google Scholar]
- 5. Cutler P, Bell DJ, Birrell HC, et al. An integrated proteomic approach to studying glomerular nephrotoxicity. Electrophoresis. 1999;20:3647–3658. [DOI] [PubMed] [Google Scholar]
- 6. Fegatella F, Ostrowski M, Cavicchioli R. An assessment of protein profiles from the marine oligotrophic ultra microbacterium Sphingomonos sp. strain RB2256. Electrophoresis. 1999;20:2094–2098. [DOI] [PubMed] [Google Scholar]
- 7. Gorg A, Obemaier C, Boguth G, et al. The current state of two-dimensional electrophoresis with immobilized pH gradients. Electrophoresis. 2000;21:1037–1053. [DOI] [PubMed] [Google Scholar]
- 8. Magdeldin S, Enany S, Yoshida Y, et al. Basics and recent advances of two dimensional- polyacrylamide gel electrophoresis. Clin Proteomics. 2014;11:16. [DOI] [PMC free article] [PubMed] [Google Scholar]
- 9. Lopez JL. Two-dimensional electrophoresis in proteome expression analysis. J Chromatogr B Analyt Technol Biomed Life Sci. 2007;849:190–202. [DOI] [PubMed] [Google Scholar]
- 10. Xiao G, Zhang T. Functional Proteomics and Its Application in Biomedical Sciences, Current Topics in Human Genetics: Studies in Complex Diseases. Deng HW, Shen H, eds. Singapore: World Scientific; 2007. [Google Scholar]
- 11. Mesri M. Advances in proteomic technologies and its contribution to the field of cancer. Adv Med. 2014;2014:238045. [DOI] [PMC free article] [PubMed] [Google Scholar]
- 12. Liang X, Wang JR, Wong KWV, et al. Optimization of 2-dimensional gel electrophoresis for proteomic studies of solid tumor tissue samples. Mol Med Rep. 2013;9:626–632. [DOI] [PubMed] [Google Scholar]
- 13. Gallagher PG. Regulation of erythrocyte membrane protein gene expression. Curr Opin Hematol. 2003;10:115–122. [DOI] [PubMed] [Google Scholar]
- 14. Gupta P, Vijayan VK, Bansal SK. Changes in protein profile of erythrocyte membrane in bronchial asthma. J Asthma. 2012;49:129–133. [DOI] [PubMed] [Google Scholar]
- 15. Rabilloud T. Solubilization of proteins in 2-D electrophoresis. An outline. Methods Mol Biol. 1999;112:9–19. [DOI] [PubMed] [Google Scholar]
- 16. Macri J, McGee B, Thomas JN, et al. Cardiac sarcoplasmic reticulum and sarcolemmal proteins separated by two-dimensional electrophoresis: surfactant effects on membrane solubilization. Electrophoresis. 2000;21:1685–1693. [DOI] [PubMed] [Google Scholar]
- 17. Molloy MP. Two-dimensional electrophoresis of membrane proteins using immobilized pH gradients. Anal Biochem. 2000;280:1–10. [DOI] [PubMed] [Google Scholar]
- 18. Kannan S, Sujitha MV, Sundarraj S, Thirumurugan R. Two dimensional gel electrophoresis in cancer proteomics. In: Magdeldin S, ed. Gel Electrophoresis – Advanced Techniques; 2012. http://cdn.intechopen.com/pdfs/34927.pdf
- 19. Wu Y, Zhou J, Zhang X, et al. Optimized sample preparation for two-dimensional gel electrophoresis of soluble proteins from chicken bursa of Fabricius. Proteome Sci. 2009;7:38. [DOI] [PMC free article] [PubMed] [Google Scholar]
- 20. Luche S, Santoni V, Rabilloud T. Evaluation of nonionic and zwitterionic detergents as membrane protein solubilizers in two-dimensional electrophoresis. Proteomics. 2003;3:249–253. [DOI] [PubMed] [Google Scholar]
- 21. Churchward MA, Butt RH, Lang JC, Hsu KK, Coorssen JR. Enhanced detergent extraction for analysis of membrane proteomes by two-dimensional gel electrophoresis. Proteome Sci. 2005;3:5. [DOI] [PMC free article] [PubMed] [Google Scholar]
- 22. Rabilloud T. Membrane proteins and proteomics: love is possible, but so difficult. Electrophoresis. 2009;30:S174–S180. [DOI] [PubMed] [Google Scholar]
- 23. Lee DY, Chang GD. Electrolytic reduction: modification of proteins occurring in isoelectric focusing electrophoresis and in electrolytic reactions in the presence of high salts. Anal Chem. 2009;81:3957–3964. [DOI] [PMC free article] [PubMed] [Google Scholar]
- 24. Boyum A. Isolation of lymphocytes, granulocytes and macrophages. Scand J Immunol. 1976;5:9–15. [PubMed] [Google Scholar]
- 25. Hanahan DJ, Ekholm JE. The preparation of red cell ghosts (membranes). In: Colowick SP, Kaplan NO. eds. Methods in Enzymology. Vol 31 New York, NY: Academic Press; 1974:168–172. [DOI] [PubMed] [Google Scholar]
- 26. Lundback AK, Haneskog L, Anderson L, Heijbel A, Ingemarsson L, Birse D. Optimal solubilization screening strategies for GST-fusion membrane proteins. Life Sci News (Amersham Biosci). 2003;15:10–12. [Google Scholar]
- 27. Nandakumar MP, Shen J, Raman B, Marten MR. Solubilization of trichloroacetic acid (TCA) precipitated microbial proteins via NaOH for two-dimensional electrophoresis. J Proteome Res. 2003;2:89–93. [DOI] [PubMed] [Google Scholar]
- 28. Devraj K, Geguchadze R, Klinger M, Freeman W, Simpson I. Improved membrane protein solubilization and clean-up for optimum two-dimensional electrophoresis utilizing GLUT-1 as a classic integral membrane protein. J Neurosci Methods. 2009;184:119–123. [DOI] [PMC free article] [PubMed] [Google Scholar]
- 29. Blum H, Beier H, Gross HJ. Improved silver staining of plant proteins, RNA and DNA in polyacrylamide gels. Electrophoresis. 1987;8:93–99. [Google Scholar]
- 30. Chevallet M, Diemer H, Luche S, van Dorsselaer A, Rabilloud T, Leize-Wagner E. Improved mass spectrometry compatibility is afforded by ammoniacal silver staining. Proteomics. 2006;6:2350–2354. [DOI] [PMC free article] [PubMed] [Google Scholar]
- 31. Rabilloud T. Use of thiourea to increase the solubility of membrane proteins in two-dimensional electrophoresis. Electrophoresis. 1998;19:758–760. [DOI] [PubMed] [Google Scholar]
- 32. Rabilloud T, Adessi C, Giraudel A, Lunardi J. Improvement of the solubilization of proteins in two-dimensional electrophoresis with immobilized pH gradients. Electrophoresis. 1997;18:307–316. [DOI] [PMC free article] [PubMed] [Google Scholar]
- 33. Wang SB, Sommerfeld Q, Hu M, Chen F. An optimized protocol for isolation of soluble proteins from microalgae for two dimensional gel electrophoresis analysis. J Appl Phycol. 2003;15:485–496. [Google Scholar]


