

Applying machine learning of complex motion phenotypes obtained from cardiac MR images allows more accurate prediction of patient outcomes in pulmonary hypertension.
Abstract
Purpose
To determine if patient survival and mechanisms of right ventricular failure in pulmonary hypertension could be predicted by using supervised machine learning of three-dimensional patterns of systolic cardiac motion.
Materials and Methods
The study was approved by a research ethics committee, and participants gave written informed consent. Two hundred fifty-six patients (143 women; mean age ± standard deviation, 63 years ± 17) with newly diagnosed pulmonary hypertension underwent cardiac magnetic resonance (MR) imaging, right-sided heart catheterization, and 6-minute walk testing with a median follow-up of 4.0 years. Semiautomated segmentation of short-axis cine images was used to create a three-dimensional model of right ventricular motion. Supervised principal components analysis was used to identify patterns of systolic motion that were most strongly predictive of survival. Survival prediction was assessed by using difference in median survival time and area under the curve with time-dependent receiver operating characteristic analysis for 1-year survival.
Results
At the end of follow-up, 36% of patients (93 of 256) died, and one underwent lung transplantation. Poor outcome was predicted by a loss of effective contraction in the septum and free wall, coupled with reduced basal longitudinal motion. When added to conventional imaging and hemodynamic, functional, and clinical markers, three-dimensional cardiac motion improved survival prediction (area under the receiver operating characteristic curve, 0.73 vs 0.60, respectively; P < .001) and provided greater differentiation according to difference in median survival time between high- and low-risk groups (13.8 vs 10.7 years, respectively; P < .001).
Conclusion
A machine-learning survival model that uses three-dimensional cardiac motion predicts outcome independent of conventional risk factors in patients with newly diagnosed pulmonary hypertension.
Introduction
Pulmonary hypertension (PH) is a heterogeneous group of diseases defined by a resting mean pulmonary artery pressure of at least 25 mm Hg (1). PH may follow a rapidly progressive clinical course, with impaired exercise tolerance and dyspnea associated with right ventricular (RV) hypertrophy, right-sided heart dilatation, and, ultimately, cardiac failure (2). Outcome prediction in PH has been investigated extensively by using invasive hemodynamic data, serum biomarkers, exercise testing, and cardiac imaging. These markers consistently demonstrate that survival is related to functional adaptation of the right ventricle (3). RV ejection fraction is a measure of global systolic function that can be used to predict survival in patients with PH (4), although the complex shape and contraction pattern of the right ventricle make this an insensitive assessment method for early cardiac decompensation (5).
Patients investigated for PH routinely undergo cardiac magnetic resonance (MR) imaging, which provides an accurate assessment of cardiac functional status; however, realizing the full predictive potential of cardiac imaging requires methods capable of selecting the most relevant and meaningful prognostic features (6). Computational image analysis coupled with machine learning could enable discovery of the complex functional adaptations that can be used to predict eventual right-sided heart failure and death. Unlocking the full potential of diagnostic imaging in this way has become feasible with advances in computational modeling of the structure and function of the heart (7–9). The purpose of the present study was to determine if patient survival and mechanisms of RV failure in PH could be predicted by using supervised machine learning of three-dimensional (3D) patterns of systolic cardiac motion.
Materials and Methods
Study Population
This study was part of a continuous prospective research program into the prognosis of patients with PH by using conventional clinical and imaging biomarkers. The program had ethics committee approval, and all patients gave written informed consent. Our computational analysis was retrospectively performed on the data for the UK Digital Heart Project (http://digital-heart.org). Patients referred to the National Pulmonary Hypertension Service at the Imperial College Healthcare NHS Trust for routine diagnostic assessment and cardiac imaging between May 2004 and October 2013 were included in the study, with end of follow-up in September 2014. Criteria for inclusion included a documented diagnosis of PH by means of right-sided heart catheterization (RHC) with a resting mean pulmonary artery pressure of at least 25 mm Hg. Clinical classification was performed according to European guidelines (1), and patients with congenital shunts, arrhythmias that prevented cardiac gating, or more than 3 months between baseline investigations were excluded. All patients were treated with standard therapy in accordance with current guidelines and National Health Service England treatment policy (10).
RHC Procedure
RHC was performed by certified interventionists with a balloon-tipped, flow-directed Swan-Ganz catheter (Baxter Healthcare, Irvine, Calif) to derive cardiac output, cardiac index, mean pulmonary artery pressure, pulmonary capillary wedge pressure, and pulmonary vascular resistance. Six-minute walk distance was measured according to American Thoracic Society guidelines (11).
MR Imaging Protocol
Cardiac MR imaging was performed at a single site with a 1.5-T Achieva unit (Philips, Best, the Netherlands), and a standard clinical protocol was followed according to published international guidelines (12). Ventricular function was assessed by using balanced steady-state free-precession cine images acquired in conventional cardiac short- and long-axis planes with typical parameters: repetition time (msec)/echo time (msec), 3.2/1.6; voxel size, 1.5 × 1.5 × 8 mm; flip angle, 60°; sensitivity encoding factor, two; bandwidth, 962 Hz per pixel; and temporal resolution, 29 msec. Reproducibility was assessed in 20 subjects undergoing repeat studies on the same day. Images were stored in an open-source database (MRIdb; Imperial College London, London, England).
Quantification of RV Function
Volumetric analysis of cine images was performed by using a ViewForum (Philips), with one reader with 3 years of experience (T.J.W.D.) manually defining the RV endocardial borders at end-diastole and end-systole by using a standard published protocol (13). Reference to the position of the pulmonary and tricuspid valves on long-axis images was made to ensure correct placement of the contours. Papillary muscles and trabeculae were included in the RV volume.
Three-dimensional Assessment of Ventricular Physiology
Atlas-based approaches for segmenting the right ventricle enabled a 3D model of RV structure and function to be constructed (14). To ensure a fair comparison, manual volumetry and computational analysis were both performed with the same standard cardiac MR images.
All image processing was performed in Matlab (MathWorks, Natick, Mass). We used the short-axis cine images for each patient with PH and automatically aligned each set of end-diastolic and end-systolic images by minimizing the intensity differences between each section (15). The segmentation process was then initialized by a reader (T.J.W.D.) who placed six predefined anatomic landmarks on the target images (left ventricular apex, mitral annulus, and lateral wall; the RV free wall; and the superior and inferior RV insertion points [Fig E1 {online}]). These landmarks were also defined on each labeled atlas. Manually annotated cardiac atlases at end-diastole and end-systole were derived from 47 patients with PH and were included in the Digital Heart Project population data set for analysis of both shape and motion (16). Each voxel in the PH atlases was manually labeled as either cavity or myocardium in the left and right ventricles by using freely available software (ITKsnap, National Library of Medicine Insight Segmentation and Registration Toolkit; http://www.itksnap.org/). With a multiatlas approach, the entire data set of labeled atlases was used, rather than relying on a model-based average representation (17). An approximate graph search was performed to find correspondences between small cubic regions, or patches, on the image to be segmented and the database of labeled atlases. Spectral embedding by using a multilayered graph of the images was used to capture global shape properties. Finally, we estimated anatomic patch correspondences on the basis of a joint spectral representation of the image and atlases (14,18). The final segmentations were coregistered to an average template surface mesh, where vertex density was determined by curvature at each sampling point, allowing cardiac shape or function within the population to be compared in a common space (freely available at https://github.com/UK-Digital-Heart-Project).
Three-dimensional motion reconstruction was performed by using temporal sparse free-form registration to estimate cardiac motion between the two time points at end-diastole and end-systole (Fig 1) (19). For each endocardial vertex in the right ventricle (approximately 30 000 data points), we calculated the direction and magnitude of systolic excursion—that is, the maximal displacement from the initial position in end-diastole. Each vector was then resolved into three perpendicular components (longitudinal, circumferential, and radial) relative to a long axis defined between the tricuspid orifice and RV apex. The resulting coregistered 3D data set represented the systolic motion of the endocardial surface of the right ventricle and septum in the PH cohort. Patterns of 3D motion associated with survival were then assessed with supervised principal components analysis. Accuracy was assessed by comparing manual and semiautomated segmentations by using leave-one-out cross-validation, and repeatability was evaluated by measuring the agreement between the two studies.
Figure 1:

Example of computational modeling for a patient with idiopathic pulmonary arterial hypertension. A, Cine MR images were segmented by using prior knowledge from a set of disease-specific atlases. Here, the intensity image in the short-axis of the heart is overlaid with labels for left ventricular blood pool (red), myocardium (green), RV blood pool (yellow), and free wall (blue). B, A 3D model at end-diastole (gray) and end-systole (blue, right ventricle; and red, left ventricle) was used to determine the direction and magnitude of systolic excursion at each corresponding anatomic point in the mesh by using a deformable motion model. C, A statistical model of RV endocardial motion was used for feature selection to determine functional patterns associated with survival (relative weightings shown for the RV free wall).
Statistical Analysis
Data were analyzed in R (R Foundation, Vienna, Austria) by using RStudio Server version 0.98 (Boston, Mass). Categorical variables were expressed as percentages. Continuous variables were expressed as means ± standard deviations or medians ± interquartile ranges for nonnormal variables. Baseline anthropometric data were compared by using unpaired t tests and Mann-Whitney U tests pending normality (continuous variables), as well as Fisher exact (nominal variables) and Cochran-Armitage (ordinal variables) tests. Intergroup age differences were controlled for by means of linear regression.
Standard principal components analysis is commonly used to summarize data into components that account for most of the variance in the observed data, but these components may not relate to markers of interest, such as outcome or survival. Supervised principal components analysis is a supervised learning approach that is effective for regression and classification problems by using complex input data (20).
The performance of each marker was tested as a predictor of survival in the whole data set, and significant univariate predictors (P < .05) were carried forward to three nested models designed to test the incremental benefit of groups of predictors. Model 1 included the clinical, hemodynamic, and functional predictors found to be significant in univariate prediction. Model 2 additionally included markers of MR volumetry (RV ejection fraction, indexed RV end-systolic volume, indexed RV end-diastolic volume, and stroke volume divided by RV end-systolic volume). Model 3 included the predictors in both models 1 and 2, as well as 3D motion. Models were optimized in the training data and then assessed in the unseen validation data by using eightfold cross-validation (Fig 2) (21). In each fold, 224 cases provided the training data for a predictive model, which was then evaluated on the held-out set of 32 cases until every patient had been in a validation set exactly once. Supervised principal components analysis proceeded as follows: (a) A Cox proportional-hazards model was fit for each predictor, (b) feature selection was performed by selecting predictors with coefficients that exceeded an absolute threshold (established by means of cross-validation of the log-likelihood ratios), and (c) the first principal component of the reduced data matrix was used as a prognostic marker. The value of this principal component in unseen subjects was used to predict whether subjects would be alive or dead at censoring and to fit a Cox proportional-hazards model for subject survival from which model fit was measured.
Figure 2:

Flow diagram for recruitment and analysis of patients with PH. Cardiac MR images were segmented and analyzed in 256 eligible patients. In the training phase, supervised machine learning was used to discover patterns of RV function associated with outcome. Predictive performance of multivariable risk models was assessed by using eightfold cross-validation to demonstrate the incremental value of computational phenotyping. CMR = cardiovascular MR.
Survival was recorded as the time between enrollment and death from any cause. Survival prediction for the Cox proportional-hazards model was assessed by using the hazard ratio, the R2 value for each model, and the area under the curve by using time-dependent receiver operating characteristic (ROC) analysis for 1-year survival (22). The model was bootstrapped (1000 bootstraps) to estimate performance metrics, which were then compared by means of analysis of variance with post hoc Tukey testing. Model performance was compared with the null hypothesis by means of permutation testing (1000 permutations), with a P value less than .05 considered to indicate a significant difference.
This study was conducted according to the Transparent Reporting of a Multivariable Prediction Model for Individual Prognosis or Diagnosis, or TRIPOD, guidelines.
Results
Study Population Characteristics
In total, 405 consecutive patients referred for investigation to Imperial College Healthcare NHS Trust were evaluated for eligibility, and 256 subjects with confirmed PH were enrolled. Of these, 36% (93 of 256) died, and one underwent lung transplantation during follow-up, which was a median length of 4.0 years (interquartile range, 2.0–5.7 years). In the cohort, 6% of patients (16 of 256) were unable to take the 6-minute walk distance test. Median patient age was 67 years (range, 52–75 years), and 143 patients (56%) were women (anthropometric, hemodynamic, and cardiac MR data are presented in Table E1 [online]). Additional data were stratified according to PH subgroup and are presented in Tables E2–E4 (online).
Accuracy and Reproducibility of Segmentation and Motion Tracking
Mean Hausdorff distance ± standard deviation between corresponding semiautomated and manual segmentations of the right ventricle was 3.0 mm ± 1.2. Computational analysis showed good interstudy agreement according to the intraclass correlation coefficient in determining the longitudinal, radial, and circumferential positions of corresponding points in each orthogonal coordinate (intraclass correlation coefficients of 0.98, 0.98, and 0.91, respectively; all P < .001) and for assessment of cardiac motion (intraclass correlation coefficients of 0.90, 0.81, and 0.82, respectively; all P < .001). A 3D representation of the spatial errors in segmentation is given in Figure E2 (online).
Survival Prediction
Univariate Cox regression analyses indicated that age, sex, and race (“clinical markers”), mean right atrial pressure and RV end-diastolic pressure (“hemodynamic markers”), functional class and 6-minute walk distance (“functional markers”), and all baseline cardiac MR measurements (“volumetric markers”) were significantly associated with survival (Table E1 [online]). Univariate standardized hazard ratios for each predictor and Kaplan-Meier estimates of survival used to compare RV ejection fraction to 3D motion analysis are shown in Figure 3.
Figure 3a:

A comparison of survival prediction for each parameter is shown. (a) Standardized hazard ratios (HRs) (for a 1.96 standard deviation difference) with 95% confidence intervals (CIs) are shown for 3D motion and conventional prognostic markers. (b) Kaplan-Meier curves and numbers at risk for the survival of patients with PH were used to compare risk stratification according to 3D motion versus RV ejection fraction (RVEF). mPAP = mean pulmonary artery pressure, mRAP = mean right atrial pressure, PVR = pulmonary vascular resistance, RAP = right atrial pressure, RVEDP = RV end-diastolic pressure, RVEDVI = indexed RV end-diastolic volume, RVESVI = indexed RV end-systolic volume, SV/ESV = stroke volume divided by end-systolic volume, 6MWD = 6-minute walk distance.
Figure 3b:

A comparison of survival prediction for each parameter is shown. (a) Standardized hazard ratios (HRs) (for a 1.96 standard deviation difference) with 95% confidence intervals (CIs) are shown for 3D motion and conventional prognostic markers. (b) Kaplan-Meier curves and numbers at risk for the survival of patients with PH were used to compare risk stratification according to 3D motion versus RV ejection fraction (RVEF). mPAP = mean pulmonary artery pressure, mRAP = mean right atrial pressure, PVR = pulmonary vascular resistance, RAP = right atrial pressure, RVEDP = RV end-diastolic pressure, RVEDVI = indexed RV end-diastolic volume, RVESVI = indexed RV end-systolic volume, SV/ESV = stroke volume divided by end-systolic volume, 6MWD = 6-minute walk distance.
Feature extraction and supervised learning from the data are shown in Figure 4. All three nested prediction models were significant when compared with the null hypothesis (all P < .001), and there was a significant difference between the predictive power of the models (analysis of variance hazard ratio, F = 80.2 [P < .001]; area under the ROC curve, F = 94.2 [P < .001]; R2 analysis, F = 40.7 [P < .001]). Model 3, which included 3D motion, had a significantly higher hazard ratio, area under the ROC curve, and R2 value, and a greater difference in median survival time (all P < .001) (Table). Five-year survival from time of diagnosis according to quartiles of risk predicted with model 3 is shown in Figure 5.
Figure 4:

Illustration of how features of RV motion are automatically selected for prognostic importance in patients with PH. A, Plot represents how the magnitude of systolic excursion in the right ventricle, derived from atlas-based cardiac segmentations, varies between survivors and nonsurvivors from the basal level to the apical level. B, Plot shows where supervised machine learning identifies features within these motion-based data that most accurately allow discrimination between low-risk and high-risk patients. The full model used for survival prediction took into account the prognostic importance of motion throughout a 3D representation of the right ventricle, resolved into orthogonal components.
Survival Prediction in the Validation Cases
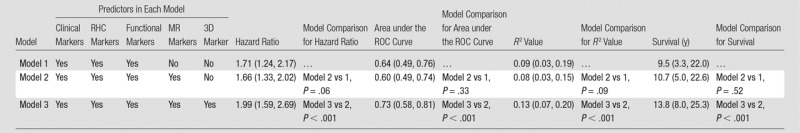
Note.—Numbers in parentheses are 95% confidence intervals. Clinical markers were age, sex, race, and PH subtype; RHC hemodynamic markers were right atrial pressure and RV end-diastolic pressure. Functional markers were New York Heart Association functional class and 6-minute walk distance. MR markers were RV end-diastolic volume index, RV end-systolic volume index, RV ejection fraction, and stroke volume divided by RV end-systolic volume. The 3D marker was 3D motion. Area under the ROC curve indicates the performance of each marker in 1-year survival prediction. In subgroups with more than 50% survival at censoring, median survival values were extrapolated. All models were significantly better predictors than the null hypothesis (P < .001).
Figure 5:

Graph shows observed 5-year survival from the time of diagnosis according to predicted risk strata obtained by using model 3, as described in the Table.
Functional Contributions to Survival and Ventricular Function
Systolic function throughout most of the right ventricle and septum was influential in patient survival (Fig 6). Reduced longitudinal excursion throughout the basal and midventricular regions was associated with poor outcome. A decrease in radial contraction in the septum and free wall also had prognostic significance. Mortality was also predicted by a global increase in circumferential function. Machine-learning analysis from the motion data sets enabled prediction of survival in all three PH subgroups (all P < .001), and the variation in cardiac function between groups is shown in Figure E3 (online).
Figure 6:

A 3D model of the right ventricle shows the regional contributions to survival prediction in 256 patients with PH. The models show where reduced (red) or increased (blue) systolic motion is associated with death. This is shown by, A, the magnitude of excursion, as well as, B–D, each directional component. The right ventricle is shown in the anterior and septal views, with the left ventricle depicted as a mesh. A reduction in both longitudinal basal motion and transverse bellows contraction is associated with death, as is an increase in circumferential contraction.
Discussion
Semiautomated analysis of cine cardiac MR images in patients with PH is feasible, accurate, and reproducible. Supervised machine learning of the patterns of cardiac motion indicates that survival in patients with PH is predicted by a loss of effective contractile motion in anatomically distinct but functionally synergistic regions of the right ventricle. A machine-learning survival model that includes cardiac motion has incremental prognostic power when compared with conventional parameters.
Computational modeling provides a platform for improving our understanding of the heart, and the integration of experimental and clinical data is now bringing computational models closer to use in routine clinical practice (23). Advances in both cardiac imaging and analytic models offer a wealth of biological data that contribute to the search for novel biomarkers of cardiac dysfunction. Multimodal techniques can now offer biventricular electromechanical modeling, fluid-solid mechanical models, and luminal flow streamlines coupled with myocardial displacement (24,25). Atlas-based analysis in the heart has been applied to describing shape variation among asymptomatic adults, identifying persisting effects of preterm delivery on ventricular geometry, and demonstrating patterns of remodeling after myocardial infarction (9,26,27). The potential for this technique lies not just in shape analysis but as a means to understand how the integrated function of the heart contributes to survival in large clinical cohorts as the data from each subject are coregistered. While other approaches to cardiac segmentation are more widely available, atlas-based methods maintain the anatomic correspondence of the 3D mesh between patients. Machine learning, both supervised and unsupervised, can be applied to clinical data sets for the purpose of developing robust risk models and redefining patient classes (28). In this study, we used a complex 3D model of cardiac displacement and applied a machine-learning algorithm to identify recurring patterns within this high-dimensional data set that enabled prediction of outcomes most strongly. From standard diagnostic imaging, a mathematical model of the relationship of cardiac function to survival can be generated.
Conventional cardiac MR studies in PH have shown that deteriorating RV function is associated with poor outcome, despite therapeutic reductions in pulmonary vascular resistance (4). Imaging can be used to assess RV systolic function in several ways, typically by means of global measures of pump function or regional systolic excursion (29). Our models indicate that survival is linked to a combined failure of basal longitudinal shortening and transverse contraction of the septum and free wall. The importance of these individual components of motion to pump function has been proposed previously in physiological studies (30), and here we demonstrate the combined influence on outcome. The modeling also demonstrates the risk associated with adaptations of circumferential function, which tends to increase in PH as global failure develops (31). Raised afterload and RV dilatation are associated with fiber reorientation toward the circumferential direction (32), and our data indicate that such adverse structural remodeling independently contributes to survival. The predictive performance of machine learning is independent of PH subtype, but the models identify some prognostic variations in RV geometry and function that may reflect differing responses to altered loading conditions. These integrative models of right-sided heart physiology show that cardiac decompensation is not simply a global decline in function but instead results from a loss of effective contractile motion in anatomically distinct but functionally synergistic regions.
Innovation in biomarker discovery and personalized medicine requires a cultural change in how clinical data are exploited (6). Here we have demonstrated how it is possible to maximize the potential of existing imaging resources for outcome prediction by using computational models that require minimal human intervention. As well as performing accurate risk classification of individual patients, the models also inform clinicians about the functional mechanisms that underlie RV failure. The potential for such computational simulations lies not only in risk stratification but also in designing trials for new therapies that have a direct effect on RV contractility. Future work will be directed at improving the depth of phenotyping by using time-resolved segmentations throughout the cardiac cycle to model 3D strain tensors, evaluating machine-learning predictions in an independent validation cohort benchmarked against conventional multivariate risk models, and exploring the potential of deep learning architectures for hierarchical feature recognition (33,34).
Our study has limitations. The pragmatic study design, which included all noncongenital cases of PH and all treatment regimens, may limit applicability in selective groups but demonstrates that the methods are effective across a spectrum of disease and treatments. We classified our patients according to international guidelines, but it is recognized that patients with PH have multifactorial disease with overlap between categories. Study end point and censoring were confined to all-cause mortality to avoid bias in the classification of cause of death, though the performance of markers will also be affected by variations in therapy and those selected for surgery. The accuracy of our segmentation technique compares well to that in previously published results (14); however, the uncertainty in both end-diastolic and end-systolic segmentation will propagate to the uncertainty in displacement estimation. Our models are also currently limited to measuring excursion rather than contractility, and deriving strain tensors may add additional prognostic data (34). Human intervention is limited to landmark placement, but newer techniques offer a means to also automate this step (35). We considered only the first supervised principal component of the 3D functional model, as this explains the most variance in data as is possible and allows a fair comparison with other single-parameter predictors. The cumulative variance of subsequent components may further improve prediction, although later components are increasingly influenced by noise. Contemporaneous echocardiography and cardiopulmonary exercise testing were not available for each case. Tricuspid annular-plane systolic excursion offers a prognostic indicator that is simple to measure, and although we confirm the importance of basal longitudinal excursion to survival, the models show that regional contraction in the circumferential and radial directions also contribute to prognosis.
In conclusion, applying machine learning of complex motion phenotypes obtained from cardiac MR imaging allows more accurate prediction of patient outcomes in PH.
Advances in Knowledge
■ A disease-specific cardiac atlas can be used to create accurate (Hausdorff distance, 3.0 mm ± 1.2) and reproducible (intraclass correlation coefficients for agreement of position in each axis, 0.98, 0.98, and 0.91; all P < .001) segmentations of the heart in pulmonary hypertension (PH) from conventional cardiac MR images.
■ A supervised machine-learning survival model that includes three-dimensional cardiac motion provides incremental prognostic benefit when compared with conventional imaging and hemodynamic, functional, and clinical markers (area under the receiver operating characteristic curve, 0.73 vs 0.60, respectively [P < .001]; difference in median survival time between high- and low-risk groups, 13.8 vs 10.7 years, respectively [P < .001]).
Implications for Patient Care
■ Computational analysis of right ventricular motion in PH can be used for risk stratification and demonstrates early prognostic signs of dysfunction.
■ Machine learning by using cardiac MR imaging should be evaluated as a tool to guide patient management.
APPENDIX
SUPPLEMENTAL FIGURES
Acknowledgments
Acknowledgments
The authors thank our radiographers Giuliana Durighel, MSc, Marina Quinlan, MSc, and Catherine Holden, BSc, and our research nurses Tamara Diamond, RN, BSc, and Laura Monje-Garcia, RN, MSc. We also acknowledge the staff of the National Institute for Health Research and Wellcome Trust Imperial Clinical Research Facility, Hammersmith Hospital (London, England), and George Villa for the TRIPHIC (Translational Research in Pulmonary Hypertension at Imperial College) database.
Received June 9, 2016; revision requested August 18; revision received October 11; accepted October 23; final version accepted October 25.
Study supported by the Wellcome Trust (100211/Z/12/Z), the British Heart Foundation (PG/12/27/29489, SP/10/10/28431), the Medical Research Council, and the National Institute for Health Research.
Abbreviations:
- PH
- pulmonary hypertension
- RHC
- right-sided heart catheterization
- ROC
- receiver operating characteristic
- RV
- right ventricular
- 3D
- three-dimensional
Disclosures of Conflicts of Interest: T.J.W.D. disclosed no relevant relationships. A.d.M. disclosed no relevant relationships. W.S. disclosed no relevant relationships. T.F. disclosed no relevant relationships. G.M.J.W. disclosed no relevant relationships. J.W. disclosed no relevant relationships. C.J.R. disclosed no relevant relationships. L.S.G.E.H. disclosed no relevant relationships. J.S.R.G. Activities related to the present article: author received grants and personal fees from Actelion, Bayer, and GSK; author received personal fees from Gilead, Pfizer, AOP Orphan, and Novartis; author received grants from United Therapeutics and Amco. Activities not related to the present article: disclosed no relevant relationships. Other relationships: disclosed no relevant relationships. D.R. Activities related to the present article: author received grants from EPSRC. Activities not related to the present article: disclosed no relevant relationships. Other relationships: disclosed no relevant relationships. S.A.C. disclosed no relevant relationships. M.R.W. disclosed no relevant relationships. D.P.O. disclosed no relevant relationships.
References
- 1.Galiè N, Humbert M, Vachiery JL, et al. 2015 ESC/ERS guidelines for the diagnosis and treatment of pulmonary hypertension: The Joint Task Force for the Diagnosis and Treatment of Pulmonary Hypertension of the European Society of Cardiology (ESC) and the European Respiratory Society (ERS). Endorsed by: Association for European Paediatric and Congenital Cardiology (AEPC), International Society for Heart and Lung Transplantation (ISHLT). Eur Respir J 2015;46(4):903–975. [DOI] [PubMed] [Google Scholar]
- 2.Benza RL, Miller DP, Gomberg-Maitland M, et al. Predicting survival in pulmonary arterial hypertension: insights from the Registry to Evaluate Early and Long-Term Pulmonary Arterial Hypertension Disease Management (REVEAL). Circulation 2010;122(2):164–172. [DOI] [PubMed] [Google Scholar]
- 3.Vonk-Noordegraaf A, Haddad F, Chin KM, et al. Right heart adaptation to pulmonary arterial hypertension: physiology and pathobiology. J Am Coll Cardiol 2013;62(25 Suppl):D22–D33. [DOI] [PubMed] [Google Scholar]
- 4.van de Veerdonk MC, Kind T, Marcus JT, et al. Progressive right ventricular dysfunction in patients with pulmonary arterial hypertension responding to therapy. J Am Coll Cardiol 2011;58(24):2511–2519. [DOI] [PubMed] [Google Scholar]
- 5.Naeije R, Ghio S. More on the right ventricle in pulmonary hypertension. Eur Respir J 2015;45(1):33–35. [DOI] [PubMed] [Google Scholar]
- 6.Scruggs SB, Watson K, Su AI, et al. Harnessing the heart of big data. Circ Res 2015;116(7):1115–1119. [DOI] [PMC free article] [PubMed] [Google Scholar]
- 7.Fonseca CG, Backhaus M, Bluemke DA, et al. The Cardiac Atlas Project—an imaging database for computational modeling and statistical atlases of the heart. Bioinformatics 2011;27(16):2288–2295. [DOI] [PMC free article] [PubMed] [Google Scholar]
- 8.de Marvao A, Dawes TJ, Shi W, et al. Population-based studies of myocardial hypertrophy: high resolution cardiovascular magnetic resonance atlases improve statistical power. J Cardiovasc Magn Reson 2014;16:16. [DOI] [PMC free article] [PubMed] [Google Scholar]
- 9.Medrano-Gracia P, Cowan BR, Ambale-Venkatesh B, et al. Left ventricular shape variation in asymptomatic populations: the Multi-Ethnic Study of Atherosclerosis. J Cardiovasc Magn Reson 2014;16:56. [DOI] [PMC free article] [PubMed] [Google Scholar]
- 10.NHS England . Clinical Commissioning Policy: National Policy for Targeted Therapies for the Treatment of Pulmonary Hypertension in Adults. London, England: NHS England, 2014. [Google Scholar]
- 11.ATS Committee on Proficiency Standards for Clinical Pulmonary Function Laboratories . ATS statement: guidelines for the six-minute walk test. Am J Respir Crit Care Med 2002;166(1):111–117. [DOI] [PubMed] [Google Scholar]
- 12.Kramer CM, Barkhausen J, Flamm SD, Kim RJ, Nagel E; Society for Cardiovascular Magnetic Resonance Board of Trustees Task Force on Standardized Protocols. Standardized cardiovascular magnetic resonance (CMR) protocols 2013 update. J Cardiovasc Magn Reson 2013;15:91. [DOI] [PMC free article] [PubMed] [Google Scholar]
- 13.Schulz-Menger J, Bluemke DA, Bremerich J, et al. Standardized image interpretation and post processing in cardiovascular magnetic resonance: Society for Cardiovascular Magnetic Resonance (SCMR) board of trustees task force on standardized post processing. J Cardiovasc Magn Reson 2013;15:35. [DOI] [PMC free article] [PubMed] [Google Scholar]
- 14.Petitjean C, Zuluaga MA, Bai W, et al. Right ventricle segmentation from cardiac MRI: a collation study. Med Image Anal 2015;19(1):187–202. [DOI] [PubMed] [Google Scholar]
- 15.Hill DL, Batchelor PG, Holden M, Hawkes DJ. Medical image registration. Phys Med Biol 2001;46(3):R1–R45. [DOI] [PubMed] [Google Scholar]
- 16.Bai W, Shi W, de Marvao A, et al. A bi-ventricular cardiac atlas built from 1000+ high resolution MR images of healthy subjects and an analysis of shape and motion. Med Image Anal 2015;26(1):133–145. [DOI] [PubMed] [Google Scholar]
- 17.Aljabar P, Heckemann RA, Hammers A, Hajnal JV, Rueckert D. Multi-atlas based segmentation of brain images: atlas selection and its effect on accuracy. Neuroimage 2009;46(3):726–738. [DOI] [PubMed] [Google Scholar]
- 18.Shi W, Lombaert H, Bai W, et al. Multi-atlas spectral PatchMatch: application to cardiac image segmentation. Med Image Comput Comput Assist Interv 2014;17(Pt 1):348–355. [DOI] [PubMed] [Google Scholar]
- 19.Wang H, Shi W, Zhuang X, et al. Automatic Cardiac Motion Tracking Using Both Untagged and 3D Tagged MR Images. In: Camara O, Konukoglu E, Pop M, Rhode K, Sermesant M, Young A, eds. Statistical Atlases and Computational Models of the Heart Imaging and Modelling Challenges: Second International Workshop, STACOM 2011, held in conjunction with MICCAI 2011, Toronto, ON, Canada, September 22, 2011, revised selected papers. Berlin, Germany: Springer, 2012; 45–54. [Google Scholar]
- 20.Bair E, Tibshirani R. Semi-supervised methods to predict patient survival from gene expression data. PLoS Biol 2004;2(4):E108. [DOI] [PMC free article] [PubMed] [Google Scholar]
- 21.Simon RM, Subramanian J, Li MC, Menezes S. Using cross-validation to evaluate predictive accuracy of survival risk classifiers based on high-dimensional data. Brief Bioinform 2011;12(3):203–214. [DOI] [PMC free article] [PubMed] [Google Scholar]
- 22.Heagerty PJ, Lumley T, Pepe MS. Time-dependent ROC curves for censored survival data and a diagnostic marker. Biometrics 2000;56(2):337–344. [DOI] [PubMed] [Google Scholar]
- 23.Chabiniok R, Wang VY, Hadjicharalambous M, et al. Multiphysics and multiscale modelling, data-model fusion and integration of organ physiology in the clinic: ventricular cardiac mechanics. Interface Focus 2016;6(2):20150083. [DOI] [PMC free article] [PubMed] [Google Scholar]
- 24.Sermesant M, Chabiniok R, Chinchapatnam P, et al. Patient-specific electromechanical models of the heart for the prediction of pacing acute effects in CRT: a preliminary clinical validation. Med Image Anal 2012;16(1):201–215. [DOI] [PubMed] [Google Scholar]
- 25.McCormick M, Nordsletten DA, Kay D, Smith NP. Simulating left ventricular fluid–solid mechanics through the cardiac cycle under LVAD support. J Comput Phys 2013;244:80–96. [Google Scholar]
- 26.Lewandowski AJ, Augustine D, Lamata P, et al. Preterm heart in adult life: cardiovascular magnetic resonance reveals distinct differences in left ventricular mass, geometry, and function. Circulation 2013;127(2):197–206. [DOI] [PubMed] [Google Scholar]
- 27.Zhang X, Cowan BR, Bluemke DA, et al. Atlas-based quantification of cardiac remodeling due to myocardial infarction. PLoS One 2014;9(10):e110243. [DOI] [PMC free article] [PubMed] [Google Scholar]
- 28.Deo RC. Machine learning in medicine. Circulation 2015;132(20):1920–1930. [DOI] [PMC free article] [PubMed] [Google Scholar]
- 29.Forfia PR, Fisher MR, Mathai SC, et al. Tricuspid annular displacement predicts survival in pulmonary hypertension. Am J Respir Crit Care Med 2006;174(9):1034–1041. [DOI] [PubMed] [Google Scholar]
- 30.Kind T, Mauritz GJ, Marcus JT, van de Veerdonk M, Westerhof N, Vonk-Noordegraaf A. Right ventricular ejection fraction is better reflected by transverse rather than longitudinal wall motion in pulmonary hypertension. J Cardiovasc Magn Reson 2010;12:35. [DOI] [PMC free article] [PubMed] [Google Scholar]
- 31.Buckberg G, Mahajan A, Saleh S, Hoffman JI, Coghlan C. Structure and function relationships of the helical ventricular myocardial band. J Thorac Cardiovasc Surg 2008;136(3):578–589, 589.e1–589.e11. [DOI] [PubMed] [Google Scholar]
- 32.Pettersen E, Helle-Valle T, Edvardsen T, et al. Contraction pattern of the systemic right ventricle shift from longitudinal to circumferential shortening and absent global ventricular torsion. J Am Coll Cardiol 2007;49(25):2450–2456. [DOI] [PubMed] [Google Scholar]
- 33.LeCun Y, Bengio Y, Hinton G. Deep learning. Nature 2015;521(7553):436–444. [DOI] [PubMed] [Google Scholar]
- 34.Auger DA, Zhong X, Epstein FH, Spottiswoode BS. Mapping right ventricular myocardial mechanics using 3D cine DENSE cardiovascular magnetic resonance. J Cardiovasc Magn Reson 2012;14:4. [DOI] [PMC free article] [PubMed] [Google Scholar]
- 35.Oktay O, Bai W, Guerrero R, et al. Stratified decision forests for accurate anatomical landmark localization. IEEE Trans Med Imaging 2016. [Epub ahead of print] [DOI] [PubMed] [Google Scholar]
Associated Data
This section collects any data citations, data availability statements, or supplementary materials included in this article.