Abstract
Purpose
Metabolic syndrome (MetS) is associated with several degenerative diseases, including retinal degeneration. Previously, we reported on progressive retinal degeneration in a spontaneous obese rat (WNIN/Ob) model. In this study, we investigated the additional effect of impaired glucose tolerance (IGT), an essential component of MetS, on retinal degeneration using the WNIN/GR-Ob rat model.
Methods
The retinal morphology and ultrastructure of WNIN/GR-Ob and age-matched littermate lean rats were studied by microscopy and immunohistochemistry. The retinal transcriptome of WNIN/GR-Ob was compared with the respective lean controls and with the WNIN/Ob model using microarray analysis. Expression of selected retinal marker genes was studied via real-time PCR.
Results
Progressive loss of photoreceptor cells was observed in WNIN/GR-Ob rats with an onset as early as 3 months. Similarly, thinning of the inner nuclear layer was observed from 6 months in these rats. Immunohistochemical analysis showed decreased levels of rhodopsin and postsynaptic density protein-95 (PSD-95) proteins and increased levels of glial fibrillary acidic protein (GFAP), vascular endothelial growth factor (VEGF), and calretinin in WNIN/GR-Ob rats compared with the age-matched lean controls, further supporting cellular stress/damage and retinal degeneration. The retinal transcriptome analysis indicated altered expression profiles in both the WNIN/GR-Ob and WNIN/Ob rat models compared to their respective lean controls; these pathways are associated with activation of pathways like cellular oxidative stress response, inflammation, apoptosis, and phototransduction, although the changes were more prominent in WNIN/GR-Ob than in WNIN/Ob animals.
Conclusions
WNIN/GR-Ob rats with added glucose intolerance developed retinal degeneration similar to the parent line WNIN/Ob. The severity of retinal degeneration was greater in WNIN/GR-Ob rats compared to WNIN/Ob, suggesting a possible role for IGT in this model. Hence, the WNIN/GR-Ob model could be a valuable tool for investigating the impact of MetS on retinal degeneration pathology.
Introduction
Obesity is a multifactorial, highly complex medical condition involving abnormal or excessive body fat accumulation that can cause health impairment. Epidemiological studies suggest that the prevalence and severity of obesity have increased to epidemic proportions worldwide, making it a global public health problem. It has been estimated that 937 million people are overweight and 328 million obese globally [1,2]. Obesity can lead to islet β-cell failure, increased insulin resistance, and subsequently type 2 diabetes mellitus [3]. Moreover, obesity is a potential risk factor for a wide variety of pathologies [4-6]. The cluster of interconnected factors that increase the risk of obesity-induced diabetes mellitus, cardiovascular/atherosclerotic lesions, chronic kidney diseases, hypertension, stroke, and some types of cancer are collectively referred to as metabolic syndrome (MetS) [7,8]. Ophthalmic complications reported to be associated with MetS include retinopathy, high intraocular pressure, cataract, macular degeneration, and exophthalmitis [9,10]. The alarming increase in the prevalence of obesity or MetS is likely to further exacerbate the risk for ophthalmic abnormalities associated with obesity. Retinal diseases, including age-related macular degeneration (AMD), retinitis pigmentosa (RP), and diabetic retinopathy (DR), represent the leading cause of irreversible blindness in developed and developing countries [11,12]. AMD and RP are the most common degenerative diseases of the retina. While AMD is characterized by a loss of central vision, RP is typically characterized as a rod–cone dystrophy leading to the loss of rod and cone photoreceptors, and predominantly the degeneration of rod photoreceptors [13-15]. Establishing model systems will enable us to understand the molecular pathology of these diseases.
In several populations, obesity is one of the basic components of MetS, which is implicated in microvascular changes in the retina [16]. Further, retinal degeneration has been reported as a component of obesity-associated syndrome in both patients and mouse models with mutations in Tub and Bardet–Biedl syndrome (BBS) genes [17-19]. However, obesity develops along with or much later than retinal changes in tubby mice and mouse models of BBS. Earlier, we reported progressive retinal degeneration as a consequence of obesity in a spontaneously generated obese rat (WNIN/Ob) [19]. This model was isolated and developed from the existing Wistar stock of rats at the National Institute of Nutrition (WNIN) [20,21]. Subsequently, another strain with impaired glucose tolerance (IGT), WNIN/GR-Ob, was developed by mating the WNIN/Ob strain with an insulin-resistance strain [22]. In essence, WNIN/GR-Ob has the IGT trait, while WNIN/Ob does not. Hence, the WNIN/Ob and WNIN/GR-Ob phenotypes are distinct from their respective lean littermates in terms of various biochemical, histological, and pathophysiological features [22-24]. Genetic analysis of this model localized the disease gene to the region upstream to the leptin receptor [25]. By taking advantage of the WNIN/GR-Ob rat model, in this study, we investigated the effect of MetS, glucose intolerance (IGT), and obesity on retinal degeneration.
Methods
Materials
An RNA purification kit was obtained from Qiagen (Hilden, Germany). The High-Capacity cDNA Reverse Transcription Kit and Power SYBR Green Master Mix were obtained from Applied Biosystems (Warrington, UK). All primers were procured from Integrated DNA Technologies (Coralville, IA). Mouse monoclonal anti-rhodopsin (1:1000 dilution; Thermo Scientific), mouse anti-postsynaptic density protein-95 (PSD-95; 1:200 dilution; Sigma-Aldrich, St. Louis, MO), recombinant anti-calretinin (1:1000 dilution; Chemi-Con, Millipore, Billerica), anti–glial fibrillary acidic protein (GFAP; 1:500 dilution; Sigma-Aldrich), and anti–vascular endothelial growth factor (VEGF; 1:50 dilution; Thermo Scientific) were used. Vectashield mounting medium containing 4,6-diamidino-2-phenylindole (DAPI) was obtained from Vector Laboratories (Burlingame, CA). Alexa Fluor 488–conjugated anti-rabbit and Alexa Fluor 555–conjugated anti-mouse antibodies were obtained from Molecular Probes (Eugene, OR). An in situ cell death detection kit was obtained from Roche Diagnostics (GmBH, Mannheim, Germany).
Animals and tissue collection
WNIN/GR-Ob and WNIN/Ob rats were obtained from the National Center for Laboratory Animal Sciences (NCLAS), National Institute of Nutrition, Hyderabad (India). Animals were kept on a 12 h:12 h light-dark cycle with ambient light and temperature at the NCLAS. WNIN/GR-Ob rats that were 3, 6, 12, and 15 months old, along with their respective lean littermates, were fasted overnight and sacrificed by CO2 asphyxiation at the end of the dark cycle. All procedures involving rats were performed in accordance with the Association for Research in Vision and Ophthalmology (ARVO) statement for the use of Animals in Ophthalmic and Vision Research and were approved by the Institutional Animal Ethics Committee at the National Institute of Nutrition. All studies described were performed by evaluating at least three animals.
Histology and immunohistochemistry
Eyes extracted from three rats in each age group were processed for embedding and sectioning using standard protocols, as described previously [19,26]. One eye of each rat was used for morphological evaluation, while the fellow eye was used for immunohistochemistry. Eyeballs were fixed in 4% paraformaldehyde in phosphate-buffer (pH 7.2), followed by embedding and sectioning for paraffin or cryosections. While the sections stained with hematoxylin and eosin were analyzed by light microscopy for retinal morphology, the ultrastructure was analyzed by electron microscopy. Immunohistochemistry on retinas of 12-month-old rats was performed on paraffin sections. The transverse sections (4 μm) were mounted in silane coated slides. Deparaffinized sections were processed in 10 mM sodium citrate buffer (pH 6.0) and heated for antigen retrieval. After blocking, the respective primary antibodies were added to the sections in a volume of 100 μl and allowed to incubate overnight at 4 °C. After incubation, the sections were washed three times for 5 min in PBS, and 100 μl of respective Alexa Fluor-555 and Alexa Fluor-488 secondary antibodies solution was added. After washing, the slides were mounted in anti-fade reagent containing DAPI and observed under a Leica LMD 6000 microscope (Wetzlar, Germany). Images were captured using appropriate filters.
Global gene expression by transcriptome analysis
Five micrograms of total retinal RNA from 3- and 12-month-old WNIN/GR-Ob and WNIN/Ob rats, along with the respective age-matched lean rats (isolated from two pooled retinas from each age group), were used to synthesize double-stranded cDNA (ds-cDNA) using a first and second strand cDNA synthesis kit (Affymetrix, Santa Clara, CA) according to the manufacturer’s guidelines. Basically, total RNA was reverse transcribed to cDNA which is converted to ds-cDNA. Purification of ds-cDNA, labeling, hybridization, washing, and staining steps were performed according to the Affymetrix protocol. These procedures or protocols are available at the Affymetrix website.The rat Gene 1.0 ST Array Chip (Affymetrix) was used for hybridization. Gene chips were scanned (Microarray Suite 5.0 [Affymetrix] by GCOS software version 2.0), and expression data were normalized using robust multiarray averaging [27]. Data were based on three gene chips per age group (WNIN/GR-Ob and WNIN/Ob and the respective lean rats). Data quality control (QC) was performed on arrays as recommended by Affymetrix, and Robust Multi-array Average (RMA) summarized data were subsequently analyzed for differential expression. The QC analysis was performed using the Affymetrix Expression Console (EC), and the statistical analysis was performed using R programming language. Ratios of average signal intensity (Log2-transformed data) were calculated for the probe sets and converted to fold change relative to the respective lean rats [19,27]. A term was significant if p≤0.05; then it was considered to be enriched with genes. Accordingly, the further biological relevance of the term and the associated genes was explored. Previously, we used the rat gene expression chip (230.20; Affymetrix) for the studies on WNIN/Ob rat model ([19]. Therefore, we also analyzed the retinal transcriptome of WNIN/Ob model for comparison purpose using the rat Gene 1.0 ST Array Chip.
Quantitative real-time PCR
Total RNA was extracted from retina using Tri-reagent. Isolated RNA was further purified by RNeasy Mini Kit and quantified by measuring the absorbance at 260 and 280 nm on a spectrophotometer (NanoDrop Technologies, Delaware). Two micrograms of total RNA were reverse transcribed using a High Capacity cDNA Reverse Transcription Kit. The reverse transcription reaction was performed using a thermocycler (ABI 9700, Applied Biosystems, Foster City, CA), and reaction conditions were as follows: initial reverse transcription for 10 min at 25 °C, followed by 37 °C for 120 min and 84 °C for 5 min. Real-time PCR (RT-PCR; Applied Biosystems) was performed in triplicate with 25 ng of cDNA template using SYBR Green Master Mix with gene-specific primers (Appendix 1). The reaction conditions were as follows: 40 cycles of initial denaturation temperature at 95 °C for 30 s, followed by annealing at 52 °C for 40 s, and extension at 72 °C for 1 min. The product specificity was analyzed using melt curve analysis. Normalization and validation of data were performed using β-actin as an internal control, and data were compared between WNIN/GR-Ob and the age-matched lean samples according to the comparative threshold cycle (2-ΔΔct) method. Student t tests were used to compare the mean values among different groups for a given age. Values of p<0.05 were considered significant.
Results
Morphological changes
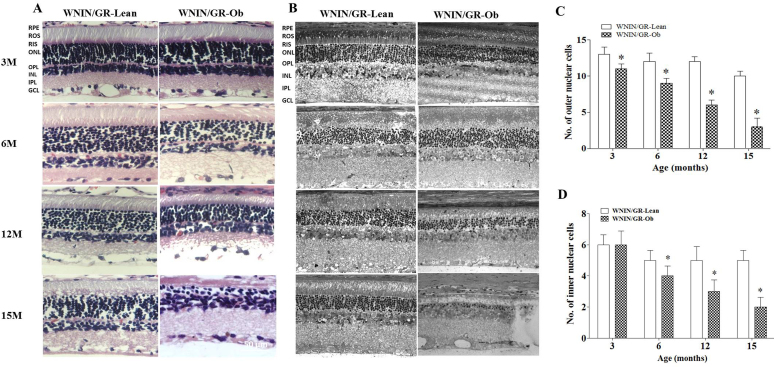
Progressive alterations in morphology were observed in the retinas of WNIN/GR-Ob rats from 3 months of age onwards (Figure 1). At 6 months, the thickness of the photoreceptor and outer plexiform layer (OPL) in the central retina of WNIN/GR-Ob rats was reduced when compared to lean rats and further reduced by 12 months (approximately 50–60% of that of lean rats; Figure 1A-B). Further damage of photoreceptors and the OPL was observed in the central regions of 15-month-old WNIN/GR-Ob rats compared to lean animals (Figure 1A-B). A concomitant decrease occurred in outer nuclear layer (ONL) and inner nuclear layer (INL) thickness of the retina at 6, 12, and 15 months, demonstrating abnormalities in the retinal layers as observed by hematoxylin and eosin (H&E) staining (Figure 1C-D). These results indicate progressive degeneration of retinal cells of WNIN/GR-Ob rats.
Figure 1.
Histology of the retina in various age groups. A: Representative hematoxylin and eosin (H&E) images of the WNIN/GR-Ob rat retina at 3, 6, 12, and 15 months of age in comparison with age-matched lean rats. B: Representative ultrastructural (electron microscope) images. Histograms summarizing the number of cells in the ONL (C) and INL (D) of the central retina of WNIN/GR-Ob rats compared to respective age-matched lean rats based on H&E analyses. Values represent mean ± standard deviation (SD; n = 3; “*” significantly different from their respective lean rats at p≤0.05). ROS, retinal outer segment; RIS, retinal inner segment; ONL, outer nuclear layer; OPL, outer plexiform layer; INL, inner nuclear layer; IPL, inner plexiform layer; GC, ganglion cell layer.
Immunohistochemistry
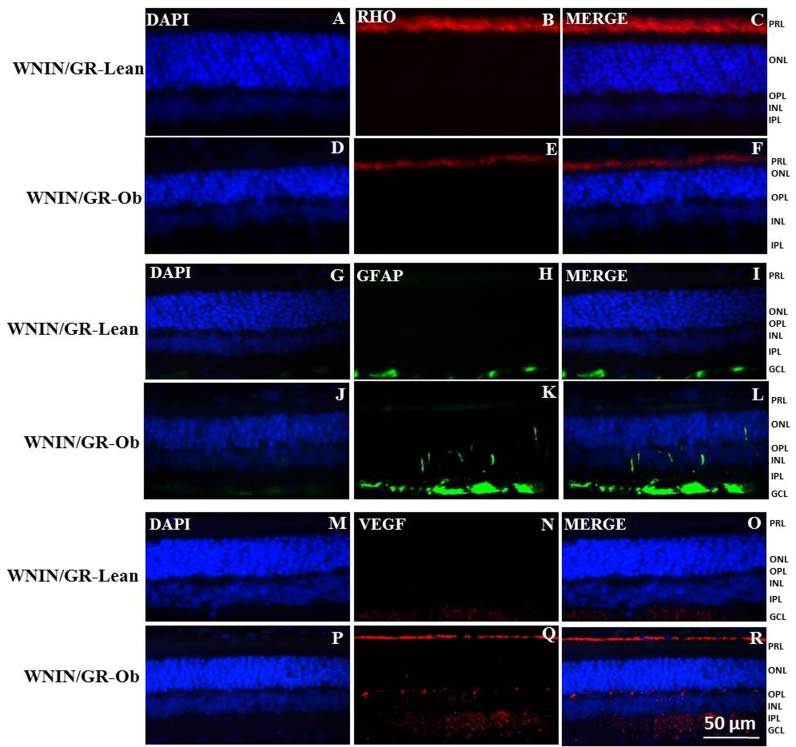
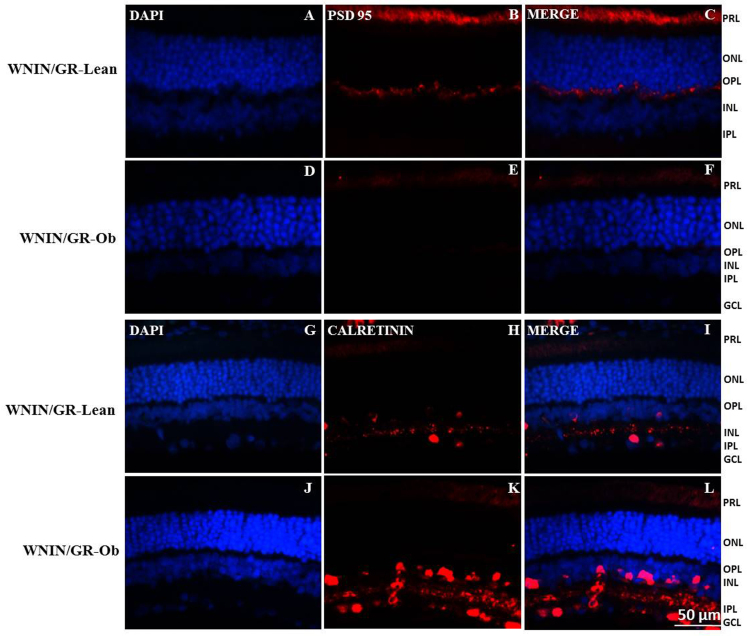
Immunohistochemical analyses were performed using retinas from 12-month-old WNIN/GR-Ob rats and various retinal cell-specific markers. Immunostaining using the rhodopsin antibody showed a substantially reduced signal in the WNIN/GR-Ob rat retina compared with that of lean control rats (Figure 2A-F). GFAP staining on the WNIN/GR-Ob rat retina showed a strong signal not only in the ganglion cell layer (GCL) but also in the other layers of the retina compared to lean rats (Figure 2G-L). Similarly, immunostaining of VEGF in 12-month-old WNIN/GR-Ob rats showed an increased signal compared to lean rats (Figure 2M-R). PSD-95 staining of retinal sections from WNIN/GR-Ob rats showed a substantial reduction compared to age-matched lean rats (Figure 3A-F). Labeling of horizontal and aII amacrine cells with calretinin showed increased immunostaining in retinas from WNIN/GR-Ob rats compared to the respective lean rats (Figures 3G-L). Fundoscopy also confirmed the retinal damage. Moreover, neovascularization was apparent in the WNIN/GR-Ob rats (data not shown).
Figure 2.
Immunohistochemical evaluation of expression of retinal markers in 12-month-old WNIN/GR-Ob rats. The expression value of each bar was compared to its respective age-matched lean rat which is taken as 1 (or 100%) for calculating the fold change. A-F: rhodopsin, G-L: glial fibrillary acidic protein (GFAP), and M-R: vascular endothelial growth factor (VEGF). Nuclei are labeled with 4,6-diamidino-2-phenylindole (DAPI). Scale bar, 50 µm.
Figure 3.
Immunohistochemical evaluation of expression of postsynaptic density protein 95 (PSD-95) and calretinin in 12-month-old WNIN/GR-Ob rat. A-F: PSD-95 and G-L: calretinin. Nuclei are labeled with 4,6-diamidino-2-phenylindole (DAPI). Scale bar, 50 µm.
qRT-PCR analysis
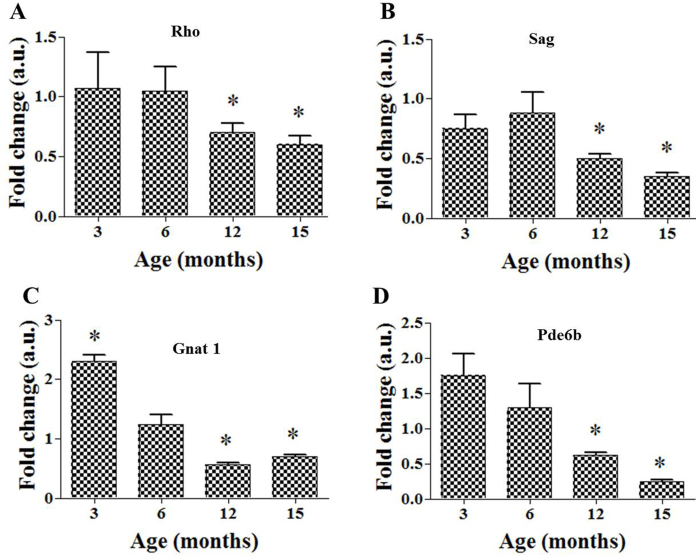
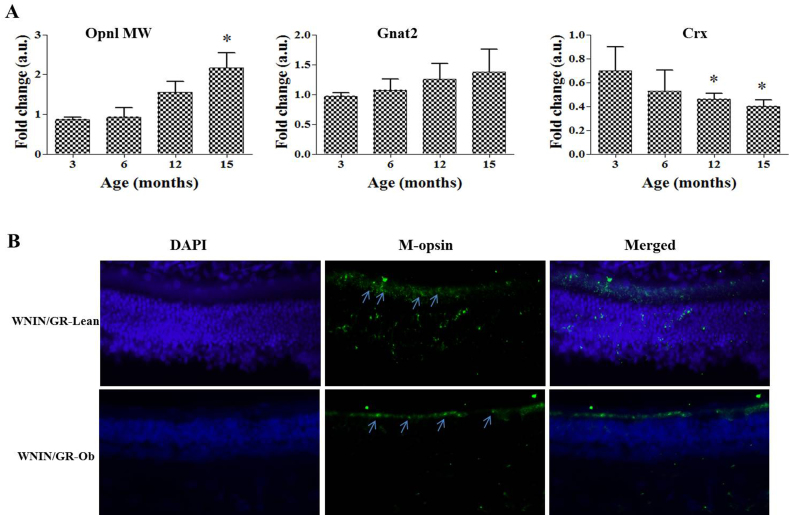
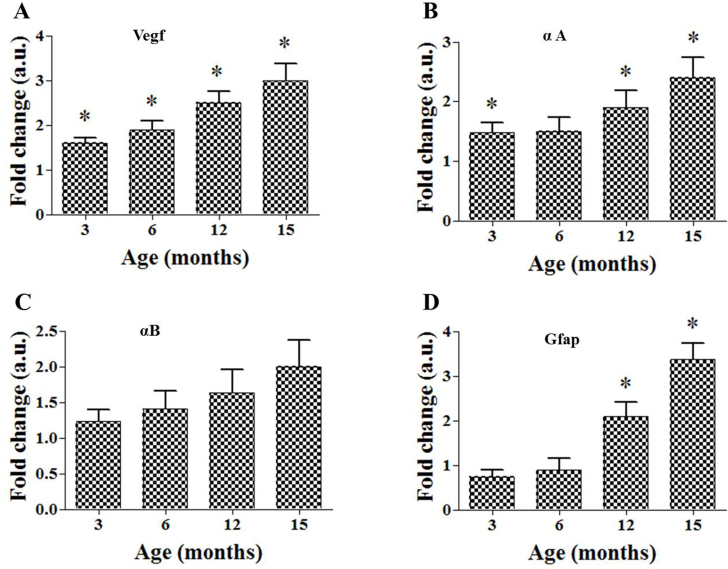
We analyzed the expression of selected retinal genes in retinas from WNIN/GR-Ob rats by quantitative RT-PCR (qRT-PCR) at 3, 6, 12, and 15 months of age. Compared to the respective lean controls, the expressions of the rod-specific genes Rho, rod arrestin (Sag), rod transducin (Gnat1) and cGMP-dependent phosphodiesterase 6B (Pde6B) were reduced in the WNIN/GR-Ob rat retina from 6 months onward, but they were significantly lower at 12 and 15 months of age (Figure 4A-D). In contrast, the expressions of cone markers, Opnl-MW and Gnat2, were higher in retinas from the WNIN/GR-Ob rats, particularly at 12 and 15 months of age (Figure 5A). Immunohistochemical staining of a cone marker, M-opsin, consolidated the observations of cone marker expression at the transcript level (Figure 5B). The expression level of a retinal transcription factor, cone–rod homeobox gene (Crx), was decreased significantly in all age groups in WNIN/GR-Ob when compared to the lean controls (Figure 5A). The transcript levels of stress-related genes of the retina, such as vegf, gfap, αA-crystallin, and αB-crystallin, were upregulated from 3 months onward in WNIN/GR-Ob rats, with some comparisons reaching statistical significance (Figure 6A-D).
Figure 4.
Expression of rod-specific genes by quantitative real-time PCR (qRT-PCR). A: Rho, B: Sag, C: Gnat1 and D: Pde-6b in 3-, 6-, 12-, and 15-month-old WNIN/GR-Ob rats. The expression value of each bar was compared to its respective age-matched lean rat which is taken as 1 (or 100%) for calculating the fold change. Data represent fold change (mean ± standard deviation [SD]) over respective age-matched lean rats (n = 3; “*” p<0.05). “*” significantly different from the respective age-matched lean rats at p≤0.05.
Figure 5.
Expression of cone markers and Crx by quantitative real-time PCR (qRT-PCR) and immunohistochemistry. The expression value of each bar was compared to its respective age-matched lean rat which is taken as 1 (or 100%) for calculating the fold change. A: Expression of cone-specific genes (Opnl MW and Gnat2) and rod–cone transcriptional marker Crx in 3-,6-, 12- and 15-month-old WNIN/GR-Ob rats. Data represent fold change (mean ± standard deviation [SD]) over respective age-matched lean rats (n = 3; “*” p<0.05). “*” significantly different from the respective age-matched lean rats at p≤0.05. B: Immunohistochemical evaluation of expression of cone marker M-opsin in 12-month-old WNIN/GR-Ob and respective lean rats. Nuclei are labeled with 4,6-diamidino-2-phenylindole (DAPI). Arrows indicate staining of M-opsin. Scale bar, 50 µm.
Figure 6.
Expression of stress-related genes by quantitative real-time PCR (qRT-PCR). There are three corrections. A: Vegf, B: αA-crystallin, C: αB-crystallin, and D: Gfap in 3-, 6-, 12-, and 15-month-old WNIN/GROb. Data represent fold change (mean ± SD) over respective age-matched lean rats (n = 3; “*” p<0.05). The expression value of each bar was compared to its respective age-matched lean rat which is taken as 1 (or 100%) for calculating the fold change. “*” significantly different from the respective age-matched lean rats at p≤0.05.
Microarray analysis and validation
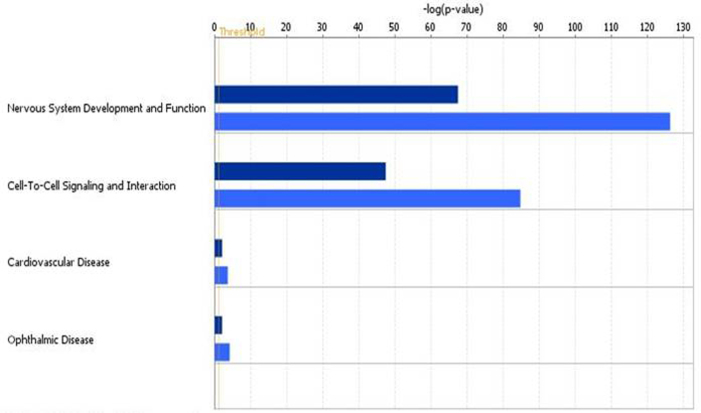
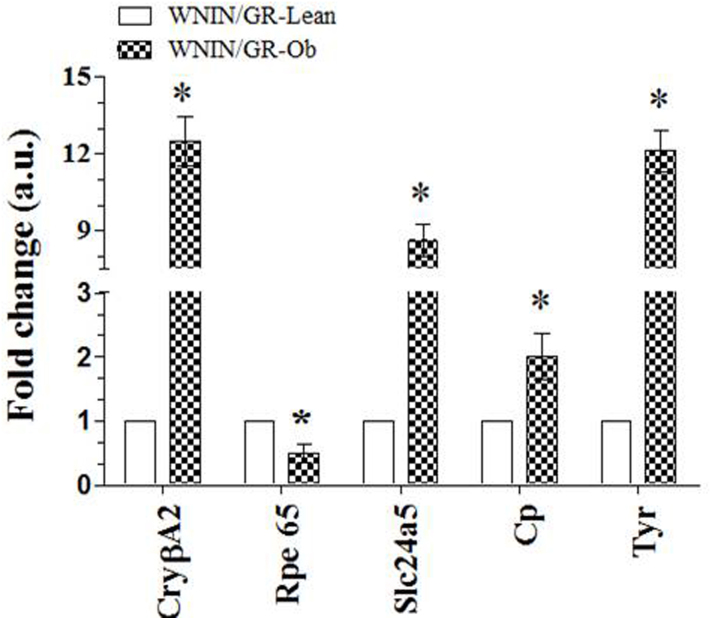
Selecting those genes with an adjusted p-value of 0.05 and a threefold difference, we found 191 genes differentially expressed in the WNIN/GR-Ob retina at 3 months of age; of these, 167 showed lower levels of expression, while 24 genes’ expressions were found to be significantly higher than in lean controls (Appendix 2). In the case of WNIN/Ob rats, extremely few differentially expressed genes (39 downregulated and 9 upregulated) were observed in the retina at 3 months compared to age-matched lean control rats. However, at 12 months of age, transcriptome analysis resulted in 561 genes, of which 454 were downregulated and 107 genes were upregulated in the WNIN/GR-Ob rat retina when compared to the lean controls. In the case of WNIN-Ob rats, we measured 334 differentially expressed genes (303 downregulated and 31 upregulated) compared to the lean controls. Genes involved in various functional pathways or diseases were identified using a cellular functional analysis tool available in Ingenuity Pathway Analysis (IPA; Ingenuity Systems, Redwood City, CA) [28]. As reported earlier with WNIN/Ob, while most downregulated genes in this study were related to the visual cycle, phototransduction pathway, or retinal structural proteins or transcription factors, upregulated genes were related to the stress response and inflammation-related genes. Based on IPA, the top five predicted diseases are connected to nervous system development and function, cell-to-cell signaling and interaction, ophthalmic diseases, tissue morphology, and visual system development and function (Figure 7). Furthermore, the extent of alterations in these cellular functions was greater in the WNIN/GR-Ob rat retina compared to the WNIN/Ob rat retina (Figure 7). To validate the observations by microarray analysis, qRT-PCR analysis of selected retinal genes, namely CryβA2, Rpe65, Slc24a5, Cp, and Tyr, was performed in retinas from 12-month-old lean and WNIN/GR-Ob rats (Figure 8). The results were consistent with those of the microarray data.
Figure 7.
Top four altered cellular functions/diseases associated with obesity and metabolic syndrome (MetS). Cellular functions and diseases associated with the differentially expressed genes in WNIN/Ob and WNIN/GR-Ob (with respect to their corresponding lean controls) were identified using a cellular functional analysis tool available in Ingenuity Pathway Analysis (IPA; Ingenuity Systems, Redwood City, CA). Dark blue bars represent WNIN/Ob and light-blue bars represent WNIN/GR-Ob rats.
Figure 8.
Expression of CrybA2, Rpe65, Slc24a5, Cp, and Tyr by quantitative real-time PCR (qRT-PCR) of the retina in 12 months old WNIN/GR-Ob rat. Data represent fold change (mean ± standard deviation [SD]) over respective age-matched lean rats (n = 3; “*” p<0.05).
Discussion
Epidemiological studies have revealed a relationship between obesity and retinal abnormalities [24,29-32]. Studies on animal models corroborate the association between obesity and retinal degeneration. In the case of tubby mice, neurosensory abnormalities develop much earlier than the onset of obesity. Further, the obesity in tubby mice is relatively mild, exhibits a late onset, and progresses slowly [17,18]. Among other rodent models of obesity, ocular complications—pronounced retinal alterations in particular—were found in diabetic (fa/fa) obese rats when they were sucrose diet fed for 68 weeks [30]. A suitable rodent model of obesity along with glucose intolerance and retinal degeneration is needed to investigate the effect of MetS on retinal degeneration. MetS is a cluster of interrelated metabolic derangements, including disturbances in glucose and insulin metabolism, abdominal obesity, an abnormal lipid profile and high blood pressure, all of which were observed in WNIN/GR-Ob rats, making this a suitable model of MetS [24,31].
We previously reported retinal degeneration in a spontaneous obese rat (WNIN/Ob) model [19]. However, WNIN/Ob did not display IGT; hence, it is not a typical model of MetS. In contrast, the WNIN/GR-Ob rat is unique because of traits of IGT and obesity that are similar to those of MetS. Hence, in this study, we investigated retinal abnormalities in the WNIN/GR-Ob rat model. In the case of the WNIN/Ob model, no significant changes were observed in retinal morphology at 2–3 months of age, and the onset of retinal abnormalities was observed between 4 and 6 months of age [19]. In contrast changes were evident as early as 3 months of age in WNIN/GR-Ob rats, and these progressed further with age. These observations suggest an additional effect of IGT along with obesity on the retinal phenotype.
In the case of WNIN/Ob rats, there was a nearly 50% reduction in rhodopsin staining at 12 months [19]. A substantial reduction (roughly 90%) in rhodopsin was observed in WNIN/GR-Ob compared to respective lean rats. In addition, staining of another retinal marker, PSD-95 also decreased by almost 90% in WNIN/GR-Ob rats compared to respective lean rats. In concurrence with the loss of photoreceptor cells, there was an increase in the gliosis marker, GFAP, in WNIN/GR-Ob rats, which gives further evidence of atrophy in the retina. There was an increase in the angiogenic protein VEGF and calcium binding protein calretinin (inner retinal marker) in WNIN/GR-Ob rats. The expression pattern of these genes at transcript levels in the WNIN/GR-Ob rat retina also supports photoreceptor degeneration. The downregulated genes appear to be involved predominantly in transcriptional regulation (Crx) and visual transduction (Gnat, Pde6B, Sag, and Rho). The downregulation of rod cell specific genes may reflect the loss of photoreceptors rather than decreased expression of these genes. In several types of retinal degeneration, in patients and animal models, rod cell death precedes cone loss [33,34]. We observed preservation of cones in the WNIN/Ob model at 12 months of age, when rod degeneration was significant, although we did not analyze these rats beyond 12 months of age [19]. Interestingly, in WNIN/GR-Ob rats, cones did not seem to be affected even at 15 months of age. These findings support our earlier speculation that the molecular defect underlying retinal degeneration in these rats is associated with a biological pathway that is critical for rod cell survival [19]. Further, both these rat models of obesity and MetS (WNIN/Ob and WNIN/GR-Ob) with spared cone cells despite significant rod cell loss may aid in understanding possible means to preserve cones in the absence of rods.
Earlier, we analyzed global gene expression in the retina of WNIN/Ob model at only 12 months of age, and significant changes in the retina were noted. Since we found that retinal alterations were earlier and more severe in WNIN/GR-Ob than in the WNIN/Ob model, we analyzed the global gene expression at 3 and 12 months in the WNIN/GR-Ob and WNIN/Ob models using the respective age-matched lean rats as controls. We found a higher number of differentially expressed (DE) genes in the WNIN/GR-Ob retina compared to the WNIN/Ob retina at 3 months. This further supports the earlier onset of a retinal phenotype in WNIN/GR-Ob rats compared to WNIN/Ob rats. Similarly, transcriptome analysis at 12 months of age resulted in 561 DE genes (454 downregulated and 107 upregulated) in WNIN/GR-Ob rat retinas. Using the rat gene expression 230.20 chip, we previously measured 423 DE genes (369 downregulated and 54 upregulated) in the WNIN/Ob rat [19], but in the present study with the rat gene 1.0 ST Array, we measured 334 DE genes (303 downregulated and 31 upregulated) in WNIN/Ob rats. Although the cellular functional analysis and associated diseases of the transcriptome data showed a similar pattern in both the models, the extent of fold changes in gene expression was greater in the WNIN/GR-Ob model compared to WNIN/Ob rats (Figure 7), indicating an added influence of IGT along with obesity on retinal dystrophies. Upregulation of stress-related genes, Cp, Tyr, αA, and αB, was observed in the WNIN/GR-Ob rat retina by microarray and qRT-PCR (Figure 6); such upregulation has also been reported for some other retinal disorders [35,36]. It should be noted that crystallin betaA2 (Cryba2), which has been shown to be associated with cataract [37], was upregulated in the WNIN/GR-Ob rats. In contrast, Rpe65 (retinoid isomerohydrolase), which has been reported to be involved in visual pigment regeneration [38], was downregulated in WNIN/GR-Ob rats. Solute carrier family 24 member 5 (Slc24a5), upregulated in WNIN/GR-Ob, has been shown to be associated with oculocutaneous albinism [39].
In summary, WNIN/GR-Ob rats showed earlier onset and severe retinal degeneration when compared with the WNIN/Ob rats. The reason for this could be the added IGT along with obesity in WNIN/GR-Ob rats. Hence, this rat model of MetS may be useful for investigating MetS-associated retinal degeneration, as well as for developing intervention strategies.
Acknowledgments
KKG is a Fellow of University Grants Commission-Faculty Development Program. SSR received a grant from SERB (Science and Engineering research board) SB/YS/LS-271/2013. GBR received grants from Department of Biotechnology, Government of India (BT/PR11097/Med/12/411/2008) under the Indo-US Vision Research Program. RA was supported by The Foundation Fighting Blindness, Research to Prevent Blindenss, NIH-EY21237, P30-EY22589 grants. MMJ was supported by an unrestricted grant from Research to Prevent Blindness and NIH-EY021200. The authors are grateful to Dr. Satish K. Madala, Pulmonary Medicine, Cincinnati Children’s Hospital Medical Center, Cincinnati (USA) for the help with transcriptome analysis for functional pathways or diseases using Ingenuity Pathway Analysis program. The authors acknowledge Dr. N. V. Giridharan, National Institute of Nutrition, Hyderabad, for critical inputs into the study.
Appendix 1. Primer sequences of genes used for real-time PCR.
To access the data, click or select the words “Appendix 1.”
Appendix 2. Number of differentially expressed genes in retina based on microarray analysis of WNIN/GR-Ob and WNIN/Ob rat (compared to respective lean controls).
To access the data, click or select the words “Appendix 2.”
References
- 1.Finucane MM, Stevens GA, Cowan MJ, Danaei G, Lin JK, Paciorek CJ, Singh GM, Gutierrez HR, Lu Y, Bahalim AN, Farzadfar F, Riley LM, Ezzati M. Global Burden of Metabolic Risk Factors of Chronic Diseases Collaborating G. National, regional, and global trends in body-mass index since 1980: systematic analysis of health examination surveys and epidemiological studies with 960 country-years and 9.1 million participants. Lancet. 2011;377:557–67. doi: 10.1016/S0140-6736(10)62037-5. [DOI] [PMC free article] [PubMed] [Google Scholar]
- 2.Hu T, Mills KT, Yao L, Demanelis K, Eloustaz M, Yancy WS, Jr, Kelly TN, He J, Bazzano LA. Effects of low-carbohydrate diets versus low-fat diets on metabolic risk factors: a meta-analysis of randomized controlled clinical trials. Am J Epidemiol. 2012;176(Suppl 7):S44–54. doi: 10.1093/aje/kws264. [DOI] [PMC free article] [PubMed] [Google Scholar]
- 3.Prentki M, Nolan CJ. Islet beta cell failure in type 2 diabetes. J Clin Invest. 2006;116:1802–12. doi: 10.1172/JCI29103. [DOI] [PMC free article] [PubMed] [Google Scholar]
- 4.Flegal KM, Kit BK, Orpana H, Graubard BI. Association of all-cause mortality with overweight and obesity using standard body mass index categories: a systematic review and meta-analysis. JAMA. 2013;309:71–82. doi: 10.1001/jama.2012.113905. [DOI] [PMC free article] [PubMed] [Google Scholar]
- 5.Dixon JB. The effect of obesity on health outcomes. Mol Cell Endocrinol. 2010;316:104–8. doi: 10.1016/j.mce.2009.07.008. [DOI] [PubMed] [Google Scholar]
- 6.Fontaine KR, Redden DT, Wang C, Westfall AO, Allison DB. Years of life lost due to obesity. JAMA. 2003;289:187–93. doi: 10.1001/jama.289.2.187. [DOI] [PubMed] [Google Scholar]
- 7.Vanni E, Bugianesi E. Obesity and liver cancer. Clin Liver Dis. 2014;18:191–203. doi: 10.1016/j.cld.2013.09.001. [DOI] [PubMed] [Google Scholar]
- 8.Kumar PA, Chitra PS, Reddy GB. Metabolic syndrome and associated chronic kidney diseases: nutritional interventions. Rev Endocr Metab Disord. 2013;14:273–86. doi: 10.1007/s11154-013-9268-2. [DOI] [PubMed] [Google Scholar]
- 9.Bohlman H. Communicating the ocular and systemic complications of obesity to patients. Optometry. 2005;76:701–12. doi: 10.1016/j.optm.2005.07.008. [DOI] [PubMed] [Google Scholar]
- 10.Cheung N, Wong TY. Obesity and eye diseases. Surv Ophthalmol. 2007;52:180–95. doi: 10.1016/j.survophthal.2006.12.003. [DOI] [PMC free article] [PubMed] [Google Scholar]
- 11.Klein R, Peto T, Bird A, Vannewkirk MR. The epidemiology of age-related macular degeneration. Am J Ophthalmol. 2004;137:486–95. doi: 10.1016/j.ajo.2003.11.069. [DOI] [PubMed] [Google Scholar]
- 12.Krishnaiah S, Das T, Nirmalan PK, Nutheti R, Shamanna BR, Rao GN, Thomas R. Risk factors for age-related macular degeneration: findings from the Andhra Pradesh eye disease study in South India. Invest Ophthalmol Vis Sci. 2005;46:4442–9. doi: 10.1167/iovs.05-0853. [DOI] [PubMed] [Google Scholar]
- 13.Cogan DG. Primary chorioretinal aberrations with night blindness; pathology. Trans Am Acad Ophthalmol Otolaryngol. 1950;54:629–61. [PubMed] [Google Scholar]
- 14.Verhoeff FH. Microscopic Observations in a Case of Retinitis Pigmentosa. Trans Am Ophthalmol Soc. 1930;28:176–95. [PMC free article] [PubMed] [Google Scholar]
- 15.Weleber RG, Murphey WH. Molecular advances in retinitis pigmentosa. West J Med. 1991;155:423–4. [PMC free article] [PubMed] [Google Scholar]
- 16.Wong TY, Duncan BB, Golden SH, Klein R, Couper DJ, Klein BE, Hubbard LD, Sharrett AR, Schmidt MI. Associations between the metabolic syndrome and retinal microvascular signs: the Atherosclerosis Risk In Communities study. Invest Ophthalmol Vis Sci. 2004;45:2949–54. doi: 10.1167/iovs.04-0069. [DOI] [PubMed] [Google Scholar]
- 17.Hagstrom SA, North MA, Nishina PL, Berson EL, Dryja TP. Recessive mutations in the gene encoding the tubby-like protein TULP1 in patients with retinitis pigmentosa. Nat Genet. 1998;18:174–6. doi: 10.1038/ng0298-174. [DOI] [PubMed] [Google Scholar]
- 18.Ohlemiller KK, Hughes RM, Lett JM, Ogilvie JM, Speck JD, Wright JS, Faddis BT. Progression of cochlear and retinal degeneration in the tubby (rd5) mouse. Audiol Neurootol. 1997;2:175–85. doi: 10.1159/000259242. [DOI] [PubMed] [Google Scholar]
- 19.Reddy GB, Vasireddy V, Mandal MN, Tiruvalluru M, Wang XF, Jablonski MM, Nappanveettil G, Ayyagari R. A novel rat model with obesity-associated retinal degeneration. Invest Ophthalmol Vis Sci. 2009;50:3456–63. doi: 10.1167/iovs.08-2498. [DOI] [PMC free article] [PubMed] [Google Scholar]
- 20.Girdharan NVHN, Satyavani M. A new rat model for the study of obesity. Scand J Lab Anim Sci. 1996;23:131–7. [Google Scholar]
- 21.Giridharan NV. Animal models of obesity & their usefulness in molecular approach to obesity. Indian J Med Res. 1998;108:225–42. [PubMed] [Google Scholar]
- 22.Harishankar NVA, Giridharan NV. WNIN/GR-Ob -an insulin-resistant obese rat model from inbred WNIN strain. Indian J Med Res. 2011;134:320–9. [PMC free article] [PubMed] [Google Scholar]
- 23.Harishankar NKP, Sesikeran B, Giridharan N. Obesity associated pathophysiological & histological changes in WNIN obese mutant rats. Indian J Med Res. 2011;134:330–40. [PMC free article] [PubMed] [Google Scholar]
- 24.Reddy PY, Giridharan NV, Reddy GB. Activation of sorbitol pathway in metabolic syndrome and increased susceptibility to cataract in Wistar-Obese rats. Mol Vis. 2012;18:495–503. [PMC free article] [PubMed] [Google Scholar]
- 25.Kalashikam RR, Battula KK, Kirlampalli V, Friedman JM, Nappanveettil G. Obese locus in WNIN/obese rat maps on chromosome 5 upstream of leptin receptor. PLoS One. 2013;8:e77679. doi: 10.1371/journal.pone.0077679. [DOI] [PMC free article] [PubMed] [Google Scholar]
- 26.Reddy SS, Shruthi K, Reddy VS, Raghu G, Suryanarayana P, Giridharan NV, Reddy GB. Altered ubiquitin-proteasome system leads to neuronal cell death in a spontaneous obese rat model. Biochim Biophys Acta. 2014;1840:2924–34. doi: 10.1016/j.bbagen.2014.06.005. [DOI] [PubMed] [Google Scholar]
- 27.Yoshida S, Mears AJ, Friedman JS, Carter T, He S, Oh E, Jing Y, Farjo R, Fleury G, Barlow C, Hero AO, Swaroop A. Expression profiling of the developing and mature Nrl −/− mouse retina: identification of retinal disease candidates transcriptional regulatory targets of Nrl. Hum Mol Genet. 2004;13:1487–503. doi: 10.1093/hmg/ddh160. [DOI] [PubMed] [Google Scholar]
- 28.Madala SK, Edukulla R, Phatak M, Schmidt S, Davidson C, Acciani TH, Korfhagen TR, Medvedovic M, Lecras TD, Wagner K, Hardie WD. Dual targeting of MEK and PI3K pathways attenuates established and progressive pulmonary fibrosis. PLoS One. 2014;9:e86536. doi: 10.1371/journal.pone.0086536. [DOI] [PMC free article] [PubMed] [Google Scholar]
- 29.Adams MK, Simpson JA, Aung KZ, Makeyeva GA, Giles GG, English DR, Hopper J, Guymer RH, Baird PN, Robman LD. Abdominal obesity and age-related macular degeneration. Am J Epidemiol. 2011;173:1246–55. doi: 10.1093/aje/kwr005. [DOI] [PubMed] [Google Scholar]
- 30.Dosso A, Rungger-Brandle E, Rohner-Jeanrenaud F, Ionescu E, Guillaume-Gentil C, Jeanrenaud B, Leuenberger PM. Ocular complications in the old and glucose-intolerant genetically obese (fa/fa) rat. Diabetologia. 1990;33:137–44. doi: 10.1007/BF00404039. [DOI] [PubMed] [Google Scholar]
- 31.Eckel RH, Grundy SM, Zimmet PZ. The metabolic syndrome. Lancet. 2005;365:1415–28. doi: 10.1016/S0140-6736(05)66378-7. [DOI] [PubMed] [Google Scholar]
- 32.Peeters A, Magliano DJ, Stevens J, Duncan BB, Klein R, Wong TY. Changes in abdominal obesity and age-related macular degeneration: the Atherosclerosis Risk in Communities Study. Arch Ophthalmol. 2008;126:1554–60. doi: 10.1001/archopht.126.11.1554. [DOI] [PMC free article] [PubMed] [Google Scholar]
- 33.Jimenez AJG-FJ, Gonzalez B, Foster RG. The spatio-temporal pattern of photoreceptor degeneration in the aged rd/rd mouse retina. Cell Tissue Res. 1996;284:193–202. doi: 10.1007/s004410050579. [DOI] [PubMed] [Google Scholar]
- 34.Ogilvie JMTT, Lett JM, Speck J, Landgraf M, Silverman MS. Age-related distribution of cones and ON-bipolar cells in the rd mouse retina. Curr Eye Res. 1997;16:244–51. doi: 10.1076/ceyr.16.3.244.15411. [DOI] [PubMed] [Google Scholar]
- 35.Reddy VS, Raghu G, Reddy SS, Pasupulati AK, Suryanarayana P, Reddy GB. Response of small heat shock proteins in diabetic rat retina. Invest Ophthalmol Vis Sci. 2013;54:7674–82. doi: 10.1167/iovs.13-12715. [DOI] [PubMed] [Google Scholar]
- 36.Chen L, Dentchev T, Wong R, Hahn P, Wen R, Bennett J, Dunaief JL. Increased expression of ceruloplasmin in the retina following photic injury. Mol Vis. 2003;9:151–8. [PubMed] [Google Scholar]
- 37.Reis LM, Tyler RC, Muheisen S, Raggio V, Salviati L, Han DP, Costakos D, Yonath H, Hall S, Power P, Semina EV. Whole exome sequencing in dominant cataract identifies a new causative factor, CRYBA2, and a variety of novel alleles in known genes. Hum Genet. 2013;132:761–70. doi: 10.1007/s00439-013-1289-0. [DOI] [PMC free article] [PubMed] [Google Scholar]
- 38.Moiseyev G, Chen Y, Takahashi Y, Wu BX, Ma JX. RPE65 is the isomerohydrolase in the retinoid visual cycle. Proc Natl Acad Sci USA. 2005;102:12413–8. doi: 10.1073/pnas.0503460102. [DOI] [PMC free article] [PubMed] [Google Scholar]
- 39.Kamaraj B, Purohit R. Mutational analysis of oculocutaneous albinism: a compact review. BioMed Res Int. 2014;xxx:905472. doi: 10.1155/2014/905472. [DOI] [PMC free article] [PubMed] [Google Scholar]


