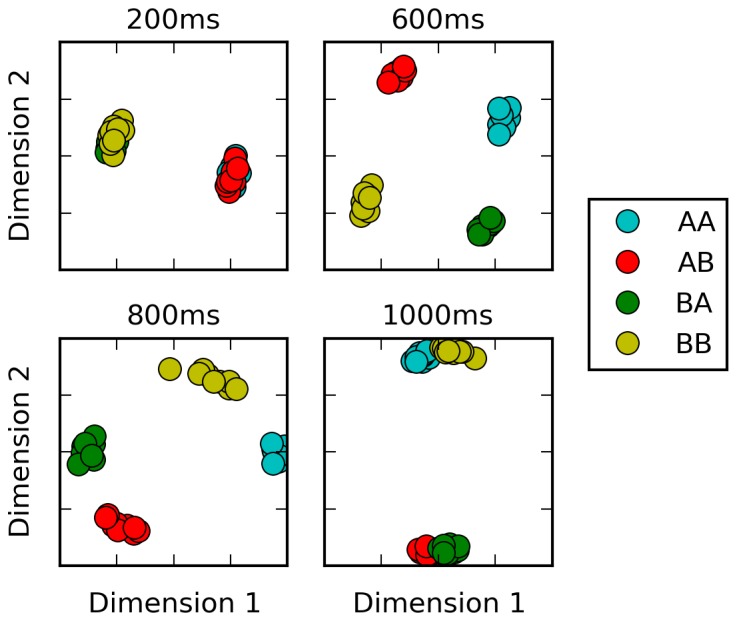
Figure 3. Multi-dimensional scaling plots of population activity reflect shifting encodings of task-relevant information.

Population response vectors at various points in time (color-coded by stimulus combination) are projected in two dimensions while preserving distances between data points as much as possible, using multi-dimensional scaling. At the end of the first stimulus presentation (200 ms), population states are firmly separated by first stimulus identity, as expected. After the second stimulus presentation (600 ms), all four possible stimulus combinations lead to clearly separate population activity states. However, population states corresponding to different responses start to cluster together at the onset of the response period (800 ms). Late in the response period (1000 ms), population trajectories corresponding to the same response (AA and BB, or BA and AB) have largely merged together, reflecting a shift from stimulus-specific to response-specific representation and a successful ‘routing’ of individual stimulus-specific states to the adequate response-specific state.
