

Abstract
Matrix metalloproteinase (MMP)-14 is an important target for cancer treatment due to its critical roles in tumor invasion and metastasis. Previous failures of all compound-based broad-spectrum MMP inhibitors in clinical trials suggest that selectivity is the key for a successful therapy. With inherent high specificity, monoclonal antibodies (mAbs) therefore arise as attractive inhibitors able to target the particular MMP of interest. As a routine screening method, enzyme-linked immunosorbent assays (ELISA) have been applied to panned phage libraries for the isolation of mAbs inhibiting MMP-14. However, because of suboptimal growth conditions and insufficient antibody expression associated with monoclonal ELISA, a considerable number of potentially inhibitory clones might not be identified. Taking advantage of next-generation sequencing (NGS), we monitored enrichment profiles of millions of antibody clones along three rounds of phage panning, and identified 20 Fab inhibitors of MMP-14 with inhibition IC50 values of 10–4000 nM. Among these inhibitory Fabs, 15 were not found by monoclonal phage ELISA. Particularly, Fab R2C7 exhibited an inhibition potency of 100 nM with an excellent selectivity to MMP-14 over MMP-9. Inhibition kinetics and epitope mapping suggested that as a competitive inhibitor, R2C7 directly bound to the vicinity of the MMP-14 catalytic site. This study demonstrates that deep sequencing is a powerful tool to facilitate the systematic discovery of mAbs with protease inhibition functions.
Keywords: Matrix metalloproteinase, inhibitory antibody, deep sequencing, synthetic library, bioinformatics
TOC image
High selectivity is critical for MMP-14 inhibition-based anti-cancer therapies, and mAbs have potential to provide the required selectivity. However conventional mAb screening methods can only discover a fraction of inhibitory clones. By profiling the sequence and frequency information of millions antibody clones with deep sequencing and bioinformatics, a panel of MMP-14 inhibitory mAbs missed by ELISA was successfully identified.
Introduction
Matrix metalloproteinases (MMPs) are a class of zinc dependent endopeptidases responsible for tissue remodeling and extracellular matrix degradation. MMPs play important roles within various aspects of cancer pathology, including tumor growth, metastasis, and angiogenesis (Zarrabi et al., 2011; Udi et al., 2015; Golubkov et al., 2005). In particular, membrane type-1 matrix metalloproteinase also known as MMP-14 is a leading factor in cell migration due to its ability to cleave cell surface molecules such as CD44, pro-αv integrin, and transglutaminase (Kajita et al., 2001; Baciu et al., 2003; Gingras et al., 2001). MMP-14 also processes proMMP-2 into active MMP-2, which promotes the migration of tumor cells (Udi et al., 2015; Deryugina et al., 2001). One of the major challenges with inhibiting MMP-14 as a therapy is the elimination of cross reactivity towards other MMPs. Mounting evidence has suggested that while many facets of MMP proteolytic action are pro-tumorigenic, some MMP family members exhibit tumor-suppressing effects in certain circumstances (Overall et al., 2006; Kessenbrock et al., 2010) – e.g. MMP-8 favors host defense instead of stimulating tumor proliferation (Decock et al., 2011), and MMP-9 exhibits opposing functions at different microenvironments (Egeblad and Werb, 2002). For these reasons, selectively blocking individual tumorigenesis-promoting MMPs in an appropriate timeframe is highly desired for a successful therapy. However, the catalytic domains of MMP family members share high amino acid similarity and their active sites are extensively conserved. Consequently, development of small molecule inhibitors to distinguish different MMPs is extraordinarily difficult (Zucker and Cao, 2009). Chemical compound inhibitors, e.g. hydroxamates, targeting broad-spectrum MMPs all failed in clinical trials due to severe side effects and a lack of efficacy overall (Turk, 2006). The demand for highly selective MMP inhibitors makes monoclonal antibodies an attractive alternative for MMP inhibition (Devy et al., 2009; Ager et al., 2015; Schneider et al., 2012; Sela-Passwell et al., 2011; Bonvin et al., 2015; Smith, 2015).
A panel of inhibitory Fabs targeting MMP-14 with high potency and high selectivity have been isolated from a synthetic human antibody library carrying convex paratopes encoded by long complementarity-determining regions (CDR) H3 regions with 23–27 amino acids, inspired by camelid antibody repertories (Nam et al., 2016). Unlike human or murine antibodies that have CDR-H3s of 12 and 9 amino acids on average, a large portion of heavy chain antibodies produced by camels or llamas contain long CDR3s that penetrate concave structures of enzyme reaction pockets and inhibit enzymatic functions [De Genst et al., 2006; Desmyter et al., 1996; Lauwereys et al., 1998; Forsman 2008; Spinelli et al., 1996]. Using phage panning and monoclonal ELISA screening, 14 Fabs inhibiting MMP-14 were isolated from the constructed human antibody libraries carrying long CDR-H3 regions. Particularly, Fabs 3A2 and 3D9 exhibited nM potency competitive inhibition towards MMP-14 with no reactivity to MMP-2 or MMP-9 (Nam et al., 2016). However, it has been demonstrated that standard ELISA screenings are incapable of recovering all the antibodies enriched by phage panning or other screening/selection processes (Ravn et al., 2010; Ravn et al., 2013), for at least two reasons: (1) slow growth rates of certain enriched clones resulting in low cell density after propagation; (2) low expression levels of certain antibody proteins resulting in weak ELISA signals.
Next-generation sequencing (NGS) technologies have revolutionized multiple aspects of biological researches (Margulies et al., 2005; Pushkarev et al., 2009; Metzker, 2010; Georgiou et al., 2014), with profound impacts on discovery of specific and functional mAbs (Reddy et al., 2010; Reddy et al., 2011; Zhua et al., 2013; Naqid et al., 2016). By high-resolution profiling of an antibody library’s diversity, with sequence and frequency information on virtually all clones during screening process, NGS followed by in-depth analysis has been employed to discover many valuable mAbs not found by ELISA screenings (Ravn et al., 2010; Ravn et al., 2013; Turner et al., 2016). Encouraged by these studies, we aim to use in-depth analysis to systematically identify and characterize enriched long CDR-H3 clones from our previously panned libraries (Nam et al., 2016). In current study, the DNA samples for Illumina sequencing were prepared without PCR by direct ligation to custom-designed sequencing adapters, which avoid introducing amplification bias. After high-throughput sequencing and bioinformatics analysis, the genes of the 29 most abundant Fab clones in the second and the third rounds of panning (R2 and R3) were rescued. Associated Fabs were then produced and tested for affinity, inhibition and selectivity (flowchart shown as Fig. 1). Using this technique, we identified 20 inhibitory Fabs, of which 15 were not found by previous ELISA screening. This study demonstrated that, as a supplement to ELISA, deep sequencing is a very powerful tool to facilitate the systematic discovery of antibodies with protease inhibitory functions.
Figure 1.
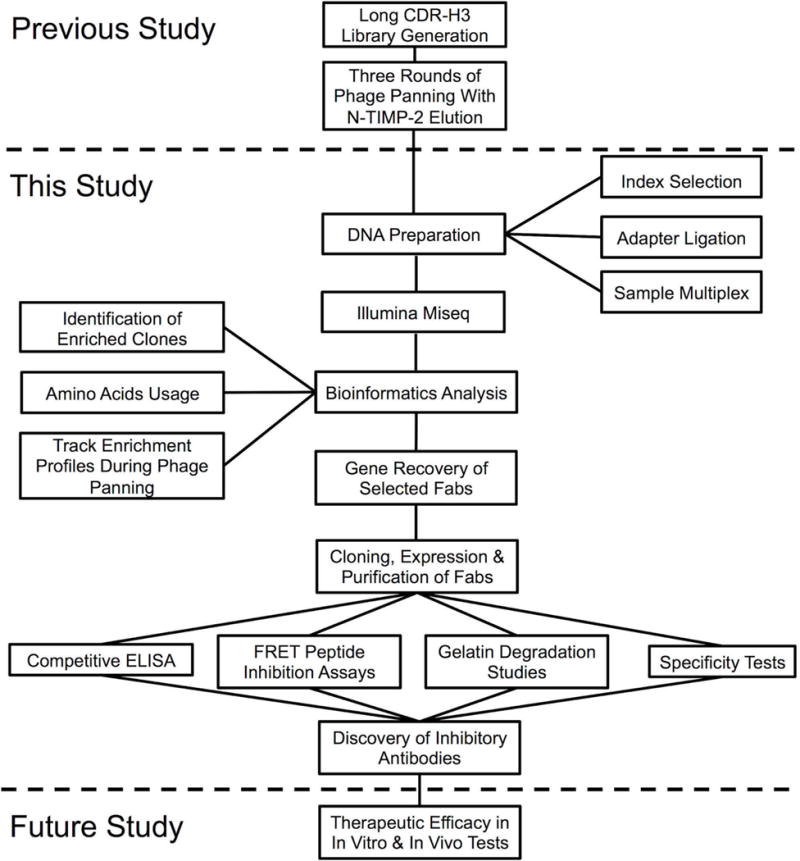
Illumina sequencing and bioinformatics analysis for discovery of inhibitory antibodies. Synthetic antibody libraries carrying long CDR-H3 were constructed and subjected to three rounds of phage panning against cdMMP-14 (previous study, [Nam et al., 2016]). Panned phage libraries were analyzed by deep sequencing to identify Fab clones inhibiting cdMMP-14, and isolated antibodies were characterized biochemically (this study). The therapeutic efficacy of discovered Fabs can be evaluated by vitro and in vivo tests (future study).
Materials and Methods
Preparation of VH library DNA for deep sequencing
Synthetic antibody Fab phage libraries (1.25×10⁹ variants) carrying extended CDR-H3 (23–27 amino acids) were constructed and subjected to three rounds of panning (Nam et al., 2016) against the catalytic domain of MMP-14 (cdMMP-14), which was recombinantly expressed (Nam and Ge, 2015), purified, biotinylated, and immobilized on ELISA plates via biotin-BSA and streptavidin. During phage panning, the native competitive inhibitor of MMP-14, TIMP-2 was applied to elute bound phages. For each round of panning (R1, R2, and R3) as well as the original library (Og), E. coli cells were infected with the eluted phages and cultured 6 hours in 2×YT supplemented with 100 μg/ml ampicillin. The Fab library plasmids were miniprepped, and double digested with DraIII and BseRI, to isolate the fragments encoding VH FR2-CDR2-FR3-CDR3-FR4 (~280 bp) from gel electrophoresis (Zymo Research).
The Illumina sequencing adapters P5 and P7 were customized by introducing a DraIII overhang trinucleotide sequence TGG and a BseRI overhang binucleotide sequence TG at their 5′ and 3′ ends respectively (Fig. S1A). To distinguish DNA samples from various panning rounds, sequencing indexes selected from Illumina’s Nextera Kit were used as the barcodes. To maintain an A+C to G+T ratio of 1:1, I5 indexes [N/S/E]501–504 and I7 indexes N703, N704, N709, and N710 were chosen for library samples Og, R1, R2, and R3 respectively (Fig. S1B). Both strands of modified P5 and P7 adapters containing the selected indexes were synthesized with 5′ phosphorylation (IDT), and annealed by gradient cooling from 95°C to 25°C over 45 minutes in a thermocycler (Bio-Rad) to generate double stranded adapters.
Prepared libraries of VH fragments were directly ligated with assembled P5 and P7 adapters via the sticky ends, a non-PCR approach without the introduction of biases caused by amplification. Specifically, 400 ng of DNA at a 10:1 molar ratio of adapters to VH fragments was mixed in a 50 μL reaction containing 1,000U of T4 DNA ligase (NEB). After incubation at 4°C for 16 hours, unreacted adapters were removed from the ligated products (DNA clean up kit, Zymo Research). The purity and concentrations of adapter ligated VH fragments were determined by spectrophotometry and by RT-qPCR. VH libraries before and after 1, 2, and 3 rounds of panning were multiplexed based on their concentrations to generate a sequencing mixture with a 10:1:1:1 ratio. After multiplexing the quality of the library was checked using an Agilent 2100 Bioanalyzer.
Bioinformatics analysis
The multiplexed library was subjected to NGS using a MiSeq sequencer (Illumina). Deep sequencing data were analyzed using an automatic bioinformatics pipeline, which combines MATLAB, Perl, Excel, GSplit, and the Windows OS. Large raw FASTQ data files were first split into manageable pieces using GSplit. Each piece was then run through MATLAB to extract the DNA sequences and quality scores. The data was then passed to PERL to isolate high quality sequences containing in-frame CDR-H3 regions. The conserved sequences flanking the CDR-H3 were utilized as the searching motifs for identification of CDR-H3 (Reddy et al., 2010). Each clone was ranked and named according to its library and relative abundancy, e.g. clone R2C3 represents the third most abundant clone after two rounds of panning.
Cloning, expression and purification of Fabs
Genes of identified highly abundant Fab clones were PCR amplified from their associated libraries using a universal forward primer recognizing the 5′ of the VL fragment and clone-specific reverse primers matching the unique CDR-H3 sequences. All the primers were designed to have a Tm of 72°C. After initial extraction an extension PCR was performed to amplify and introduce a PpuMI cutting site at the 3′ of the CDR-H3. A Fab phagemid (Farady et al., 2007) was modified to introduce a PpuMI site via a silent mutation immediately downstream of the CDR-H3 region for direct cloning of amplified Fab genes using NsiI/PpuMI restriction sites. Ligated plasmids were cloned into E. coli Jude-I [(DH10B) F′∷Tn10 (Tetr)] cells for sequence confirmation, then transformed into BL21 cells for expression.
Fabs containing a 6×His tag at C-terminal of CH1 were produced by culturing transformed BL21 cells in 2×YT at 30°C for 15 hours. After expression the periplasmic fractions were prepared by osmotic shock with 25% sucrose followed by treatments with lysozyme, EDTA and MgCl2. Samples were centrifuged at 15,000× g for 15 minutes at 4°C to obtain the supernatants containing the Fabs. Periplasmic solutions were then passed through a 0.22 μm filter and purified by using Ni-NTA agarose (Qiagen). Purified Fab samples were buffer exchanged into 50 mM HEPES (pH 7.5) by dialysis at 4°C using SnakeSkin tubing (Fisher), and concentrated by using ultrafiltration centrifugation tubes with MWCO of 10 kDa (Amicon). The purity and concentration of produced Fabs were determined by SDS-PAGE and OD280 absorption measurements.
Antibody characterizations
Dose-dependent ELISA and specificity tests
cdMMP-9, cdMMP-14 and cdMMP-14 mutants were cloned and produced in their active format in periplasmic space of E. coli without refolding or activation (Nam and Ge, 2015). After labeling purified cdMMP-14 using EZ-Link Sulfo-NHS-LC biotinylation kit (Thermo Fisher), biotin-cdMMP-14 was incubated in a streptavidin coated ELISA plate (Thermo Scientific) blocked with biotin-BSA. After washing, 50 μL of 2 μM Fabs were then added to the first well and serially diluted to ~1 nM and incubated for 30 minutes at 4°C. After washing, the ELISA signals were developed by anti-Fab-HRP (Sigma) and TMB (Thermo Scientific). The color development reaction was stopped by addition of H2SO4, and the absorptions at 450 nm were measured. Binding selectivities of Fabs to cdMMP-14 over cdMMP-9 were studied by competitive ELISA. Fabs were incubated with a gradient concentration of cdMMP-9 from 4 μM to 2 nM for 1.5 hours at room temperature. After incubation, samples were transferred to an ELISA plate coated with 100 nM cdMMP-14 and processed as described above. Binding kinetics of isolated Fabs were measured by bio-layer interferometry. Using ForteBio BLItz system, biotinylated cdMMP-14 was loaded onto a streptavidin biosensor for 60 sec to establish baselines. Fabs were introduced at a variety of concentrations and their association to immobilized cdMMP-14 was monitored for 3 min then allowed to dissociate into 50 mM HEPES (pH 6.8) for 10 min. Determined kon and koff parameters were used to calculate KD values.
FRET inhibition assays
The functionality of purified Fabs to inhibit cdMMP-14 activity was tested by FRET assays. Typically, 1 μM of purified Fab was serially 2-fold diluted into assay buffer (50 mM Tris-HCl pH 7.5, 150 mM NaCl, 5 mM CaCl2, 0.5 mM ZnCl2), and incubated with 10 nM cdMMP-14 for 30 min at 4°C. The kinetic measurements were started with the addition of 1 μM M2350 peptide substrate (Bachem) and the fluorescence was monitored with excitation and emission wavelengths at 325 and 392 nm. To determine the type of inhibition Fabs were diluted to concentrations generating 70%, 50%, and 30% inhibition in HEPES assay buffer (50 mM HEPES pH 6.8, 150 mM NaCl, 5 mM CaCl2, 0.5 mM ZnCl2), and incubated with 10 nM cdMMP-14 at 4°C for 30 min. For each Fab concentration, 50 μM to 2 mM FRET peptide substrates were added for kinetics measurements.
Gelatin degradation studies
10 nM cdMMP-14 was incubated with 1 mg/mL gelatin (porcine skin, Sigma) in the absence or presence of 1 μM Fabs for 24 hours at room temperature, then samples were analyzed by 12% SDS-PAGE. A synthetic inhibitor GM6001 and a non-inhibitory Fab R2C17 were used as the positive and negative controls.
Results
Illumina deep sequencing of long CDR-H3 Fab libraries
Human Fab phage display libraries carrying CDR-H3 regions with 23, 25, and 27 aa in length were synthesized and subjected to three rounds of panning (R1, R2 and R3) against catalytic domain of MMP-14 (cdMMP-14) (Nam et al., 2016). For each round, the bound phages were eluted by incubation with n-terminal domain of tissue inhibitors of metalloproteinases (n-TIMP-2), which is a native inhibitor of MMP-14 behaving in a competitive mode (Brew et al., 2000). In principle, only the Fab phages directly interacting with the catalytic portion of MMP-14 or allosterically interfering n-TIMP-2 binding can be eluted off. Therefore, the combination of convex paratope library design with epitope-specific elution presumably results in enrichment of specific inhibitory antibodies. This hypothesis was partially confirmed by the panel of inhibitory Fabs isolated by ELISA screening in our previous study (Nam et al., 2016). Aiming to fully understand the sequence landscape changes during the panning process and to systematically identify and characterize a large number of the most enriched antibody clones, libraries R1, R2, R3 and the original library before panning (Og) were subjected to Illumina NGS (Fig. 1). Briefly, Og, R1, R2, and R3 phagemids were purified, and their fragments encoding CDR-H3s with partial FR3 and FR4 regions were prepared by restriction digestion and direct ligation with custom-designed adapters for Illumina sequencing (Fig. S1). This PCR free procedure should minimize the introduction of amplification bias, which is critical for frequency based antibody discovery (Ravn et al., 2010; Ravn et al., 2013, Reddy et al., 2010; Reddy et al., 2011; Zhua et al., 2013). RT-qPCR analysis showed that the assembled DNA samples had uniform melting temperatures, suggesting high quality and purity. The library DNA concentrations were quantified and the samples were multiplexed at a ratio of 10:1:1:1 (Og:R1:R2:R3) for sequencing. Analysis on an Agilent 2100 bioanalyzer further confirmed that the multiplexed DNA sample displayed sharp peaks associated with designed base pairs, indicating successful ligations with the flow cell adapters at both ends.
Sequencing raw data was de-multiplexed using unique indexes and processed in house to remove truncated and out of frame reads. Sequences either containing reading frame shifts due to sequencing errors or with low quality (quality scores less than 30) were excluded from further analysis. A total of 1.83×10⁶, 1.09×10⁷, 6.67×10⁶, and 2.81×10⁵ functional sequences were obtained for libraries Og, R1, R2, and R3 respectively, which accounted for 56–90% of the raw data (Table 1). Given that the library diversity usually decreased to <105 after the first round of biopanning, the Illumina results provided a considerable coverage and well represented the majority of R1, R2, and R3 library clones. The large diversity of Og (1.25×10⁹) was not covered by NGS, nevertheless >106 reads are adequate to probe the quality of constructed library.
Table 1.
Statistics of deep sequencing results
| Raw Data | In-Frame Full-Length CDR-H3s | In-Frame Full-Length/Raw Data | Unique CDR-H3s | Unique/In-Frame Full-length | Frequency (copy numbers) of the most abundant clone | |
|---|---|---|---|---|---|---|
| Og | 2,039,671 | 1,834,712 | 89.95 % | 1,834,576 | 99.99 % | 0.000 % (2) |
| R1 | 19,488,812 | 10,941,297 | 56.14 % | 10,791,087 | 98.63 % | 0.009 % (981) |
| R2 | 11,761,506 | 6,665,700 | 56.67 % | 6,229,221 | 93.45 % | 0.129 % (8600) |
| R3 | 50,457 | 28,127 | 55.74 % | 19,906 | 70.77 % | 1.888 % (531) |
Long CDR-H3s enriched with hydrophilic and positively charged residues after panning on cdMMP-14
As the most important region of antigen binding, CDR-H3s were focused for bioinformatics analysis (Fig. 1). Their sequences were recognized by using the signature motifs flanking N- and C-termini of CDR-H3s (Ravn et al., 2010; Reddy et al., 2010). Analysis results indicated that the original library as expected, contained an even distribution of CDR-H3s with 23, 25, or 27 aa (30–37% each). Interestingly, after phage panning more than half of Fabs (58%) had 25 aa in their CDR-H3s, and the proportions of CDR-H3s with 23 or 27 aa decreased to 7 and 19% (Fig. 2A). Taking 25 aa CDR-H3s as an example, at each position of 92–100K, the Og library showed uniform usage of 20 amino acids (Fig. S2), indicating constructed synthetic antibody libraries had high quality and well represented the diversity designs. During panning process, CDR-H3 amino acid usage distributions altered dramatically (Fig. S2). Particularly, the average number of positively charged residues (Arg/His/Lys) steadily increased from 2.8 aa per CDR-H3 in Og to 3.3 in R1, 3.6 in R2, and finally 4.9 in R3 (Fig. 2B). This suggests the panning process enriched positively charged paratopes, which probably enhances interactions with the negatively charged MMP-14 catalytic cleft vicinity (Fernandez-Catalan et al., 1998). The usages of amino acids grouped according to physicochemical properties were further analyzed at individual residue positions of CDR-H3s. Results for CDR-H3s with 25 aa are shown in Fig. 2C, in which changes of 20% and more from Og to R3 are highlighted. Positively charged residues were enriched at positions 94, 99, 100, and 100C; proportions of negatively charged residues (Asp/Glu) increased at position 100I; polar residues (Ser/Thr/Asn/Gln) presented more at positions 92, 96, 97 and 100B; and hydrophobic residues (Ala/Ile/Leu/Met/Phe/Trp/Tyr/Val) presented less at position 96, 97, 99, 100C, 100D, 100I, and 100K. Overall, the increase of charged and hydrophilic residues with decrease of hydrophobic residues presumably improves Fab solubility, a phenomenon well documented in literature (Nieba et al., 1997; Lawrence et al., 2007; Chiti et al., 2003).
Figure 2.
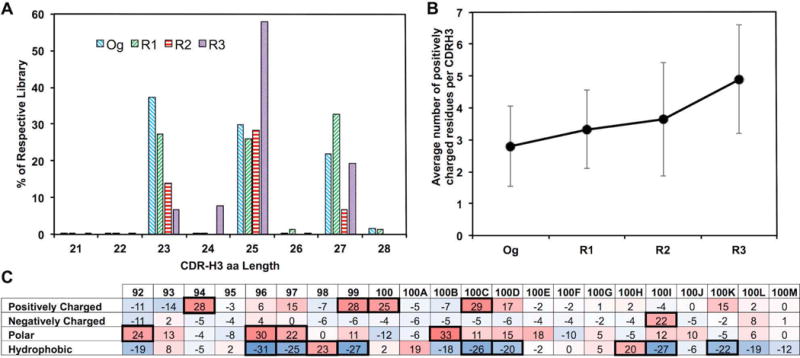
Antibody repertoire analysis of phage panned long CDR-H3 libraries. (A) CDR-H3 length distribution. (B) Enrichment of positively charged residues (R, H, K) at CDR-H3. (C) Amino acid composition changes at each position (92–100M) of CDR-H3 with 25 aa. Residues were grouped according to biochemical properties: positively charged (R, H, K), negatively charged (D, E), polar (S, T, N, Q), and hydrophobic (A, I, L, M, F, W, Y, V). The percentage changes from the library Og to R3 are listed, positions with >20% change were highlighted in bold boxes.
Identification of highly abundant Fab clones and tracking their enrichment profiles
After bioinformatics analysis of the entire libraries in general, individual Fab clones with the highest abundancies were identified for further studies. Limited by Illumina reading length capacity, the most diverse regions, CDR-H3s were chosen as the signature sequences to represent the associated Fabs in analysis, and the full VH and VL sequences of particular clones of interest were later recovered by PCR using specific primers. For libraries Og, R1, R2 and R3, a total of 1.83×10⁶, 1.08×10⁷, 6.23×10⁶, 1.99×10⁴ different CDR-H3s were found (unique CDR-H3s, Table 1). The ratios between numbers of unique CDR-H3s over numbers of all in-frame full-length CDR-H3s in the associated library are 99.99% for Og, 96.63% for R1, 93.45% for R2 and 70.77% for R3. The copy numbers of each unique CDR-H3 sequences within R1, R2 and R3 were then counted, and their abundancies were calculated by dividing their copy numbers with the total number of functional CDR-H3s in that library (Table 1). Results demonstrated that the most abundant clones in R1, R2, and R3 had frequencies of 0.009%, 0.129%, and 1.889% respectively, reflecting the quick enrichment progress during panning as expected. Because R1 enrichment was pre-mature, only R2 and R3 were used for Fab identification in the following analysis.
Due to the synthetic nature and relatively small dataset (1.83×10⁶) of Og library compared to constructed diversity (1.25×10⁹), majority of clones in Og presumably should have a single copy number. Our results indeed indicated that 99.99% of Og CDR-H3s had a single copy, < 0.01% CDR-H3s have two copies and there are no clones with more than two copies (Table 1), suggesting each clone in Og has a low and even frequency. Consequently, the enrichment of a given clone in R1, R2 or R3 over Og can be directly reflected by their frequencies in the associated library, therefore, the clones with the highest abundancies are the most enriched clones. The 22 most abundant clones in R2 were identified with frequencies ranging from 0.13% to 0.02% (named as R2C1-R2C22 with their CDR-H3 sequences shown in Table 2). None of these 22 clones were detected in Og (zero copies). In R1, the majority of these 22 clones had zero copies and only R2C3 and R2C19 had one copy.
Table 2.
In depth analysis of highly enriched clones from R2 and R3
| ID by NGS1 | Sequence (CDR-H3 length) | % of R2 | % of R3 | Rank in R3 | Binding Affinity2 | Inhibition potency | Yield (mg/L) |
|---|---|---|---|---|---|---|---|
| R2C1* | STAATTLSRMSRSYWTIQLPYGMDY (25) | 0.13 | 1.89 | 1 | 590 nM | Non-Inhibitory | 1 |
| R2C2* | GVRGNKLRLLSSRSGLMESHYVMDY (25) | 0.12 | 1.66 | 2 | 1.0 μM | 2.3 μM | 2 |
| R2C3* | PTTSRVNKKLFRVSVLHPGSYGMDY (25) | 0.11 | 0.61 | 4 | 220 nM | 4.6 μM | 1 |
| R2C4 | GWRVYADRGHVRGYFRVWYGMDY (23) | 0.10 | 0.53 | 3 | 10 μM** | 1.5 μM | 2 |
| R2C5 | IMKIKRNSLKFRGFVPLQMQYVMDY (25) | 0.09 | 0.14 | 14 | 375 nM** | 50 nM | 3.5 |
| R2C6 | KDLLKTNRLTTRYKKSVSVGYGMDY (25) | 0.07 | 0.53 | 5 | 2.4 μM | 2.4 μM | 1 |
| R2C7 | SCVWACCACRYWSGSDSHYAMDY (23) | 0.06 | 0.01 | ~12500 | 153 nM | 100 nM | 1 |
| R2C8 | PGRHLQTTFKGYQFKYSRYIYAMDY (25) | 0.05 | 0.16 | 12 | 1.2 μM | 1.2 μM | 3.5 |
| R2C9 | VLNIFMDVGAARFPGLVRYGMDY (23) | 0.04 | 0.05 | ~4200 | 657 nM** | 80 nM | 0.75 |
| R2C10 | MAKDFRILASVRMWVLASRLYVMDY (25) | 0.04 | 0.03 | ~8400 | 360 nM | Non-Inhibitory | 0.5 |
| R2C11 | RYGSDVFCVGCFFGVRLSYVMDY (23) | 0.03 | 0.03 | ~9100 | 750 nM | 600 nM | 0.75 |
| R2C12 | SDSWVQGRDFCYYSAWVGYGMDY (23) | 0.03 | 0.05 | ~2600 | 150 nM | 150 nM | 0.5 |
| R2C13* | LYNGWLMVEGIGSAREGPTWYAMDY (25) | 0.03 | 0.09 | 21 | 34 nM | 970 nM | < 0.01 |
| R2C14 | VSNRYNRSSASIAGLQLFRPYGMDY (25) | 0.03 | 0.05 | ~2600 | 1.2 μM** | 10 nM | 0.5 |
| R2C15* | SVHMKLSNKILSGWSWNNSFYAMDY (25) | 0.03 | 0.07 | 28 | 460 nM | 3.9 μM | 2 |
| R2C16 | FKNADFAAGGQWSKMLIARMYAMDY (25) | 0.03 | 0.10 | 17 | 1.8 μM | 5.5 μM | 2.4 |
| R2C17 | VGAWRVPSERMFTYPSARTRYAMDY (25) | 0.03 | 0.02 | ~11000 | 2.1 μM | Non-Inhibitory | 0.4 |
| R2C18 | RDFGGFAGCLDGYVHVCWYAMDY (23) | 0.02 | <0.01 | ~13000 | 430 nM | Non-Inhibitory | 0.5 |
| R2C19* | LDRDRYIHVGRAGNTYSNYYYVMDY (25) | 0.03 | 0.17 | 11 | 9.7 nM | Non-Inhibitory | 0.5 |
| R2C20* | NFRVESAGRPGKTVLRKDGKYAMDY (25) | 0.03 | 0.47 | 6 | 1.6 μM | Non-Inhibitory | 0.5 |
| R2C21 | LAWKSDNRGSFAKLQFTLKMYGMDY (25) | 0.02 | 0.08 | 25 | Non-Binding** | 50 nM | 0.25 |
| R2C22 | HSRDGWQHWFGNWAGLHSYGMDY (23) | 0.02 | <0.01 | ~13000 | 540 nM** | 75 nM | 0.15 |
| R3C7* | EIHMLSRQARYLRDGRRPRGSMYVMDY (27) | 0.01 | 0.33 | 7 | 29 nM | Non-Inhibitory | 2 |
| R3C8 | HCLLRSRRCEMSTKTRELNVYRYAMDY (27) | 0.01 | 0.30 | 8 | 1.3 μM | 5.4 μM | 1 |
| R3C9* | VKLQKDKSHQWIRNLVATPYGRYVMDY (27) | 0.01 | 0.29 | 9 | 3.8 nM | 9.7 nM | 1 |
| R3C10 | GSLRRDFNLVVRSSWDIRSNYVMDY (25) | <0.01 | 0.20 | 10 | 970 nM | 1.0 μM | 2 |
| R3C13 | WLRVSLKSGVYKVLARAVELDEYVMDY (27) | 0.01 | 0.14 | 13 | 2.0 μM | 2.0 μM | 3 |
| R3C15 | GVRGNKLRLLSSRSGRMESHYVMDY (25) | <0.01 | 0.14 | 15 | 57.5 nM | 170 nM | 4 |
| R3C16 | MASIDLRMLSRMLAGPQFKVYGMDY (25) | 0.01 | 0.11 | 16 | Non-Binding** | 1.0 μM | 1 |
Notes:
Clones were identified and ranked by their abundancies. Previously discovered Fabs by monoclonal phage ELISA are labeled as *.
Fab genes were rescued by PCR and sub-cloned for expression. Purified Fabs were tested for binding affinity (by ELISA EC50) and inhibition potency (by FRET IC50). Fabs with EC50 > 2×IC50 are labeled as **.
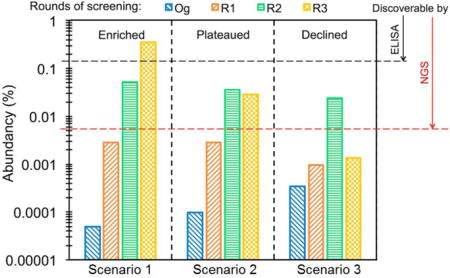
Notably, the ranks and abundancies of these 22 clones in R2 were not always correlated with these in R3. More specifically, 15 clones such as R2C3, R2C4, and R2C6 exhibited further enrichments, i.e. a higher abundancy in R3 than R2. Because of this enrichment pattern, 7 of the 22 most abundant clones were discovered using traditional ELISA screening (Table 2, Table S1) (Nam et al., 2016). Clones R2C9, R2C10, and R2C17 displayed increased frequencies from Og to R1 and to R2, however their frequencies in R3 were similar to R2. These plateaus can be attributed to the balance between enrichment driven by panning and the depletion caused by slow cell growth. Interestingly, several top ranked clones in R2 such as R2C7, R2C18, and R2C22 showed declined frequencies in R3. As a consequence, these particular clones were not identified in ELISA screenings of R3 library, because of their low frequencies in R3 (<0.01% with rankings >10,000, Table 2).
Applying similar analysis, the 17 most abundant clones from R3 were also identified with frequencies ranging from 1.89% to 0.11%. For these 17 clones, 7 were not among the top 22 clones of R2. These 7 clones were named as R3Cx, in which x is the rank of that clone in R3. All R3Cx clones were undetected in Og or R1, had relatively low frequencies in R2 (<0.01%), and quickly enriched in R3 (0.33–0.11%).
Gene rescue and protein production for abundant Fabs
Fab genes of these 29 top ranked clones (22 from R2 and 7 from R3) were specifically amplified from their respective libraries by PCR using a universal forward primer recognizing N-terminal of the VL and a clone specific reverse primer recognizing unique CDR-H3s. After secondary extension PCR to introduce a restriction site at the C-terminal of VH, the VL-CL-VH fragments were sub-cloned into a Fab expression plasmid. Successful gene extraction and cloning were confirmed by Sanger sequencing. The Fabs were produced in the periplasmic space of E. coli with typical 0.5–2.0 mg purified proteins per liter of culture medium (Table 2), yields sufficient for initial biochemistry characterizations. Most top ranked clones exhibited relatively high expression levels compared to the lower ranked clones, suggesting expression level is an important factor affecting enrichment progress during phage panning. Purified Fabs remained stable and functional at room temperature for at least 24 hours.
Discovery of a panel of inhibitory Fabs with high selectivity
The binding affinities of purified Fabs were measured by ELISA and results indicated that majority of highly abundant clones (27/29) exhibited binding specificity to cdMMP-14 with EC50 values ranging from 4 nM to 3 μM (Table 2, Fig. 3). Among them, eight Fabs R2C1, R2C3, R2C12, R2C13, R2C19, R3C7, R3C9, R3C15 had relatively high affinities at 4–150 nM; five Fabs R2C5, R2C7, R2C10, R2C15, and R2C18 exhibited moderate affinities at 150–500 nM; and 14 other Fabs showed weak binding with EC50 values at 0.5–3 μM. Given these Fabs were isolated from synthetic phage libraries, a broad range of affinities was expected.
Figure 3.
Fab binding affinities measured by ELISA. ELISA studies were performed by reacting purified Fabs with immobilized cdMMP-14 followed by tagging with anti-Fab-HRP. Color was then developed by the addition of TMB and read on a spectrophotometer. A range of binding strengths from 4 nM to 10 μM was found, which is expected from a synthetic antibody library.
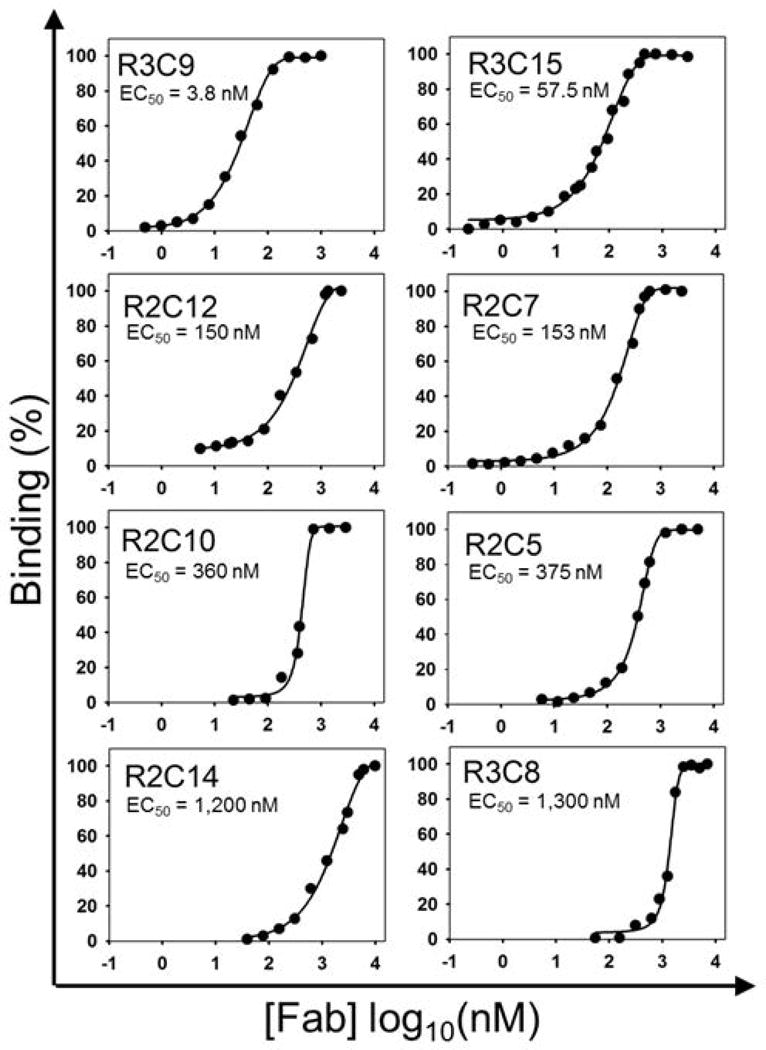
More importantly, inhibition functions of the purified Fabs on cdMMP-14 were examined using a FRET peptide substrate to derive IC50 curves (Fig. 4). Of the 29 highly abundant Fab clones identified from R2 and R3, 20 exhibited inhibition with IC50 values ranging from 10 nM to 4 μM (Table 2). Particularly, R2C14 and R3C9 had an inhibition potency of 10 nM; eight Fabs R2C5, R2C7, R2C9, R2C12, R2C13, R2C21, R2C22 and R3C15 exhibited inhibition potencies at 50–200 nM; and 10 other Fabs had weak inhibition with IC50 600 nM – 4 μM.
Figure 4.
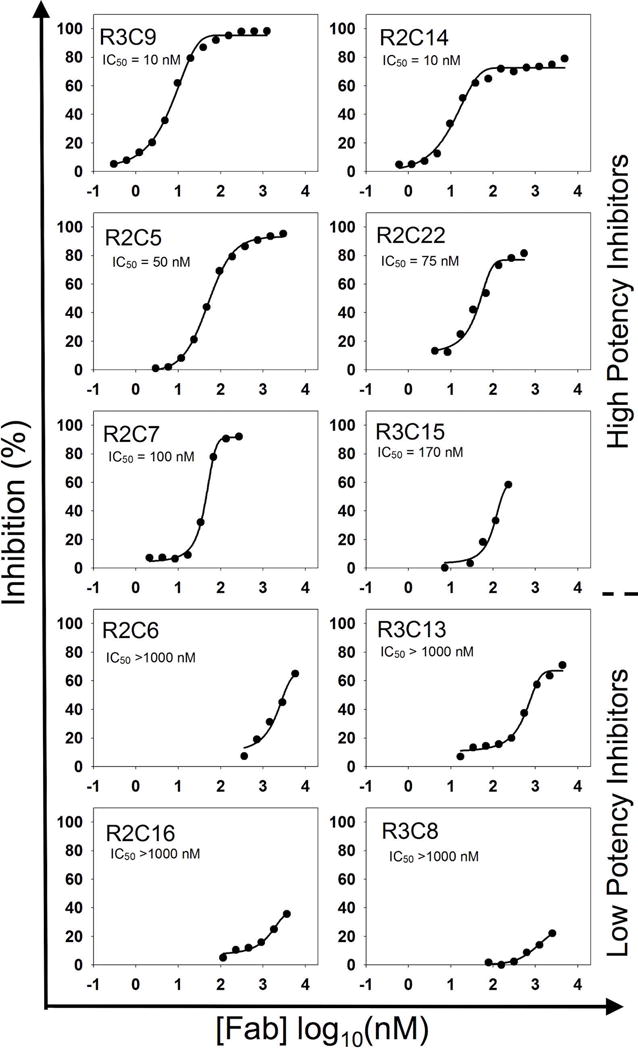
Potencies of inhibitory Fabs by FRET assays. FRET assays were performed by reacting the purified Fabs with cdMMP-14 for 30 min then adding FRET peptide substrate. The increase in fluorescence was monitored for 1 hour to determine inhibitory function. A variety of inhibitory clones with potencies ranging from 10 nM to 8.0 μM was found.
Three Fabs R2C5, R2C7, and R2C14 of high and moderate inhibition potencies (10–100 nM) but not found by ELISA screening in previous study were further characterized for their binding selectivity to cdMMP-14 over highly homologous cdMMP-9. Tests were performed by incubating Fabs at their IC50 concentrations with varying concentrations of cdMMP-9 or cdMMP-14 then adding to an ELISA plate coated with streptavidin and biotinylated cdMMP-14. Fabs R2C5, R2C7 and R2C14 bound to cdMMP-14 on the plate even with high concentrations of cdMMP-9 in solution, indicating no interactions with cdMMP-9 (Fig. 5). While in control experiments, the amounts of Fabs binding to immobolized cdMMP-14 responded to concentrations of cdMMP-14 in solution as expected. Therefore, Fabs R2C5, R2C7 and R2C14 exhibited high selectivity to cdMMP-14. A further zymography test of Fab R2C7 also demonstrated that it inhibited cdMMP-14 from degrading gelatin (Fig. S3).
Figure 5.
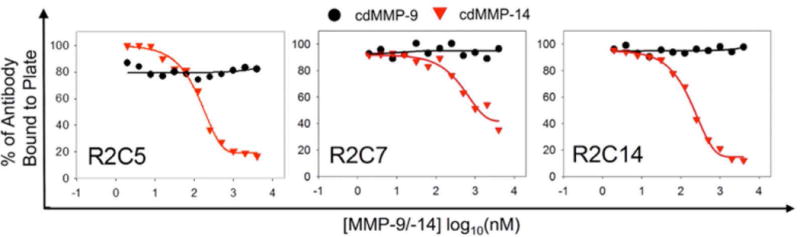
Specificity tests by competitive ELISA. Fabs at their respective IC50 concentrations were incubated with varying concentrations of cdMMP-9 or cdMMP-14 then added to ELISA plates coated with 100 nM cdMMP-14. Fabs bound to the cdMMP-14 on plates, even at high concentrations of cdMMP-9, indicating there are no interactions between Fabs and cdMMP-9. As the control experiments, when incubating with cdMMP-14 in solution, Fabs transferred from the plate to the solution as the concentration of cdMMP-14 in solution increased.
Inhibition Mechanism of R2C7
To determine the type of inhibition, a series of enzymatic activity assays in the presence of 0, 150, and 300 nM Fab R2C7 were performed. The obtained Lineweaver-Burk plots demonstrate an unchanged turnover rate (Vmax) and an increased Michaelis constant (Km) when Fab concentration was raised, indicating a competitive inhibition mode (Fig. 6A). Competitive ELISA with increased concentrations of n-TIMP-2 resulted in decreased amounts of Fab R2C7 bound to immobilized cdMMP-14 (Fig. 6B), suggesting that R2C7 and n-TIMP-2 directly competed on binding to cdMMP-14, and presumably their epitopes were at least partially overlapping. As the control experiments, when incubating with cdMMP-14 in solution, Fabs transferred from the solution to the plate as the concentration of cdMMP-14 in solution decreased to ~10 nM.
Figure 6.
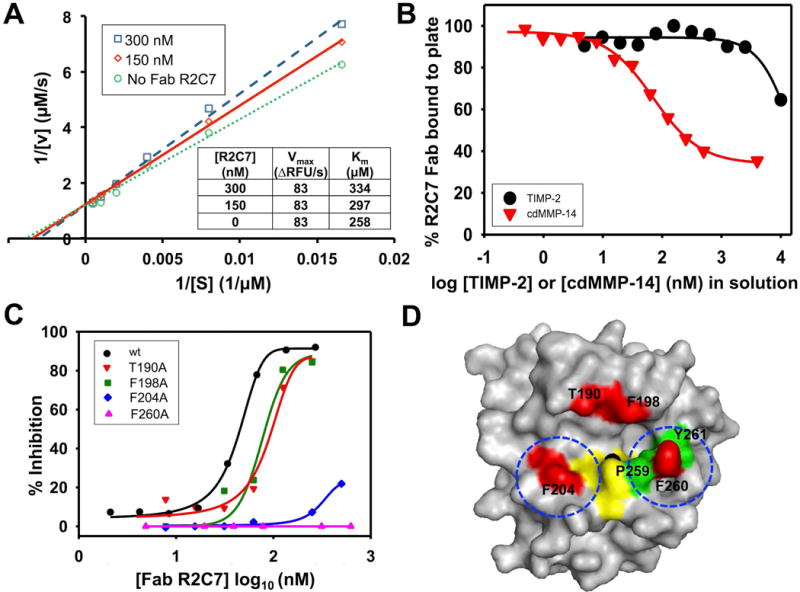
Inhibition mechanism of R2C7. (A) Lineweaver-Burke plots of cdMMP-14 at the presence of 0,150, 300 nM Fab R2C7. Unaltered Vmax and increased Km with increasing Fab concentrations indicate a competitive inhibition mode of R2C7. (B) Competitive ELISA with TIMP-2. Fab R2C7 was mixed with varying concentrations of TIMP-2 in solution before addition to an ELISA plate coated with 100 nM cdMMP-14, and the signals were developed by using anti-Fab-HRP and the associated substrate. (C) R2C7 epitope mapping by inhibition assays. Four positions T190, F198, F204, and F260 surrounding the catalytic cleft of cdMMP-14 were chosen for alanine mutagenesis. Compared to wt cdMMP-14, F260A and F204A cannot be inhibited by Fab R2C7. (D) R2C7 epitope image generated using PyMOL based on MMP-14 crystal structure (PDB 1bqq), showing the catalytic zinc (solid black), site-directed mutagenesis positions (red), the three histidine residues of the catalytic motif HEXXHXXGXXH (yellow), and the residues forming the wall of S1′ cleft (green, except F260 which is also a mutation site thus in red). Determined locations of R2C7 binding are circled.
To further determine whether R2C7 is a direct or allosteric competitive inhibitor, binding site of Fab R2C7 was studied by alanine scanning mutagenesis of MMP-14. Four residue positions around reaction pocket of cdMMP-14 (T190A, F198A, F204A, and F260A) were selected for Ala substitution, and these cdMMP-14 mutants were prepared by periplasmic expression without refolding (Nam and Ge, 2015). Inhibition assays with FRET peptide substrate indicated that R2C7 lost its inhibition ability toward cdMMP-14 mutants F204A and F260A, while keeping the same level of inhibition potency toward T190A and F198A as wild type cdMMP-14 (Fig. 6C). Notably, F204 and F260 are responsible for the formation of a relatively deep S1′ site of MMP-14 among MMP family (Chiti et al., 2003, Nagase, 2001), suggesting R2C7 binds to the reaction pocket vicinity of cdMMP-14 directly (Fig. 6D).
Discussion
Next generation high-throughput sequencing is a powerful tool for analyzing rounds of selected libraries, which led to the identification of unique inhibitory antibodies in current study. In conjugation with convex paratope antibody library design, an n-TIMP-2 elution method was used during the phage panning process to enrich the libraries in competitive inhibitory clones. Traditional ELISA screenings were performed on the third round panned library by randomly picking individual colonies. This method resulted in the discovery of some of the most abundant clones in R3, as well as a few random clones that were not necessarily abundant but nonetheless picked (Table S1). However, some clones enriched in R2 but declined in R3 will likely be missed in ELISA screening. For example, the seventh most abundant clone in R2, R2C7 is ranked ~12500 in R3 with a frequency of 0.01%. Clones such as R2C7 (with an inhibition potency of 100 nM), are valuable candidates for further development but are depleted in continual rounds of panning. Applying ELISA on R2 is not realistic either, because even the most enriched clones in R2 had a frequency of ~1/1000. By NGS, laborious ELISA screenings is avoided and all enriched clones with their abundancies above the background can be identified and tracked along rounds of the panning process. Using this approach, many specific clones with high inhibition potencies, such as R2C7, R2C9, R2C12, and R2C22, were newly discovered. In fact, 15 of 20 identified inhibitory Fabs were not found by ELISA, demonstrating the power of NGS.
Because only a trace fraction of Og was sequenced, all of the 29 highly abundant clones identified from R2 and R3 have zero copies in Og. Therefore their frequencies in R2 and R3 can be directly used to reflect their enrichment over Og. By tracking their frequencies during phage panning process, we found three patterns – rise, plateau, and decline (TOC). The observed different enrichment and depletion patterns occur because phage panning is a multi-step process involving cell growth, Fab expression and display, and competitive binding. Suboptimal conditions at any of these steps can result in a decrease of abundancy. For example, an individual clone that grows slowly will be overtaken and gradually phased out by its faster growing competitors. This effect has nothing to do with the strength of the antibody, however it will still result in the stagnation or depletion of the clone relative to the total library in subsequent rounds of panning. Another major concern during the phage ELISA selection process is low expression levels of antibody molecules. A clone that binds strongly, but does not express well may not have a high enough signal to be selected; this results in the loss of the clone. Finally, individual clones will compete for binding sites on the bound MMP-14. This results in the loss of weaker binding yet potentially inhibitory clones.
The 20 MMP-14 binding Fabs identified by ELISA in previous study were also tracked to monitor their enrichment profiles. As results shown in Table S1, 9 of the 20 clones were among the most abundant 29 clones identified by NGS. The remaining 11 clones have frequencies less than 0.01% in R2 and less than 0.05% in R3, thus were not picked by frequency-based NGS and bioinformatics. To better understand the Fab populations isolated by ELISA, or NGS, or both methods, the correlations between binding affinity (ELISA EC50) and inhibition potency (FRET assay IC50) of each Fabs were plotted. As shown in Fig. 7, most of the Fabs generated by ELISA screening have their EC50s less than their IC50s, whereas a few inhibitory Fabs identified by NGS, e.g. R2C5 and R2C14, exhibited higher affinity EC50 values than inhibition IC50 values. A likely explanation of this phenomenon is that these Fabs are suicide inhibitors [Farady et al., 2007], which are slowly cleaved by high concentrations of cdMMP-14 after incubation for hours (SDS-PAGE results shown in Fig. S4). To further characterize these selected Fabs, their binding kinetics kon and koff parameters were measured by bio-layer interferometry. Data indicated that Fabs R2C5, R2C7 and R2C14 had calculated KD values of 15.3, 27.0, and 6.1 nM (Fig. S5), which were less than their inhibition IC50s (50, 100, and 10 nM respectively). Collectively these results suggest that the low apparent binding affinities measured by ELISA were attributed to slow cleavage of Fabs by immobilized cdMMP-14 on ELISA plates, while the quick and real-time analysis by bio-layer interferometry can measure the binding kinetics before significant cleavage taken place. Guided by the knowledge of theoretical cut sites of MMP-14, e.g. usually containing a positively charged residue at the P4 position and a hydrophobic residue at the P1′ position [Kridel et al., 2002], studies on site-specific mutagenesis are currently undertaken to engineer cleavage resistant Fabs.
Figure 7.
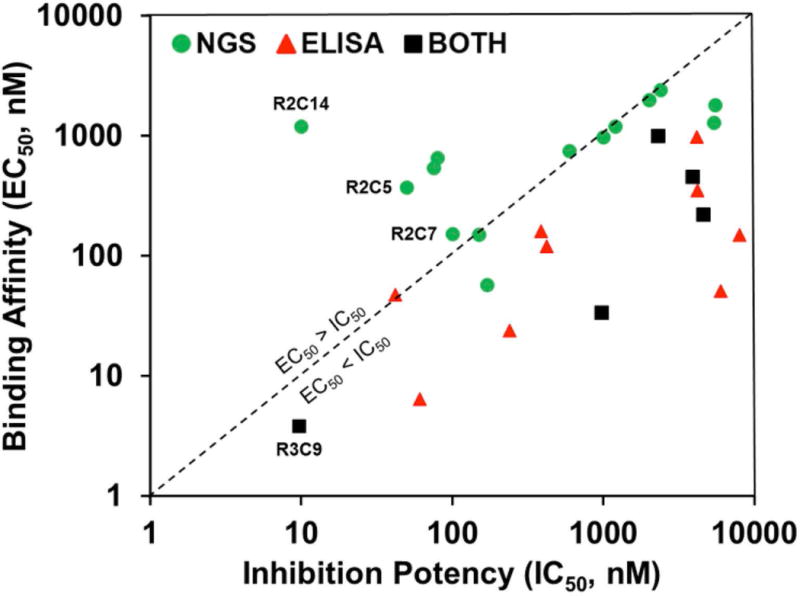
Relationship between binding affinity and inhibition potency. The clones found by NGS (green circles), phage ELISA (red triangles), or both methods (black squares) are compared. The diagonal dashed line represents equal EC50 and IC50 values.
Avoiding sequencing artifacts is critical for the success of frequency-based antibody discovery. PCR often introduces bias due to the differential amplification of some DNA templates over others. In this study, sequencing adapters were custom-designed for direct ligation with antibody CDR-H3 fragments prepared by phagemid extraction and restriction digestion. This procedure without amplification presumably minimized quantification biases caused by PCR.
In conclusion, combination of the convex paratope antibody library design with next-generation deep sequencing of panned libraries allowed us to identify a panel of highly potent and highly selective Fabs inhibiting cdMMP-14 not found by ELISA. Particularly, Fab R2C7 exhibited 100 nM inhibition potency by binding to the catalytic cleft vicinity of cdMMP-14. In addition to R2C7, several potent inhibitory Fabs e.g. R2C5 and R2C14, with IC50 values at 10–50 nM with excellent selectivity were also isolated. And Fabs R2C5, R2C9, R2C12, R3C15 were found to be competitive inhibitors as well. This panel of inhibitory Fabs provides us a rich pool of lead candidates for further selection of suitable epitopes for therapeutics and optimization of pharmacological properties through affinity maturation and solubility/stability improvement. Besides MMP-14, several other MMP family members have been recognized playing important roles in variety of indications, therefore the methodology demonstrated in the current study can be readily applied for the generation of highly potent inhibitory mAbs targeting other MMPs or serine proteases (Farady et al., 2007; Schneider et al., 2012) of physiological significance. These highly selective inhibitors can also been used as research tools for better understanding of the not well-defined network of MMPs with their substrates.
Supplementary Material
Acknowledgments
This work was supported by National Science Foundation the Faculty Early Career Development (CAREER) Program 1453645, National Institutes of Health Grant R01GM115672, California Breast Cancer Research Program Developmental and Exploratory Award (IDEA) 21IB-0104, and Department of Education Graduate Assistance in Areas of National Need (GAANN) P200A130127. We would like to thank Dr. John Weger at UCR Genomics Center for help with Illumina sequencing adapter designs. We would also like to acknowledge the contributions of undergraduate researchers Chris Benitez, Henry Pham, Aaron Ramirez, and Ramon Sanchez.
References
- Ager EI, Kozin SV, Kirkpatrick ND, Seano G, Kodack DP, Askoxylakis V, Huang Y, Goel S, Snuderl M, Muzikansky A, Finkelstein DM, Dransfield DT, Devy L, Boucher Y, Fukumura D, Jain RK. Blockade of MMP14 activity in murine breast carcinomas: implications for macrophages, vessels, and radiotherapy. J Natl Cancer Inst. 2015;107(4) doi: 10.1093/jnci/djv017. [DOI] [PMC free article] [PubMed] [Google Scholar]
- Baciu PC, Suleiman EA, Deryugina EI, Strongin AY. Membrane type-1 matrix metalloproteinase (MT1-MMP) processing of pro-αv integrin regulates cross-talk between αvβ3 and α2β1 integrins in breast carcinoma cells. Experimental Cell Research. 2003;291:167–175. doi: 10.1016/s0014-4827(03)00387-2. [DOI] [PubMed] [Google Scholar]
- Bonvin P, Venet S, Kosco-Vilbois M, Fischer N. Purpose-Oriented Antibody Libraries Incorporating Tailored CDR3 Sequences. Antibodies. 2015;4:103–122. [Google Scholar]
- Brew K, Dinakarpandian D, Nagase H. Tissue Inhibitors of Metalloproteinases: Evolution, Structure and Function. Biochim Biophys Acta. 2000;1477:1–2. 267–283. doi: 10.1016/s0167-4838(99)00279-4. [DOI] [PubMed] [Google Scholar]
- Chiti F, Stefani M, Taddei N, Ramponi G, Dobson CM. Rationalization of the effects of mutations on peptide and protein aggregation rates. Nature. 2003;424:805–808. doi: 10.1038/nature01891. [DOI] [PubMed] [Google Scholar]
- De Genst E, Silence K, Decanniere K, Conrath K, Loris R, Kinne J, Muyldermans S, Wyns L. Molecular basis for the preferential cleft recognition by dromedary heavy-chain antibodies. Proc Natl Acad Sci U S A. 2006;103:4586–4591. doi: 10.1073/pnas.0505379103. [DOI] [PMC free article] [PubMed] [Google Scholar]
- Decock J, Thirkettle S, Wagstaff L, Edwards DR. Matrix metalloproteinases: protective roles in cancer. J Cell Mol Med. 2011;15:1254–1260. doi: 10.1111/j.1582-4934.2011.01302.x. [DOI] [PMC free article] [PubMed] [Google Scholar]
- Deryugina EI, Ratnikov B, Monosov E, Postnova TI, DiScipio R, Smith JW, Strongin AY. MT1-MMP Initiates Activation of pro-MMP-2 and Integrin αvβ3 Promotes Maturation of MMP-2 in Breast Carcinoma Cells. Experimental Cell Research. 2001;263:209–223. doi: 10.1006/excr.2000.5118. [DOI] [PubMed] [Google Scholar]
- Desmyter A, Transue TR, Ghahroudi MA, Thi MH, Poortmans F, Hamers R, Muyldermans S, Wyns L. Crystal structure of a camel single-domain VH antibody fragment in complex with lysozyme. Nat Struct Biol. 1996;3:803–811. doi: 10.1038/nsb0996-803. [DOI] [PubMed] [Google Scholar]
- Devy L, Huang L, Naa L, Yanamandra N, Pieters H, Frans N, Chang E, Tao Q, Vanhove M, Lejeune A, van Gool R, Sexton DJ, Kuang G, Rank D, Hogan S, Pazmany C, Ma YL, Schoonbroodt S, Nixon AE, Ladner RC, Hoet R, Henderikx P, Tenhoor C, Rabbani SA, Valentino ML, Wood CR, Dransfield DT. Selective inhibition of matrix metalloproteinase-14 blocks tumor growth, invasion, and angiogenesis. Cancer Res. 2009;69:1517–1526. doi: 10.1158/0008-5472.CAN-08-3255. [DOI] [PubMed] [Google Scholar]
- Egeblad M, Werb Z. New functions for the matrix metalloproteinases in cancer progression. Nat Rev Cancer. 2002;2:161–174. doi: 10.1038/nrc745. [DOI] [PubMed] [Google Scholar]
- Farady CJ, Sun J, Darragh MR, Miller SM, Craik CS. The mechanism of inhibition of antibody-based inhibitors of membrane-type serine protease 1 (MT-SP1) J Mol Biol. 2007;369(4):1041–1051. doi: 10.1016/j.jmb.2007.03.078. [DOI] [PMC free article] [PubMed] [Google Scholar]
- Fernandez-Catalan C, Bode W, Huber R, Turk D, Calvete JJ, Lichte A, Tschesche H, Maskos K. Crystal structure of the complex formed by the membrane type 1-matrix metalloproteinase with the tissue inhibitor of metalloproteinases-2, the soluble progelatinase A receptor. EMBO J. 1998;17(17):5238–5248. doi: 10.1093/emboj/17.17.5238. [DOI] [PMC free article] [PubMed] [Google Scholar]
- Forsman AMM. PhD thesis. University College London; 2008. Characterization of llama antibody fragments able to act as HIV-1 entry inhibitors. [Google Scholar]
- Georgiou G, Ippolito GC, Beausang J, Busse CE, Wardemann H, Quake SR. The promise and challenge of high-throughput sequencing of the antibody repertoire. Nat Biotechnol. 2014;32:158–168. doi: 10.1038/nbt.2782. [DOI] [PMC free article] [PubMed] [Google Scholar]
- Gingras D, Bousquet-Gagnon N, Langlois S, Lachambre M, Annabi B, Beliveau R. Activation of the extracellular signal-regulated protein kinase (ERK) cascade by membrane-type-1 matrix metalloproteinase (MT1-MMP) FEBS. 2001;507:231–236. doi: 10.1016/s0014-5793(01)02985-4. [DOI] [PubMed] [Google Scholar]
- Golubkov VS, Chekanov AV, Doxsey SJ, Strongin AY. Centrosomal Pericentrin Is a Direct Cleavage Target of Membrane Type-1 Matrix Metalloproteinase in Humans but Not in Mice. J Biol Chem. 2005;280:42237–42241. doi: 10.1074/jbc.M510139200. [DOI] [PubMed] [Google Scholar]
- Kajita M, Itoh Y, Chiba T, Mori H, Kinoh AO, Seiki M. Membrane-type 1 Matrix Metalloproteinase Cleaves CD44 and Promotes Cell Migration. J Cell Biol. 2001;153:893–904. doi: 10.1083/jcb.153.5.893. [DOI] [PMC free article] [PubMed] [Google Scholar]
- Kessenbrock K, Plaks V, Werb Z. Matrix metalloproteinases: regulators of the tumor microenvironment. Cell. 2010;141(1):52–67. doi: 10.1016/j.cell.2010.03.015. [DOI] [PMC free article] [PubMed] [Google Scholar]
- Kridel SJ, Sawai H, Ratnikov BI, Chen EI, Li W, Godzik A, Strongin AY, Smith JW. A Unique Substrate Binding Mode Discriminates Membrane Type-1 Matrix Metalloproteinase from Other Matrix Metalloproteinases. J Biol Chem. 2002;26:23788–23793. doi: 10.1074/jbc.M111574200. [DOI] [PubMed] [Google Scholar]
- Lauwereys M, Ghahroudi MA, Desmyter A, Kinne J, Hölzer W, De Genst E, Wyns L, Muyldermans S. Potent enzyme inhibitors derived from dromedary heavy-chain antibodies. EMBO J. 1998;17(13):3512–3520. doi: 10.1093/emboj/17.13.3512. [DOI] [PMC free article] [PubMed] [Google Scholar]
- Lawrence MS, Phillips KJ, Liu DR. Supercharging Proteins Can Impart Unusual Resilience. J Am Chem Soc. 2007;129:10110–10112. doi: 10.1021/ja071641y. [DOI] [PMC free article] [PubMed] [Google Scholar]
- Margulies M, Egholm M, Altman WE, Attiya S, Bader JS, Bemben LA, Berka J, Braverman MS, Chen YJ, Chen Z, Dewell SB, Du L, Fierro JM, et al. Genome sequencing in microfabricated high-density picolitre reactors. Nature. 2005;437:376–380. doi: 10.1038/nature03959. [DOI] [PMC free article] [PubMed] [Google Scholar]
- Metzker ML. Applications of next-generation sequencing technologies - the next generation. Nat Rev Genetics. 2010;11:31–46. doi: 10.1038/nrg2626. [DOI] [PubMed] [Google Scholar]
- Nagase H. Substrate Specificity of MMPs Cancer Drug Discovery and Development. In: Clendeninn NJ, Appelt K, editors. Matrix Metalloproteinase Inhibitors in Cancer Therapy. Springer; 2001. pp. 39–66. [Google Scholar]
- Nam D, Ge X. Direct production of functional matrix metalloproteinase-14 without refolding or activation and its application for in vitro inhibition assays. Biotechnol Bioeng. 2015;113(4):717–723. doi: 10.1002/bit.25840. [DOI] [PubMed] [Google Scholar]
- Nam DH, Rodriguez C, Remacle AG, Strongin AY, Ge X. Active-site MMP-selective antibody inhibitors discovered from convex paratope synthetic libraries. Proc Natl Acad Sci USA. 2016;113(52):14970–14975. doi: 10.1073/pnas.1609375114. [DOI] [PMC free article] [PubMed] [Google Scholar]
- Naqid IA, Owen JP, Maddison BC, Spiliotopoulos A, Emes RD, Warry A, Tchórzewska MA, Martelli F, Gosling RJ, Davies RH, Ragione RM, Gough KC. Mapping polyclonal antibody responses to bacterial infection using next generation phage display. Scientific Reports. 2016;6:24232. doi: 10.1038/srep24232. [DOI] [PMC free article] [PubMed] [Google Scholar]
- Nieba L, Honegger A, Krebber C, Plückthun A. Disrupting the hydrophobic patches at the antibody variable/constant domain interface: improved in vivo folding and physical characterization of an engineered scFv fragment. Protein Eng. 1997;10(4):435–44. doi: 10.1093/protein/10.4.435. [DOI] [PubMed] [Google Scholar]
- Overall CM, Kleifeld O. Validating matrix metalloproteinases as drug targets and anti-targets for cancer therapy. Nat Rev Cancer. 2006;6:227–239. doi: 10.1038/nrc1821. [DOI] [PubMed] [Google Scholar]
- Pushkarev D, Neff NF, Quake SR. Single-molecule sequencing of an individual human genome. Nat Biotechnol. 2009;27:847–850. doi: 10.1038/nbt.1561. [DOI] [PMC free article] [PubMed] [Google Scholar]
- Ravn U, Didelot G, Venet S, Ng KT, Gueneau F, Rousseau F, Calloud S, Kosco-Vilbois M, Fischer N. Deep sequencing of phage display libraries to support antibody discovery. Methods. 2013;60(1):99–110. doi: 10.1016/j.ymeth.2013.03.001. [DOI] [PubMed] [Google Scholar]
- Ravn U, Gueneau F, Baerlocher L, Osteras M, Desmurs M, Malinge P, Magistrelli G, Farinelli L, Kosco-Vilbois MH, Fischer N. By-passing in vitro screening-next generation sequencing technologies applied to antibody display and in silico candidate selection. Nucleic Acids Research. 2010;38:e193. doi: 10.1093/nar/gkq789. [DOI] [PMC free article] [PubMed] [Google Scholar]
- Reddy ST, Ge X, Boutz D, Ellington AD, Marcotte EM, Georgiou G. (WO2011146514; US20110312505; EP2572203; CA2799746; CN201180035306).Rapid Isolation of Monoclonal Antibodies from Animals. 2011 [Google Scholar]
- Reddy ST, Ge X, Miklos AE, Hughes RA, Kang SH, Hoi KH, Chrysostomou C, Hunicke-Smith SP, Iverson BL, Tucker PW, Ellington AD, Georgiou G. Monoclonal Antibodies Isolated Without Screening by Analyzing the Variable-Gene Repertoire of Plasma Cells. Nat Biotechnol. 2010;28(9):965–969. doi: 10.1038/nbt.1673. [DOI] [PubMed] [Google Scholar]
- Schneider EL, Lee MS, Baharuddin A, Goetz DH, Farady CJ, Ward M, Wang CI, Craik CS. A reverse binding motif that contributes to specific protease inhibition by antibodies. J Mol Biol. 2012;415:699–715. doi: 10.1016/j.jmb.2011.11.036. [DOI] [PMC free article] [PubMed] [Google Scholar]
- Sela-Passwell N, Kikkeri R, Dym O, Rozenberg H, Margalit R, Arad-Yellin R, Eisenstein M, Brenner O, Shoham T, Danon T, Shanzer A, Sagi I. Antibodies targeting the catalytic zinc complex of activated matrix metalloproteinases show therapeutic potential. Nat Med. 2011;18:143–147. doi: 10.1038/nm.2582. [DOI] [PubMed] [Google Scholar]
- Smith AJ. New Horizons in Therapeutic Antibody Discovery: Opportunities and Challenges versus Small-Molecule Therapeutics. Journal of Biomolecular Screening. 2015;20(4):437–453. doi: 10.1177/1087057114562544. [DOI] [PubMed] [Google Scholar]
- Spinelli S, Frenken L, Bourgeois D, Ron L, Bos W, Verrips T, Anguille C, Cambillau C, Tegoni M. The crystal structure of a llama heavy chain variable domain. Nat Struct Biol. 1996;3:752–757. doi: 10.1038/nsb0996-752. [DOI] [PubMed] [Google Scholar]
- Turk B. Targeting Proteases: Successes, Failures and Future Prospects. Nat Rev Drug Discov. 2006;5:785–799. doi: 10.1038/nrd2092. [DOI] [PubMed] [Google Scholar]
- Turner KB, Naciri J, Liu JL, Anderson GP, Goldman ER, Zabetakis D. Next-Generation Sequencing of a Single Domain Antibody Repertoire Reveals Quality of Phage Display Selected Candidates. PLoS ONE. 2016;11(2):e0149393. doi: 10.1371/journal.pone.0149393. [DOI] [PMC free article] [PubMed] [Google Scholar]
- Udi Y, Grossman M, Solomonov I, Dym O, Rozenberg H, Moreno V, Cuniasse P, Dive V, Arroyo A, Sagi I. Inhibition Mechanism of Membrane Metalloprotease by an Exosite-Swiveling Conformational Antibody. Structure. 2015;23:104–115. doi: 10.1016/j.str.2014.10.012. [DOI] [PubMed] [Google Scholar]
- Zarrabi K, Dufour A, Li J, Kuscu C, Pulkoski-Gross A, Zhi J, Hu Y, Sampson N, Zucker S, Cao J. Inhibition of Matrix Metalloproteinase 14 (MMP-14)-mediated Cancer Cell Migration. J Biol Chem. 2011;286:33167–33177. doi: 10.1074/jbc.M111.256644. [DOI] [PMC free article] [PubMed] [Google Scholar]
- Zhua J, Ofeka G, Yanga Y, Zhanga B, Loudera MK, Lua G, McKeea K, Panceraa M, Skinnerc J, Zhangd Z, et al. Mining the antibodyome for HIV-1–neutralizing antibodies with next-generation sequencing and phylogenetic pairing of heavy/light chains. Proc Natl Acad Sci U S A. 2013;110(16):6470–6475. doi: 10.1073/pnas.1219320110. [DOI] [PMC free article] [PubMed] [Google Scholar]
- Zucker S, Cao J. Selective matrix metalloproteinase (MMP) inhibitors in cancer therapy: ready for prime time? Cancer Biol Ther. 2009;8:2371–2373. doi: 10.4161/cbt.8.24.10353. [DOI] [PMC free article] [PubMed] [Google Scholar]
Associated Data
This section collects any data citations, data availability statements, or supplementary materials included in this article.