Abstract
For forty years, the existence and possible functional importance of cholesterol dimer formation has been discussed. Due to challenges associated with structural studies of membrane lipids, there has as yet been no direct experimental verification of the existence and relevance of the cholesterol dimer. Building on recent advances in lipid force fields for molecular simulation, in this work the structure and stability of the cholesterol dimer is characterized in POPC bilayers in absence and presence of sphingomyelin. The cholesterol dimer structural ensemble is found to consist of sub-states that reflect, but also differ from, previously proposed dimer structures. While face-to-face dimer structures predominate, no evidence is found for the existence of tail-to-tail dimers in POPC lipid bilayers. Near stoichiometric complex formation of cholesterol with sphingomyelin is found to effect cholesterol dimer structure without impacting population. Comparison with NMR-derived order parameters provide validation for the simulation model employed and conclusions drawn related to the structure and stability of cholesterol dimers in multicomponent lipid bilayers.
Keywords: Cholesterol, Sphingomyelin, Lipid Aggregation, Lipid Bilayers, Cholesterol Dimer, Membrane Domain Formation
Graphical Abstract
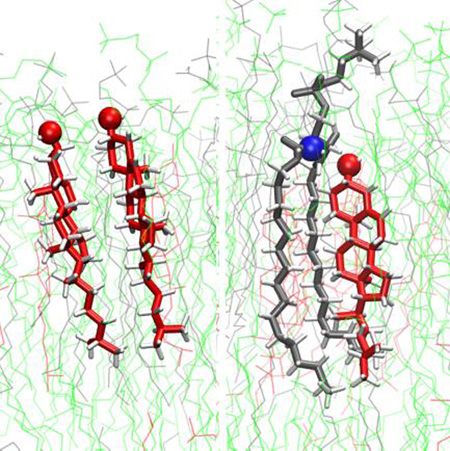
The existence of cholesterol dimers has long been proposed to be important to the function of cholesterol in facilitating membrane domain formation and lipid-protein interaction. Molecular dynamics simulation is used to characterize the structure and stability of the cholesterol dimer, as well as its dependence on membrane lipid composition. The results support the existence of a variety of cholesterol dimer structures, the nature of which may be critical to our understanding of cholesterol's function.
Introduction
Eukaryotic cell membranes, which are primarily composed of lipid bilayers, are complex molecular environments that mediate many biological processes. Cellular lipid bilayers are primarily composed of a matrix of phospholipids, sphingolipids, and sterols. While variations are observed in the structures of phospholipids and sphingolipids, the chemical structure of cholesterol (CHOL) is constant across eukaryotic cells of different species and serves as the major sterol component in the membrane, making it essential to all animal life.1
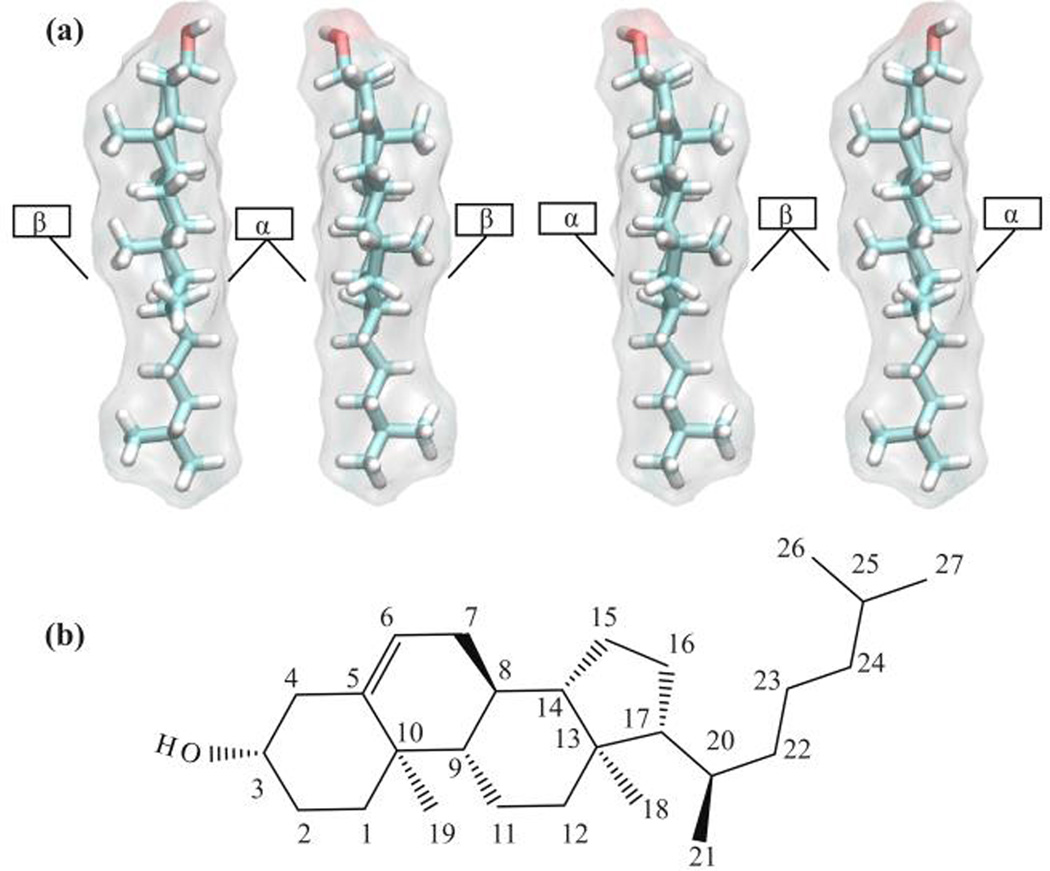
CHOL is a polycyclic and amphiphilic molecule that has a flat asymmetric structure1,2 defined by a planar alpha-face and rough beta-face, named according to the nomenclature of ring compounds (Figure 1).3 A hydroxyl group defines the CHOL “head,” which interacts favorably with extra-membrane water and may participate in hydrogen bonding with membrane lipid or protein.2,4 CHOL is known to influence the rigidity and permeability of the bilayer and is observed to facilitate the formation of ordered phases in the lipid bilayer, including lipid "rafts," via composite interactions between sphingomyelin (SM) and other lipid components.2,5
Figure 1.
(a) Face-to-face CHOL dimer models. α- and β-faces refer to smooth and rough faces of CHOL, respectively. (b) CHOL structure with the standard atom numbering, showing sterol rings, hydroxl group, and branched acyl chain.
The properties of ternary lipid mixtures containing a lipid characterized by low melting temperature (Tc), such as an unsaturated phospholipid, a lipid characterized by high Tc, such as a saturated lipid or sphingomyelin, and CHOL have long been employed as model systems for exploring domain formation in multicomponent lipid bilayers.6,7 In such ternary mixtures, CHOL and high Tc (typically saturated) lipid components may aggregate to form a liquid-ordered (lo) lipid raft-like phase, while low Tc (typically unsaturated) lipid components aggregate to form a liquid-disordered (ld) phase. As dimerization can be viewed as the initial step in any aggregation process, understanding the dynamics of CHOL dimerization is an essential component of our understanding of specific molecular interactions that drive lipid aggregation and domain formation, including the assembly and disassembly of lipid rafts.
Among existing models that describe CHOL dimerization, face-to-face dimerization and tail-to-tail dimerization are most commonly proposed to exist (Figure 1a).2 The face-to-face dimer model can be attributed to Martin and Yeagle8 who hypothesized that CHOL forms stabilizing face-to-face van der Waals contacts, an interpretation that is consistent with X-ray diffraction measurements on lipid-solvated CHOL. Trans-bilayer tail-to-tail dimerization of CHOL has also been hypothesized in order to explain experimental observations of freezing point depression induced by CHOL in short-chain lipid bilayers.9,10 Surprisingly, while reference to cholesterol dimers has been common since the seminal work of Martin and Yeagle, to date there have been no detailed investigation of the molecular structure and stability of the dimer.2
In addition to its established role in bilayer phase separation, CHOL is known to interact with proteins, and a substantial number of protein crystal structures have been isolated with CHOL in the vicinity of the protein surface.2,4 Moreover, experimental studies of the role of membrane in protein aggregation have demonstrated sensitive dependence of protein-membrane interaction on the abundance of CHOL,11,12 and CHOL is suspected to play a crucial role in the genesis of some cardio vascular disorders, lung diseases and diseases that affect brain functions like Parkinson’s and Alzheimer’s diseases.13,14
In recent atomistic simulations of CHOL-containing DMPC lipid bilayers, CHOL monomer orientations were observed to be strongly correlated with sterol composition.15 Binary lipid mixtures of CHOL and DMPC in 1:1 and 1:2 ratios have been studied and CHOL aggregation observed for elevated CHOL concentration.16 Other simulation studies have provided evidence of CHOL aggregation characterized by a three-fold symmetric arrangement apparent in two-dimensional density distributions.17 An additional simulation study, incorporating both artificial CHOL aggregates and randomly distributed CHOL in phospholipid bilayer, noted rapidly varying aggregate sizes and disaggregation of artificial aggregates, providing evidence that large aggregates of CHOL are inherently unstable.18 Scott and coworkers reported atomistic simulations of a nano-scale domain of CHOL and SM embedded in DOPC.19 Formation of CHOL phospholipid domains has also been observed in all-atom simulations by Berkowitz and coworkers.20,21 In addition, spontaneous phase separation and domain formation has been observed in coarse-grained model simulations of lipid bilayers.22,23
These works support the view that CHOL can induce structural order in lipid bilayers. However, to our knowledge large-scale domain formation has not been observed using all-atom simulations and the detailed nature of the structure and stability of CHOL dimers and larger aggregates has not been characterized. As a result, fundamental questions remain regarding the structure, stability, and mechanism of domain formation in multicomponent lipid bilayers, including the role of CHOL aggregation and dimer formation, and the nature of CHOL interactions with sphingolipids.
In this work, near-microsecond molecular dynamics simulations of lipid bilayers, with POPC as the major lipid component and varying levels of CHOL and SM (stearoyl-sphingomyelin), are used to explore the nature of CHOL aggregation, with a particular emphasis on CHOL-CHOL and CHOL-SM dimer formation. The heterogeneity of the CHOL dimer structural ensemble is characterized in terms of structural order parameters derivative of Crick angles used in the characterization of coiled-coil protein structures.37 The stability of CHOL aggregates is defined through nearest neighbor distributions and lifetimes, radial distributions, and potentials of mean force. The nature of CHOL-SM interaction is also characterized. Comparisons with experimentally measured area per lipid and deuterium order parameters are used to validate the simulation models. Overall, this study provides the first detailed characterization of the structure and stability of CHOL-CHOL and CHOL-SM dimers, as well as larger aggregates, providing insight into the role of CHOL-CHOL and CHOL-SM interactions in the cell membrane.
Methods
Molecular Simulation
Lipid bilayers of four compositions were studied in this work (Table 1). The initial lipid configurations were constructed through random lipid placements using the CHARMM-GUI Membrane Builder.24,25 The CHARMM36 all-atom lipid force field26–28 and TIP3P water model29 were used for all simulations. All systems were prepared in rectangular periodic boxes with 22.5 Å water thickness and Na+ and Cl− ions at an approximate concentration of 0.15 M. The membrane normal was defined parallel to the z-axis.
Table 1.
Absolute lipid compositions and lipid ratios of the systems studied.
| System | Symbol | Replicates (R0,R1,R2) |
# Lipids |
Lipid Ratio |
|---|---|---|---|---|
| POPC:CHOL | CHL10 | 3 | 280 | 9:1 |
| POPC:CHOL | CHL20 | 3 | 280 | 8:2 |
| POPC:CHOL:SM | SMCHL10 | 3 | 280 | 8:1:1 |
| POPC:CHOL:SM | SMCHL20 | 3 | 280 | 6:2:2 |
Three replicate simulations (R0, R1 and R2) of each system were initiated from unique randomly distributed bilayer configurations. R0 was simulated for 900 ns and R1 and R2 were simulated for 600 ns.
Statistics were independently computed over the top and bottom leaflets of the symmetric bilayers for the three replicates and averaged. Minimization and equilibration of the systems were carried out according to CHARMM-GUI protocols (see SI). Production run simulations of each replicate were maintained at a temperature of 310 K using the Nose-Hoover thermostat30,31 with coupling time τt of 1.0 ps. Pressure was set to 1 bar using the Parrinello-Rahman barostat with the semi-isotropic coupling scheme and a coupling time τp of 5.0 ps.32 Van der Waals interactions were truncated using a force-switch function from 1.0 nm to 1.2 nm. The Smooth Particle-Mesh Ewald method was used to model long-range interactions with grid spacing of 0.1 nm and a 1.2 nm cutoff.33 MD simulations employed the leap-frog integrator with a time step of 2 fs using a parallelized linear constraint solver to constrain the hydrogen bond lengths.34
GROMACS 5.0 was used for all MD simulation.35–37 GROMACS packages and in house scripts using MDAnalysis38, NumPy and SciPy libraries and VMD39 were used in the data analysis and visualization.
Analysis
Voronoi Tessellations and Nearest Neighbor Distributions
To analyze the lateral structural organization of the lipids within a bilayer leaflet, we performed a tessellation of space into lipid “cells.” To represent the hydrophobic core of the leaflet, in which lipid tail interactions are prominent, the C8 atom of the sterol ring B section of CHOL, C27 and C37 atoms from each tail of POPC, and C10S and C10F atoms in the SM tail were selected. (Figures 1a and S1) The choice of reference atoms was inspired by the work of Engelman and Rothman40 and the nearest neighbor description of CHOL-lipid interactions. Voronoi tessellations have also been successfully utilized in prior works to compute area per lipid in simulated lipid bilayers.19,41 We follow suit by selecting C3 atom in the sterol ring A section of CHOL, P atom in POPC head group, and P atom in SM head group representing the surface of the bilayer for the purpose of computing the area per lipid. (Figures 1a and S1) The coordinates of the selected atoms were projected onto the xy-plane with their periodic images. These coordinates were used to construct the Voronoi polygons using the Quickhull algorithm.42 Nearest neighbor (NN) distributions were computed by identifying the neighbors shared by the edges of Voronoi polygons in the tessellations of the lipid bilayers.
Aggregation and Structural Analysis
To quantify the aggregate size distributions, a single-link hierarchical clustering algorithm43 was applied to the projections of atomic coordinates onto the bilayer plane. The top leaflet and bottom leaflets of each bilayer were separately selected for the aggregate analysis. The projections of CHOL C3 atoms onto the bilayer plane were grouped within a distance threshold of 0.8 nm for aggregates existing 100 ps or longer. The threshold distance is the position of the first minimum of the radial distribution function of CHOL C3 atoms (Figure S2 in SI).
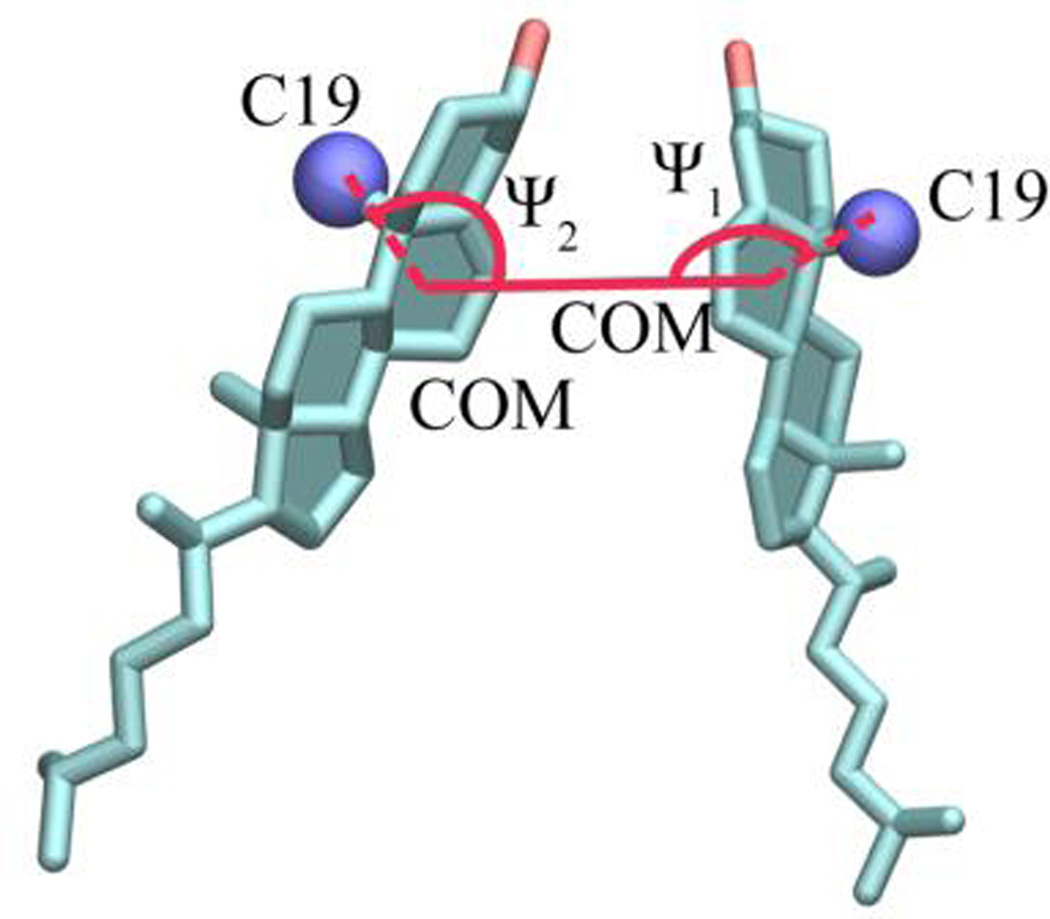
In the evaluation of CHOL dimer structures, we employed an order parameter inspired by Crick angles used in the analysis of coiled-coil protein structures. The sterol ring structure of CHOL provides a convenient reference in the definition of a sterol ring director-vector (Figure 2). The intermolecular displacement vector was defined in terms of the separation of the centers-of-mass of sterol ring B (COM) for the two CHOL molecules. The rotation vector connects C19 of a methyl group on the beta-face of CHOL (closer to the hydroxyl group) and the director vector. For a dimer with components i and j, Crick angles were defined in terms of C19(i) – COM(i) – COM(j) (Ψ1) and C19(j) – COM(j) – COM(i) (Ψ2).
Figure 2.
Definition of generalized Crick angles (Ψ1, Ψ2) as order parameters characterizing the structures of CHOL dimers. C19 atoms (blue) identify the beta-face of CHOL and COM denotes the center of mass of CHOL ring B.
The area per lipid (APL) was derived from the areas of Voronoi polygons associated with lipids and CHOL at the bilayer surface using the shoe-lace algorithm that computes the area of an arbitrary convex polygon.
Dimer Lifetimes
Lifetime distributions for CHOL dimers are computed using tessellation-based nearest neighbor detection. With i and j being components of a dimer, a dissociation event was identified when monomer i left the nearest neighbor set of monomer j. This approach was found to be more robust than a cutoff-dependent definition for dissociation and reformation of dimers.
Uninterrupted hydrogen bond lifetimes were computed using the gmx hbond analysis package in GROMACS with hydrogen-donor-acceptor angle cutoff of 30.0° and donor-acceptor distance cutoff of 0.35 nm.
Dimer Tilt (Θij) and Relative Slide (ΔZij)
The tilt of the cholesterol with respect to the membrane normal was defined as the angle between sterol ring vector and the membrane normal (z-axis).
Dimer tilt (Θij) was defined in terms of the mean tilt angles of the component monomers, Θi and Θj
| (1) |
The displacement of one member of the dimer relative to the other is quantified as the relative slide
| (2) |
where Θij is the tilt angle and Δζij is the z-coordinate displacement of C8 of dimer components i and j,
| (3) |
Lipid Chain Order Parameter (SCH)
An NMR order parameter has been calculated for C-H bonds of CHOL structures in general and dimers and monomers separately using
| (4) |
where is the vector connecting the C-H bond and rnm,z is its z-component. The summation was taken over N frames and M molecules, n being the individual frame index and m the molecular index.
RESULTS AND DISCUSION
We simulated four multicomponent lipid bilayers consisting of varying concentrations of POPC, cholesterol (CHOL), and stearoyl-sphingomyelin (SM) using near-microsecond MD simulations (Table 1 and Methods). The association of CHOL molecules into small aggregates was observed in all systems, demonstrating significant dependence on concentration and bilayer composition.
CHOL Aggregates are Transient and Highly Dynamic
Engelman and Rothman40 investigated the number of hydrocarbon chain NNs of CHOL in binary lipid mixtures using molecular models and wide angle x-ray diffraction, concluding that, for a mixture of 33% CHOL in DPPC, each CHOL should be surrounded by seven lipid tails. In the case of CHOL dimers, Martin and Yeagle8 extended the Engelman and Rothman model to predict the existence of nine NN hydrocarbon chains for the face-to-face CHOL dimer in a DPPC bilayer.
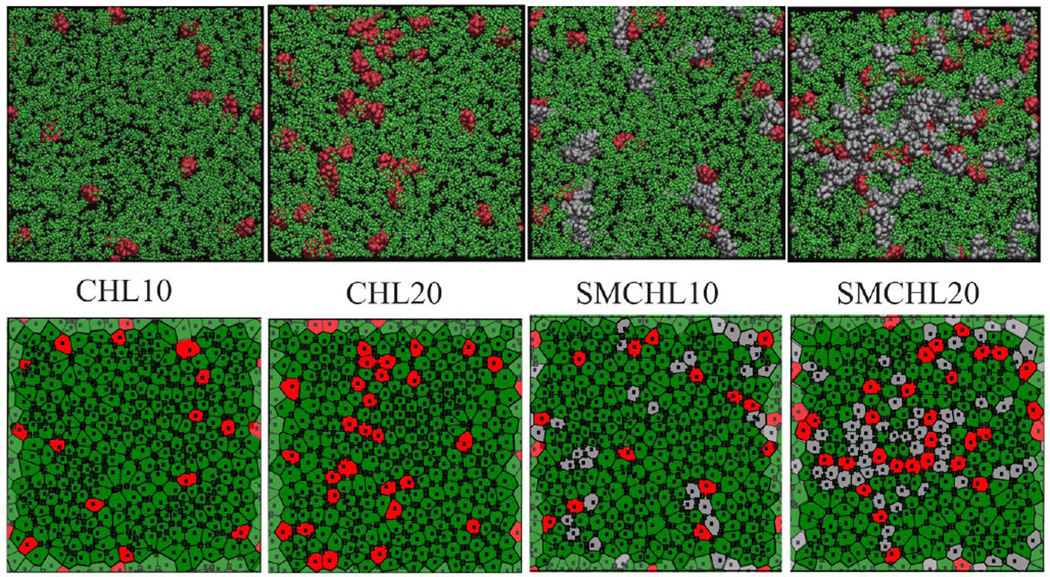
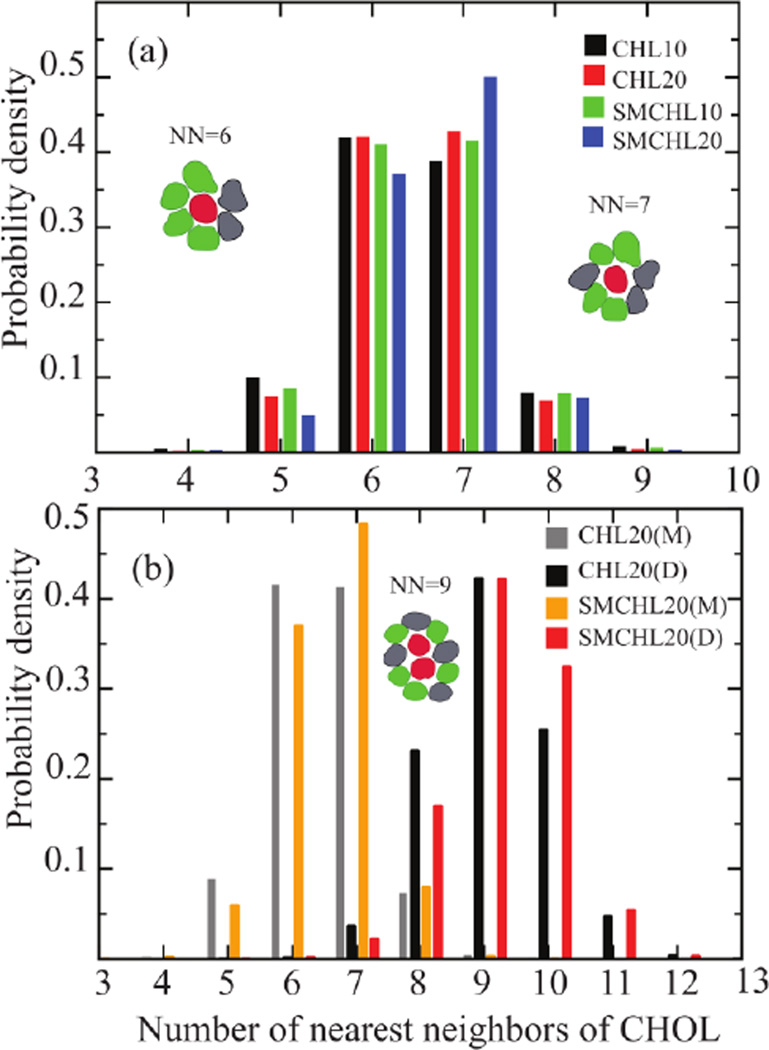
Voronoi tessellations provide an effective means to visual and characterize lipid packing and identify nearest neighbor distributions involving CHOL. CHOL-CHOL contacts and CHOL-SM contacts are strongly evident in the Voronoi representations of the final configurations of the dynamics simulations (Figure 3). The simulated binary and ternary lipid bilayer systems are characterized by NN distributions strongly peaked at six and seven neighbors independent of bilayer composition (Figure 4a). Both POPC and SM have longer carbon tails than DPPC (used in the Engelman and Rothman study). As a result, a smaller number of NN lipid tails can be sufficient to compensate for the hydrophobic mismatch of CHOL. Similarly, we observe NN distributions peaked at nine hydrocarbon chains for the CHOL dimer (see Figure 4b and Table S1 in SI) in agreement with the prediction of Martin and Yaegle.
Figure 3.
Final configurations of four bilayer systems after 900-ns of molecular dynamics (all-atom (top), and corresponding Voronoi representations (bottom), depicting hydrophobic core of the bilayer). POPC (green), CHOL (red), and SM (grey).
Figure 4.
(a) Distribution of the overall number of nearest neighbors of CHOL and (b) distributions of the number of nearest neighbors of CHOL monomers (M) and dimers (D), separately, in four lipid bilayers. Error bars on the distributions are too small to be visible.
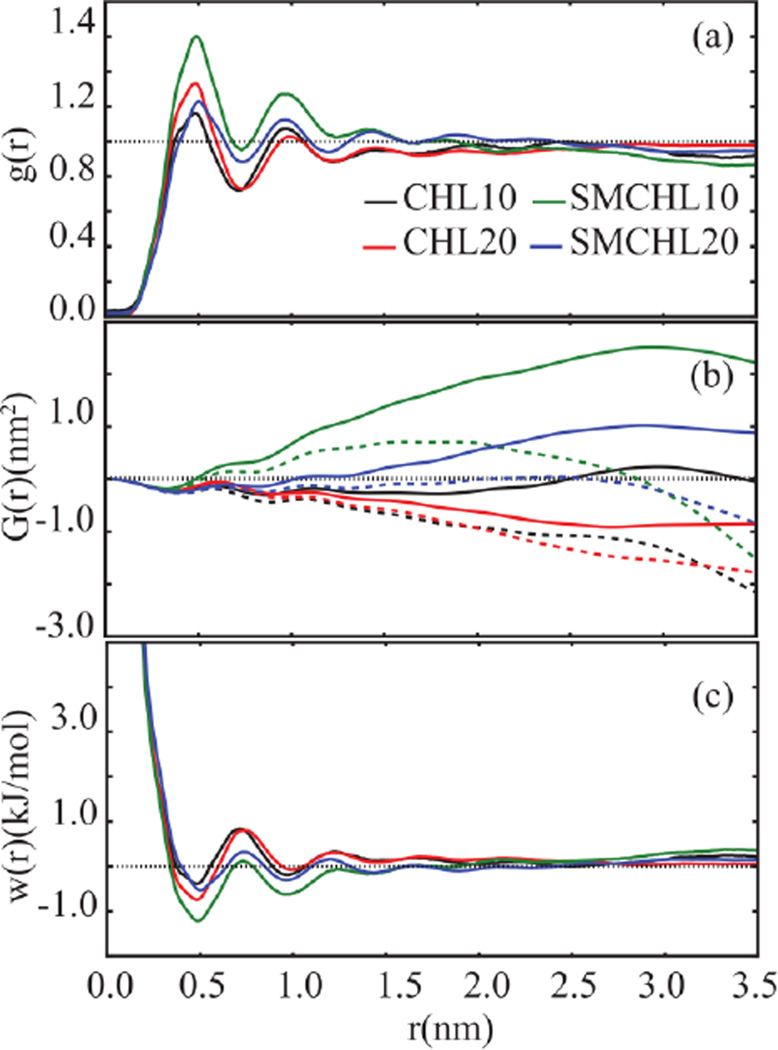
The 2D radial distribution function, g(rxy), of the C3 atom on CHOL (Figures 5a and S2a) shows significant structural order in the first and second solvation shells of CHOL. From the radial distribution functions, Kirkwood Buff integrals (Eq. 5),44 G(rxy), were computed to determine the extent of CHOL aggregation in comparison to a random distribution (Figures 5b and S2b) in two-dimensions.
| (5) |
Figure 5.
(a) 2D radial distribution functions, g(r), of C3 atoms of CHOL. (b) Corresponding Kirkwood-Buff integrals, G(r), with thick (dotted) lines representing corrected (uncorrected) results for the asymptote. (c) Corresponding potential of mean force, w(r), in simulated lipid bilayers. Error bars for computed statistics are shown on Figure S2 in SI.
Corrections were made to account for finite size effects and lack of asymptotic convergence.45 The corrected G(rxy) values converged to a positive value indicating an excess of CHOL in the vicinity of a reference CHOL molecule as compared with a random distribution for SM10 and SM20. In contrast, the CHOL G(rxy) in CHL10 and CHL20 converged to a negative value, indicating the randomness of CHOL aggregations observed in these trajectories. We have also compared the aggregate distributions (see Methods) of the simulated systems to random point distributions (Figure S3a in SI), supporting the conclusion that the numbers of CHOL aggregates in CHL10 and CHL20 systems are comparable to random distributions. Our observations suggest that the driving force characterizing the equilibrium state of CHOL aggregates in dilute systems is translational entropy. It is known that SM-CHOL interactions are more persistent than CHOL-CHOL interactions.1 Consequently, SM in the bilayer environment acts as a ‘linker’ that facilitates transient CHOL interactions and hinders the formation of large CHOL aggregates.
The potentials of mean force, (Eq. 6), w(rxy) characterizing CHOL interactions in the simulated systems were derived from the radial distributions functions as shown in Figures 5c and S2c.
| (6) |
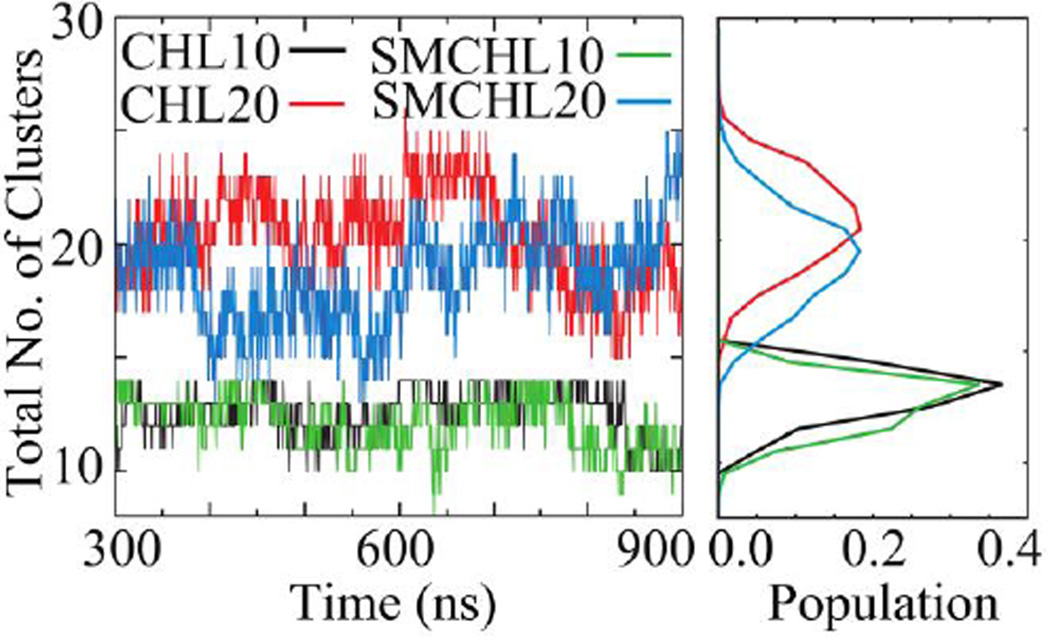
The observed minima are rather shallow, indicative of weak CHOL associations. This is consistent with the rapid fluctuations observed in aggregate counts of all four systems (Figure 6). Similar observations of transient formation of CHOL aggregates have been previously reported.18
Figure 6.
The number of CHOL aggregates over time (left), as a function of CHOL concentration in absence or presence of SM, and corresponding aggregate number distributions (right).
Effects of Sterol Content and SM on CHOL Aggregation
The stability of observed aggregates was quantified using disaggregation constants (see SI). An analogous disaggregation constant for CHOL dimers, Kd (Eq. 1 and 2 in SI), was derived from melting point depression experiments employing differential scanning calorimetry and CHOL concentrations ranging from 0–20% in DPPC.9
In the case of CHOL aggregates, we computed disaggregation constants based on numbers of monomer and aggregated CHOL (Table S2 in SI). These predicted Kdisagr values (Table S2 and Figure S3b in SI) suggest that higher concentrations of CHOL and SM facilitate the aggregation of CHOL. The calculated disaggregation constants were found to be an order of magnitude greater than those derived from melting point depression experiments, raising the question of whether it is justified to use an ideal solution theory for systems involving relatively high CHOL concentrations. Additional experimental measurements of cholesterol aggregate concentration are needed to resolve these discrepancies.
Surprisingly, the presence of SM is found to only modestly impact the CHOL aggregate distribution (Figure S3a) in spite of observed near stoichiometric CHOL-SM hydrogen bonding interaction (Figure S4 and S5 in SI).
CHOL Forms Face-to-Face Dimers in POPC and POPC:SM Bilayers but not Tail-to-Tail Dimers
Although CHOL configurations observed in these simulations are dynamic, we observe that CHOL frequently forms locally ordered dimers. Aforementioned melting point experiments9 hypothesized that CHOL forms only tail-to-tail dimers in DPPC, based on the idea that DPPC encourages trans-bilayer interactions. To test this idea, we have computed the area overlap fraction of CHOL in opposing leaflets, using Monte Carlo integration of overlapping Voronoi polygonal areas of CHOL.
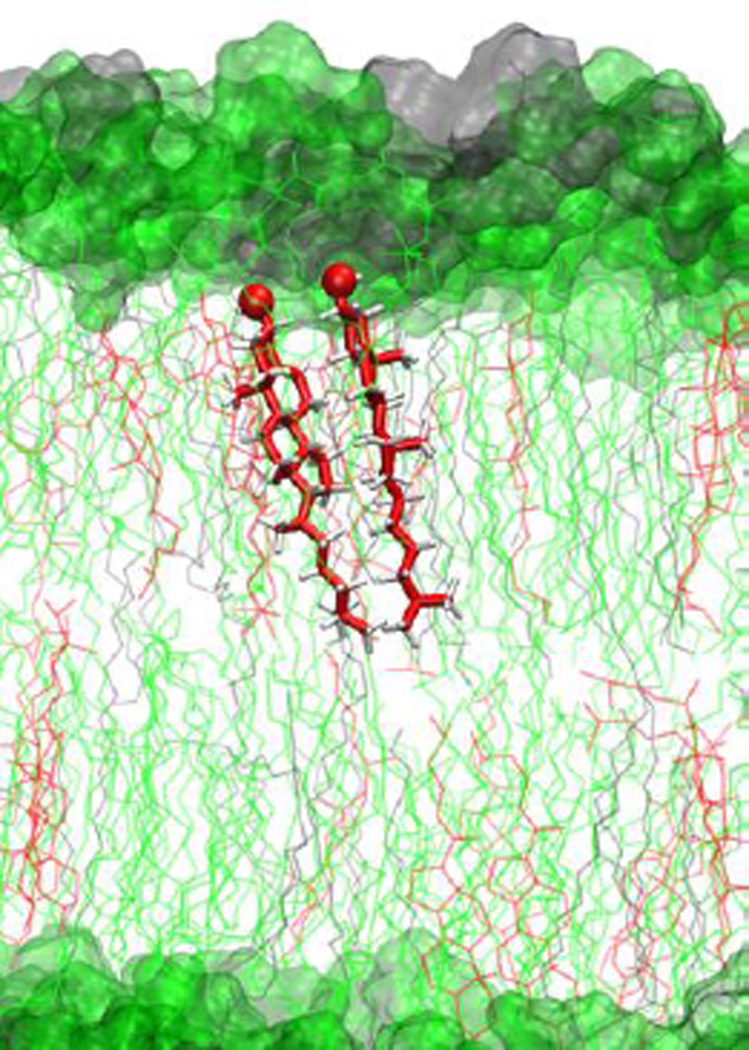
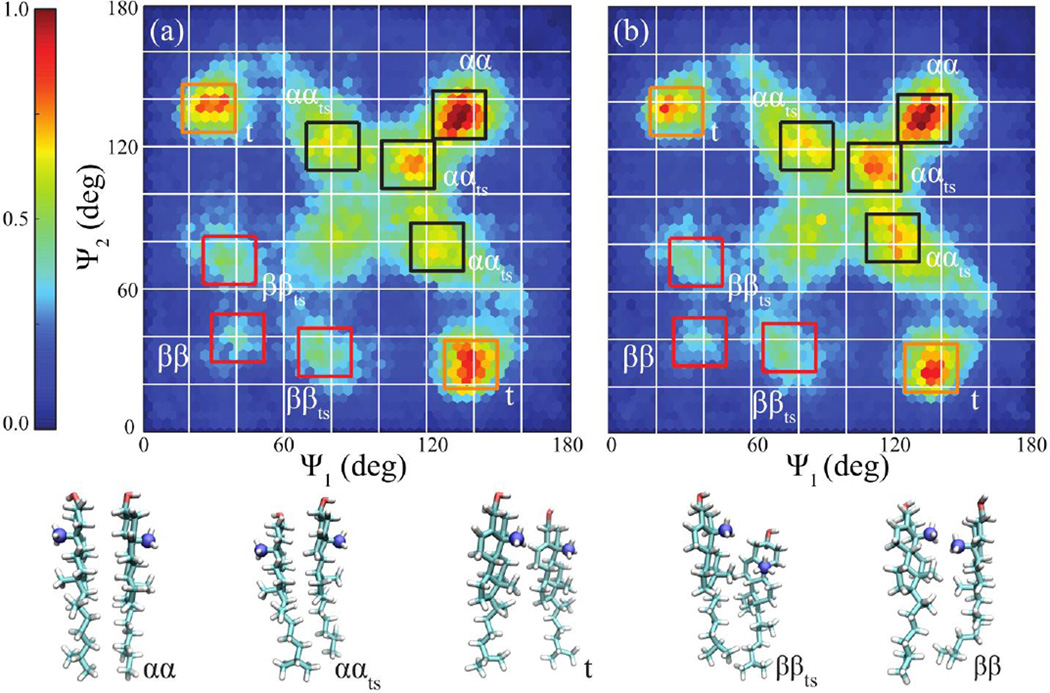
We do not observe any significant trans-bilayer correlation between CHOLs in the simulated systems (Figure S6 in SI). In contrast, we observe the formation of face-to-face CHOL dimers in POPC and POPC:SM bilayers (Figure 7). In order to classify the observed CHOL dimers, we employed generalized Crick angle order parameters characterizing relative CHOL orientations (see Methods).46,47 We identified clusters of CHOL dimer conformations in the (Ψ1, Ψ2) order parameter space and broadly classified the most prominent CHOL dimer conformations in terms of five distinct CHOL dimer sub-states (Figure 8).
Figure 7.
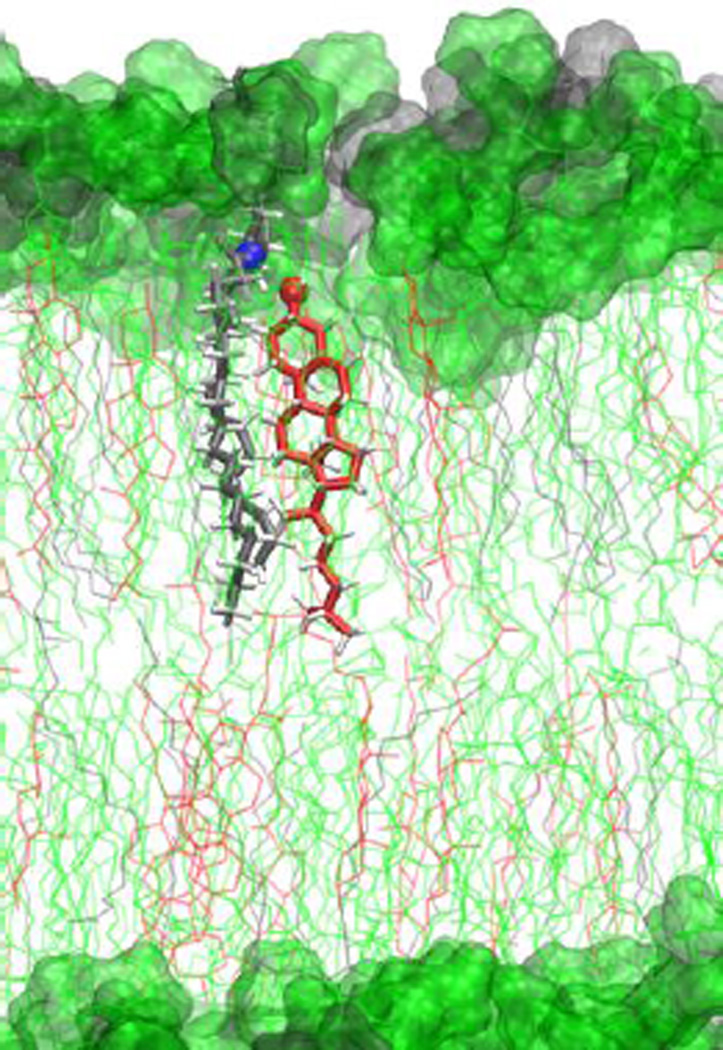
Representative CHOL homodimer structure in a POPC:SM lipid bilayer, with CHOL (red), POPC (green) and SM lipids (grey), showing face-to-face association and tilt relative to the bilayer normal.
Figure 8.
CHOL dimers projected onto the generalized Crick angle order parameter space (Ψ1, Ψ2) for (a) 20% CHOL and (b) 20% CHOL and 20% SM in POPC bilayers (see Methods, Figure 2). The color map defines the population densities and is scaled to the largest values in (a) and (b), respectively. The lower panel shows characteristic homodimer (αα, ααts, t, ββts and ββ) structures. C19 atoms (blue) identify the beta-face of CHOL. Hexabin density plots are used with grid size of 45.
While sparse CHOL dimer populations are observed at lower concentrations (CHL10 and CHLSM10), corresponding (Ψ1, Ψ2) distributions (Figure S7 in SI) are consistent with those observed for more concentrated conditions (Figure 8). The dominant face-to-face conformation is observed with high population in the higher (Ψ1, Ψ2) region (Figure 8). The upper-right corner of (Ψ1, Ψ2), corresponding to perfect alpha-to-alpha dimers, suggests that the actual face-to-face CHOL dimer differs in nature from the idealized flush face-to-face dimer (Figure 8) that is commonly proposed. Instead, the majority of the population consists of dimers in which the CHOL faces are not perfectly aligned. Observed deformations are characterized by “twisting” of the two aligned faces or one monomer “sliding” relative to the other. Such deformed structures are abbreviated "twisted" (t) or "twisted and slid" (ts). Dominant dimer conformations identified, include alpha-face to alpha-face (αα), alpha-face to alpha-face (deformed) (ααts), twisted (t), beta-face to beta-face (deformed) (ββts) and beta-face to beta-face (ββ) (Figure 8).
SM Enhances Formation of CHOL Dimers
On addition of SM, the overall number of CHOL dimers is observed to increase. (Figures 8 and S7). Flexibility in the tilt (Θij) of CHOL dimers with respect to the membrane normal and the relative displacement (ΔZij) of the monomers (see Methods) have also been quantified (Figure S8 in SI). Table 2 lists the averages and the standard deviations of the dimer tilt angle and relative slide distributions. These statistics are block averaged every 60 ns for the top and bottom leaflets of the three replicates. Increasing sterol content is observed to substantially decrease the tilt angle of dimerized CHOL (Figure S8a in SI). Similar observations have been reported for MD simulations of CHOL in a DMPC bilayer (a shorter-chained saturated phospholipid bilayer relative to POPC).15
Table 2.
Average tilt and relative slide of CHOL dimers in lipid bilayers with corresponding standard deviation.
| System | Tilt (deg) | Slide (Å) |
|---|---|---|
| CHL10 | 20.7±1.5 | 1.42±0.085 |
| CHL20 | 18.7±0.68 | 1.39±0.044 |
| SMCHL10 | 19.8±1.2 | 1.41±0.010 |
| SMCHL20 | 16.2±0.87 | 1.38±0.064 |
This shift in tilt angle distribution may be explained by the inverted cone shape of CHOL and the relatively long saturated hydrocarbon tail of SM, which facilitate tight packing in the lipid bilayer.48 We observe that this SM “packing effect” results in a narrow tilt angle distribution (Figure S8a in SI). At higher SM concentration, dimerized CHOL is also observed to be substantially less tilted with respect to the bilayer normal. This can be attributed to attractive interactions between CHOL and the SM head group, which stabilizes a more upright CHOL conformation. In addition, all systems show measurable relative slide of one dimer component with respect to the other (Figure S8b in SI).
Dimerization Induces Structural Order in CHOL
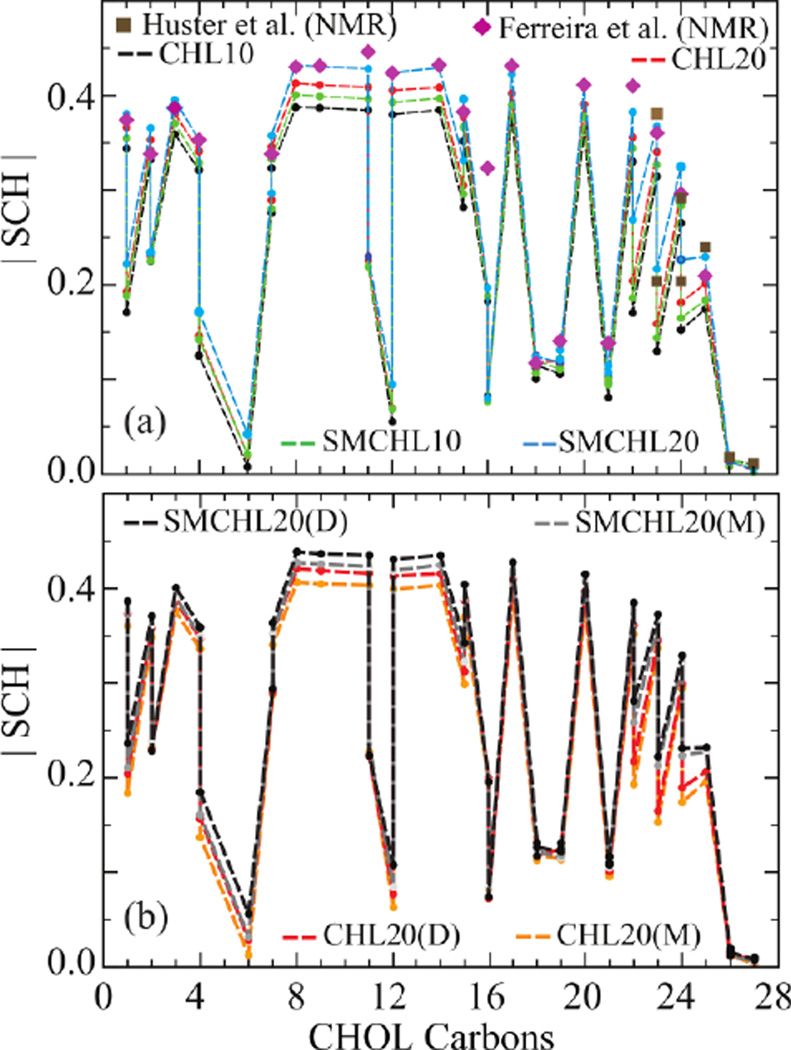
Measures of CHOL dimer tilt angles and relative slide suggest that increased CHOL and SM concentrations induce tighter lipid packing constraints. Tighter packing is expected to induce structural order in CHOL. In order to quantify this effect, we computed the NMR order parameter (SCH) (see Eq. 4 in Methods) for CHOL C-H bonds as a function of increasing CHOL and SM concentrations. The simulation results agree well with experimental solid state NMR order parameters determined for 34% CHOL in POPC49 and CHOL tail NMR order parameters for 25% CHOL in POPC Figure 9a).50 The sterol ring section of CHOL shows slightly more disorder in simulation than experiment. This discrepancy may be due to the relatively low concentration of CHOL present in the simulation model relative to experiment.
Figure 9.
NMR order parameters (SCH) of CHOL C-H bonds computed for (a) overall CHOL (b) CHOL dimers (D) and monomers (M) in four bilayer compositions. Experimentally measured NMR order parameters are shown for comparison (points).49,50 Error bars on SCH values are too small to be visible.
A compound effect of increased SM and CHOL concentration can be seen in SMCHL20, which shows the highest structural order (Figure 9a) of the four bilayers studied. CHOL dimers show relatively high structural order in their sterol ring section, (Figure 9b) which is consistent with our observation of the prominent formation of face-to-face dimers. Further evidence for enhanced packing effects upon increased CHOL and SM concentrations is found in computed area per lipid distributions (Figure S9 in SI).
Higher CHOL concentrations shift the APL distributions of both CHOL and POPC in binary mixtures (Figure S9a in SI). In ternary mixtures, similar shifts in distributions were observed with increasing CHOL and SM concentrations (Figure S9b in SI). Averages of the area per lipid and experimental average APL values corresponding to the simulated CHOL concentrations are included in Table S3 in SI.
Dimer Lifetimes are Independent of CHOL and SM concentration
Interestingly, while computed disaggregation constants and structural order parameters suggest that higher CHOL and SM concentrations increase the stability of the CHOL dimer, average dimer lifetimes are found to be independent of CHOL and SM concentrations. Voronoi tessellations of the lipid bilayers were used to perform dimer lifetime analysis (see Methods). Average lifetimes were found to be on the order of hundreds of picoseconds. A majority of the detected dimers dissociate rapidly (see the lifetime distributions in Figure S10 in SI). However, very stable dimers lasting tens of nanoseconds were observed and were most prominent at higher CHOL and SM concentrations (Table 3).
Table 3.
Average (with standard deviation) and maximum lifetimes of CHOL dimers.
| System | Average Dimer Lifetime (ns) |
Maximum Dimer Lifetime (ns) |
|---|---|---|
| CHL10 | 0.35±0.041 | 15.60 |
| CHL20 | 0.37±0.029 | 33.00 |
| SMCHL10 | 0.36±0.051 | 15.70 |
| SMCHL20 | 0.37±0.038 | 32.30 |
CHOL Forms Persistent Hydrogen Bonds with SM
There is substantial support from experimental and computational studies for the importance of hydrogen bonding interaction between CHOL and SM.1,19,51,52 In an impressive recent study, Yagi et al. demonstrated the persistency and versatility of hydrogen bonding formation in SM clusters through the interpretation of amide vibrational bands for an SM bilayer.53
In line with past observations, we observe stable CHOL-SM heterodimers in ternary lipid mixtures (Figure 10). The “uninterrupted” hydrogen bond life time definition is known to underestimate the average lifetimes and produce time-step dependent lifetime distributions in highly diffusive systems including water and polar solvent mixtures.54 Since lipid diffusion is relatively slow and CHOL-SM hydrogen bonding is known to be persistent1, interruptions to hydrogen bonds should be relatively infrequent. In contrast to those expectations, the bulk of CHOL-SM hydrogen bonds appear to be short-lived, though stable hydrogen bonds persisting up to 5 ns are observed (Figures S4a and S5 in SI). The donor-acceptor distance distribution is centered near 0.3 nm (Figure S4b in SI) in agreement with standard hydrogen bonding distances.55 In comparison to CHOL-SM, hydrogen bonding between CHOL-CHOL is found to have low probability (on the order of 1/10,000 per CHOL per frame). These observations suggest that CHOL-CHOL hydrogen bonding is insignificant to the structure and stability of the CHOL dimer. On the other hand, CHOL-SM and CHOL-POPC hydrogen bonding contributes to the structural stabilization of CHOL aggregates (with a CHOL-SM and CHOL-POPC hydrogen bonding probability of 0.2–0.3 per CHOL per frame). CHOL-SM hydrogen bonding is found to be more persistent than CHOL-POPC hydrogen bonding (see Figure S5 in SI). A detailed breakdown of hydrogen bonding populations for cholesterol with itself and other lipids is tabulated in SI (Table S4).
Figure 10.
CHOL-SM heterodimer in POPC:CHOL:SM lipid bilayer with CHOL (red), POPC (green), and SM (grey).
Conclusions
Using molecular dynamics simulation we have observed and rigorously characterized the structure and stability of dimers of cholesterol (CHOL) formed in POPC and sphingomyelin (SM) containing model lipid bilayers. Higher CHOL concentrations are observed to promote self-aggregation of CHOL, with sphingomyelin acting as a “linker” that further promotes the formation of CHOL aggregates. While evidence of liquid ordered domain formation from an initially disordered mixture was absent, local order in the form of CHOL homodimers and CHOL-SM heterodimers was observed.
Computed disaggregation constants characterizing CHOL aggregates were found to be an order-of-magnitude higher than experimentally measured values.9 Given the assumptions underlying the interpretation of the experimental data, the origin of this discrepancy is unclear. Additional independent assessments of cholesterol association would therefore be valuable in providing a critical test of existing force fields.
Simulated CHOL homodimers were observed to predominantly form alpha-to-alpha face (deformed) structures. However, evident relative twist and slide of the corresponding CHOL monomer suggests a need to refine the classic, idealized view of face-to-face CHOL dimer conformations.8 No evidence of tail-to-tail CHOL homodimer formation, proposed in the past in theoretical and experimental studies of CHOL aggregation, was observed in POPC bilayer within the sub-microsecond simulation time scale. As trans-bilayer CHOL diffusion is suggested to facilitate these interactions, further extensive simulation may be necessary to thoroughly assess the importance of CHOL tai-to-tail dimerization. While the alpha-to-alpha face dimer was observed to predominate, measurable heterogeneity is observed in the CHOL dimer structural ensemble, including significant population of beta-face to beta-face dimer. The dimer ensemble is characterized by a relatively narrow distribution of dimer tilt and relative monomer displacement (slide).
Supplementary Material
Acknowledgments
The authors gratefully acknowledge the generous support of the National Science Foundation (CHE-1362524) and the National Institutes of Health (R01 GM107703). We are also thankful for the high performance computing resources of the Boston University Shared Computing Cluster (SCC). GAP is supported by a National Science Foundation Graduate Research Fellowship (DGE-1247312).
Footnotes
Additional Supporting Information may be found in the online version of this article.
References and Notes
- 1.Ohvo-Rekilä H, Ramstedt B, Leppimäki P, Slotte JP. Prog. Lipid Res. 2002;41:66–97. doi: 10.1016/s0163-7827(01)00020-0. [DOI] [PubMed] [Google Scholar]
- 2.Fantini J, Barrantes FJ. Front. Physiol. 2013;4 doi: 10.3389/fphys.2013.00031. [DOI] [PMC free article] [PubMed] [Google Scholar]
- 3.Rose IA, Hanson KR, Wilkinson KD, Wimmer MJ. Proc. Natl. Acad. Sci. United States Am. 1980;77:2439–2441. doi: 10.1073/pnas.77.5.2439. [DOI] [PMC free article] [PubMed] [Google Scholar]
- 4.Song Y, Kenworthy AK, Sanders CR. Protein Sci. 2014;23:1–22. doi: 10.1002/pro.2385. [DOI] [PMC free article] [PubMed] [Google Scholar]
- 5.Pike LJ. J. Lipid Res. 2003;44:655–667. doi: 10.1194/jlr.R200021-JLR200. [DOI] [PubMed] [Google Scholar]
- 6.Hancock JF. Nat. Rev. Mol. Cell Biol. 2006;7:456–462. doi: 10.1038/nrm1925. [DOI] [PMC free article] [PubMed] [Google Scholar]
- 7.Heberle FA, Feigenson GW. Cold Spring Harb. Perspect. Biol. 2011;3 doi: 10.1101/cshperspect.a004630. [DOI] [PMC free article] [PubMed] [Google Scholar]
- 8.Martin RB, Yeagle PL. Lipids. 1978;13:594–597. doi: 10.1007/BF02535821. [DOI] [PubMed] [Google Scholar]
- 9.Harris JS, Epps DE, Davio SR, Kezdy FJ. Biochemistry. 1995;34:3851–3857. doi: 10.1021/bi00011a043. [DOI] [PubMed] [Google Scholar]
- 10.Mukherjee S, Chattopadhyay A. Chem. Phys. Lipids. 2005;134:79–84. doi: 10.1016/j.chemphyslip.2004.12.001. [DOI] [PubMed] [Google Scholar]
- 11.McHenry AJ, Sciacca MFM, Brender JR, Ramamoorthy A. Biochim. et Biophys. Acta. 2012;1818:3019–3024. doi: 10.1016/j.bbamem.2012.07.021. [DOI] [PMC free article] [PubMed] [Google Scholar]
- 12.Weise K, Radovan D, Gohlke A, Opitz N, Winter R. Chem. Eur. J. Chem. Bio. 2010;11:1280–1290. doi: 10.1002/cbic.201000039. [DOI] [PubMed] [Google Scholar]
- 13.Simons K, Ehehalt R. J. Clin. Investig. 2002;110:597–603. doi: 10.1172/JCI16390. [DOI] [PMC free article] [PubMed] [Google Scholar]
- 14.Reitz C. Int. J. Alzheimer\textquotesingles Dis. 2012;2012:1–11. [Google Scholar]
- 15.Khelashvili G, Pabst G, Harries D. J. Phys. Chem. B. 2010;114:7524–7534. doi: 10.1021/jp101889k. [DOI] [PMC free article] [PubMed] [Google Scholar]
- 16.O’Connor JW, Klauda JB. J. Phys. Chem. B. 2011;115:6455–6464. doi: 10.1021/jp108650u. [DOI] [PubMed] [Google Scholar]
- 17.Martinez-Seara H, Róg T, Karttunen M, Vattulainen I, Reigada R. PLoS One. 2010;5 doi: 10.1371/journal.pone.0011162. [DOI] [PMC free article] [PubMed] [Google Scholar]
- 18.Dai J, Alwarawrah M, Huang J. J. Phys. Chem. B. 2009;114:840–848. doi: 10.1021/jp909061h. [DOI] [PMC free article] [PubMed] [Google Scholar]
- 19.Pandit SA, Vasudevan S, Chiu SW, Mashl RJ, Jakobsson E, Scott HL. Biophys. J. 2004;87:1092–1100. doi: 10.1529/biophysj.104.041939. [DOI] [PMC free article] [PubMed] [Google Scholar]
- 20.Pandit SA, Bostick D, Berkowitz ML. Biophys. J. 2004;86:1345–1356. doi: 10.1016/S0006-3495(04)74206-X. [DOI] [PMC free article] [PubMed] [Google Scholar]
- 21.Berkowitz ML. Biochim. et Biophys. Acta. 2009;1788:86–96. doi: 10.1016/j.bbamem.2008.09.009. [DOI] [PubMed] [Google Scholar]
- 22.Marrink SJ, de Vries AH, Tieleman DP. Biochim. et Biophys. Acta. 2009;1788:149–168. doi: 10.1016/j.bbamem.2008.10.006. [DOI] [PubMed] [Google Scholar]
- 23.Davis RS, Kumar PBS, Sperotto MM, Laradji M. J. Phys. Chem. B. 2013;117:4072–4080. doi: 10.1021/jp4000686. [DOI] [PubMed] [Google Scholar]
- 24.Jo S, Kim T, Iyer VG, Im W. J. Comput. Chem. 2008;29:1859–1865. doi: 10.1002/jcc.20945. [DOI] [PubMed] [Google Scholar]
- 25.Wu EL, Cheng X, Jo S, Rui H, Song KC, Dávila-Contreras EM, Qi Y, Lee J, Monje-Galvan V, Venable RM, Klauda JB, Im W. J. Comput. Chem. 2014;35:1997–2004. doi: 10.1002/jcc.23702. [DOI] [PMC free article] [PubMed] [Google Scholar]
- 26.Klauda JB, Venable RM, Freites JA, O’Connor JW, Tobias DJ, Mondragon-Ramirez C, Vorobyov I, MacKerell AD, Pastor RW. J. Phys. Chem. B. 2010;114:7830–7843. doi: 10.1021/jp101759q. [DOI] [PMC free article] [PubMed] [Google Scholar]
- 27.Lim JB, Rogaski B, Klauda JB. J. Phys. Chem. B. 2011;116:203–210. doi: 10.1021/jp207925m. [DOI] [PubMed] [Google Scholar]
- 28.Venable RM, Sodt AJ, Rogaski B, Rui H, Hatcher E, MacKerell AD, Pastor RW, Klauda JB. Biophys. J. 2014;107:134–145. doi: 10.1016/j.bpj.2014.05.034. [DOI] [PMC free article] [PubMed] [Google Scholar]
- 29.Jorgensen WL, Chandrasekhar J, Madura JD, Impey RW, Klein ML. J. Chem. Phys. 1983;79:926–935. [Google Scholar]
- 30.Hoover WG. Phys. Rev. 1985;31:1695–1697. doi: 10.1103/physreva.31.1695. [DOI] [PubMed] [Google Scholar]
- 31.Nosé S. J. Chem. Phys. 1984;81:511–519. [Google Scholar]
- 32.Parrinello M. J Appl Phys. 1981;52:7182–7190. [Google Scholar]
- 33.Essmann U, Perera L, Berkowitz ML, Darden T, Lee H, Pedersen LG. J. Chem. Phys. 1995;103:8577. [Google Scholar]
- 34.Hess B. J. Chem. Theory Comput. 2008;4:116–122. doi: 10.1021/ct700200b. [DOI] [PubMed] [Google Scholar]
- 35.Pronk S, Páll S, Schulz R, Larsson P, Bjelkmar P, Apostolov R, Shirts MR, Smith JC, Kasson PM, van der Spoel D, Hess B, Lindahl E. Bioinformatics. 2013;29:845–854. doi: 10.1093/bioinformatics/btt055. [DOI] [PMC free article] [PubMed] [Google Scholar]
- 36.Van Der Spoel D, Lindahl E, Hess B, Groenhof G, Mark AE, Berendsen HJC. J. Comput. Chem. 2005;26:1701–1718. doi: 10.1002/jcc.20291. [DOI] [PubMed] [Google Scholar]
- 37.Abraham MJ, Murtola T, Schulz R, Páll S, Smith JC, Hess B, Lindahl E. SoftwareX. 2015;1–2:19–25. [Google Scholar]
- 38.Michaud-Agrawal N, Denning EJ, Woolf TB, Beckstein O. J. Comput. Chem. 2011;32:2319–2327. doi: 10.1002/jcc.21787. [DOI] [PMC free article] [PubMed] [Google Scholar]
- 39.Humphrey W, Dalke A, Schulten K. J. Mol. Graph. 1996;14:33–38. 27–28. doi: 10.1016/0263-7855(96)00018-5. [DOI] [PubMed] [Google Scholar]
- 40.Engelman DM, Rothman JE. J. Biol. Chem. 1972;247:3694–3697. [PubMed] [Google Scholar]
- 41.Shinoda W, Okazaki S. J. Chem. Phys. 1998;109:1517–1521. [Google Scholar]
- 42.Barber CB, Dobkin DP, Huhdanpaa H. ACM Trans. Math. Softw. 1996;22:469–483. [Google Scholar]
- 43.Gower JC, Ross GJS. Appl. Stat. 1969:54–64. [Google Scholar]
- 44.Kirkwood JG, Buff FP. J. Chem. Phys. 1951;19:774–777. [Google Scholar]
- 45.Perera A, Mazighi R, Kežić B. J. Chem. Phys. 2012;136 doi: 10.1063/1.4707745. [DOI] [PubMed] [Google Scholar]
- 46.Crick FHC. Acta Crystallogr. 1953;6:689–697. [Google Scholar]
- 47.Dominguez L, Foster L, Meredith SC, Straub JE, Thirumalai D. J. Am. Chem. Soc. 2014;136:9619–9626. doi: 10.1021/ja503150x. [DOI] [PMC free article] [PubMed] [Google Scholar]
- 48.Sprong H, van der Sluijs P, van Meer G. Nat. Rev. Mol. Cell Biol. 2001;2:504–513. doi: 10.1038/35080071. [DOI] [PubMed] [Google Scholar]
- 49.Ferreira TM, Coreta-Gomes F, Ollila OHS, Moreno MJ, Vaz WLC, Topgaard D. Phys. Chem. Chem. Phys. 2013;15:1976–1989. doi: 10.1039/c2cp42738a. [DOI] [PubMed] [Google Scholar]
- 50.Vogel A, Scheidt HA, Baek DJ, Bittman R, Huster D. Phys. Chem. Chem. Phys. 2016;18:3730–3738. doi: 10.1039/c5cp05084g. [DOI] [PubMed] [Google Scholar]
- 51.Bittman R, Kasireddy CR, Mattjus P, Slotte JP. Biochemistry. 1994;33:11776–11781. doi: 10.1021/bi00205a013. [DOI] [PubMed] [Google Scholar]
- 52.Matsumori N, Yasuda T, Okazaki H, Suzuki T, Yamaguchi T, Tsuchikawa H, Doi M, Oishi T, Murata M. Biochemistry. 2012;51:8363–8370. doi: 10.1021/bi3009399. [DOI] [PubMed] [Google Scholar]
- 53.Yagi K, Li P-C, Shirota K, Kobayashi T, Sugita Y. Phys. Chem. Chem. Phys. 2015;17:29113–29123. doi: 10.1039/c5cp04131g. [DOI] [PubMed] [Google Scholar]
- 54.van der Spoel D, van Maaren PJ, Larsson P, Tîmneanu N. J. Phys. Chem. B. 2006;110:4393–4398. doi: 10.1021/jp0572535. [DOI] [PubMed] [Google Scholar]
- 55.Jeffrey GA, Saenger W. Hydrogen bonding in biological structures. Springer Science & Business Media; 2012. [Google Scholar]
Associated Data
This section collects any data citations, data availability statements, or supplementary materials included in this article.


