Abstract
Hydrogen sulfide is a critical signaling molecule, but high concentrations cause cellular toxicity. A four-enzyme pathway in the mitochondrion detoxifies H2S by converting it to thiosulfate and sulfate. Recent studies have shown that globins like hemoglobin and myoglobin can also oxidize H2S to thiosulfate and hydropolysulfides. Neuroglobin, a globin enriched in the brain, was reported to bind H2S tightly and was postulated to play a role in modulating neuronal sensitivity to H2S in conditions such as stroke. However, the H2S reactivity of the coordinately saturated heme in neuroglobin is expected a priori to be substantially lower than that of the 5-coordinate hemes present in myoglobin and hemoglobin. To resolve this discrepancy, we explored the role of the distal histidine residue in muting the reactivity of human neuroglobin toward H2S. Ferric neuroglobin is slowly reduced by H2S and catalyzes its inefficient oxidative conversion to thiosulfate. Mutation of the distal His64 residue to alanine promotes rapid binding of H2S and its efficient conversion to oxidized products. X-ray absorption, EPR, and resonance Raman spectroscopy highlight the chemically different reaction options influenced by the distal histidine ligand. This study provides mechanistic insights into how the distal heme ligand in neuroglobin caps its reactivity toward H2S and identifies by cryo-mass spectrometry a range of sulfide oxidation products with 2–6 catenated sulfur atoms with or without oxygen insertion, which accumulate in the absence of the His64 ligand.
Keywords: heme, hydrogen sulfide, Raman spectroscopy, spectroscopy, X-ray absorption spectroscopy, globin, neuroglobin
Introduction
Neuroglobin is a member of the globin family (1) that is expressed primarily in neuronal tissues (2) but also in other metabolically highly active endocrine tissues, such as the adrenal gland and the pancreatic islets of Langerhans (3, 4). Although the physiological role of neuroglobin is still elusive, early studies suggested that it might be involved in oxygen supply (1, 5). However, neuroglobin is generally expressed at low levels and exhibits a high autoxidation rate, producing reactive oxygen species, which makes its role as an O2 carrier unlikely (6). Neuroglobin can also scavenge reactive oxygen species and reduce nitrite to NO under hypoxic conditions (7–9).
In contrast to hemoglobin and myoglobin, two histidine residues coordinate the heme cofactor in neuroglobin in the ferrous and ferric states (Fig. 1A). The crystal structure of neuroglobin reveals a high structural similarity to myoglobin, despite <25% amino acid sequence similarity between the proteins. The structure reveals a large hydrophobic cavity, which connects the proximal and distal sides of the heme (7). His64 and His96 coordinate the heme on the distal and proximal sides, respectively (10). Exogenous ligands like O2, CO, and NO bind to ferrous neuroglobin (FeII-Ngb)2 on the distal side, and binding is limited by dissociation of His64, which is slow (6, 11–14). Limited characterization of the binding of sulfide to ferric neuroglobin (FeIII-Ngb) has been reported; the bimolecular rate constant for H2S binding to neuroglobin was 35- and ∼1000-fold slower than for myoglobin and hemoglobin, respectively, at pH 5.5, where the comparisons were made (15). The ability of exogenous ligands to bind to the 6-coordinate heme in neuroglobin has been attributed to the electronic properties of the heme ligand environment and the flexibility of the helix bearing the distal heme ligand (16).
Figure 1.
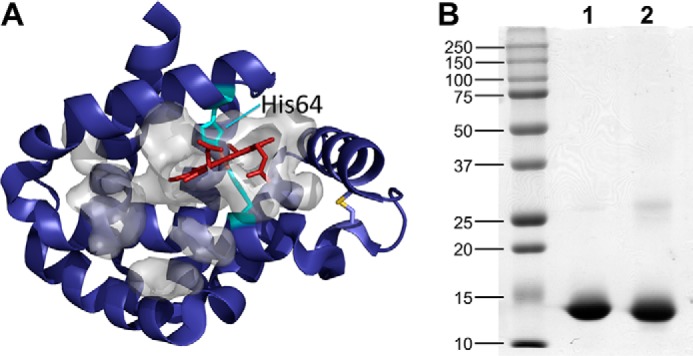
Structure and purity of neuroglobin. A, structure of wild-type human neuroglobin (Protein Data Bank entry 4MPM) with the heme (red) and the coordinating histidine residues (His64 and His96; cyan) and the disulfide bond between Cys46 and Cys55 shown in a stick representation. The large cavity around the heme is displayed in a space-filling representation (gray). B, the purity of recombinant wild-type (lane 1) and H64A (lane 2) neuroglobin was judged by SDS-PAGE analysis. The molecular weight markers are shown on the left. The molecular mass of neuroglobin is ∼14 kDa.
H2S is a signaling molecule (17, 18), which is synthesized endogenously (19–22) but is toxic at high concentrations by virtue of its inhibition of cytochrome c oxidase in the electron transfer chain (23). H2S is detoxified via a mitochondrial sulfide oxidation pathway comprising four enzymes that convert it to thiosulfate and sulfate. The electrons released by sulfide quinone oxidoreductase, which catalyzes the first step in the mitochondrial sulfide oxidation pathway (24, 25), are transferred to complex III, thus coupling H2S oxidation to the mitochondrial electron transfer pathway (26). Recently, we have described a hemeprotein-dependent alternative to the mitochondrial pathway for catalytic H2S oxidation. Both ferric myoglobin and ferric hemoglobin oxidize sulfide to thiosulfate and to hydropolysulfides (27, 28).
H2S functions as a neuromodulator (29) and also protects neurons from oxidative stress (30). Several differences appear to exist in the enzymes involved in H2S homeostasis in brain versus liver, where H2S metabolism has been studied in greater detail. Thus, whereas γ-cystathionase is the major contributor to H2S generation via the transsulfuration pathway in liver (31), cystathionase β-synthase appears to assume this role in brain (32). The rate of H2S consumption in brain is ∼6-fold slower than in liver and is insensitive to stigmatellin, an inhibitor of complex III (33). Similarly, when [35S]H2S was used to track sulfide oxidation in brain homogenate, an insensitivity of sulfate and thiosulfate formation to stigmatellin was observed (33). Very low levels of mRNA (and protein) encoding sulfide quinone oxidoreductase are found in brain (33). These observations raise questions about the mechanism by which H2S is oxidized in the brain and the possible involvement of hemeproteins such as neuroglobin in catalyzing H2S oxidation via a noncanonical pathway.
In this study, we have examined the interaction of human neuroglobin with H2S and find that it can oxidize H2S to thiosulfate, albeit inefficiently. The reaction of H2S with FeIII-Ngb results in slow reduction of the heme iron to the ferrous state. Replacement of the distal histidine ligand by alanine greatly accelerates sulfide oxidation by neuroglobin and supports its oxidation to thiosulfate and to a wide range of catenated sulfur products.
Results
Purification and reaction of neuroglobin with sulfide
Wild-type and H64A human neuroglobin were expressed as fusion proteins with an N-terminal glutathione S-transferase (GST) tag that was cleaved by thrombin as described under “Experimental procedures.” The proteins were judged to be >95% pure by SDS-PAGE analysis (Fig. 1B).
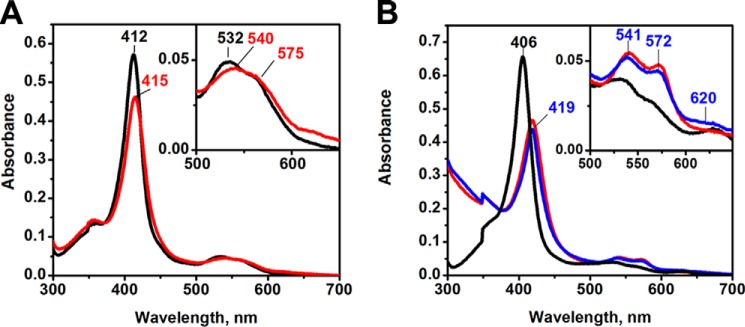
Human FeIII-Ngb exhibits a UV-visible spectrum typical of a bis-histidine coordinated hemeprotein with a Soret peak at 412 nm and a broad α/β band with a peak at 532 and a shoulder at 560 nm (Fig. 2A). Upon the addition of Na2S, the Soret peak shifts to 415 nm with a concomitant decrease in intensity, whereas the α/β bands remain broad with a peak at 540 nm and a shoulder at 575 nm (Fig. 2A). The spectrum of sulfide-treated neuroglobin under aerobic conditions appears to be a mixture of species and resembles that of O2-bound ferrous neuroglobin, which displays absorbance maxima at 413, 543, and 571 nm (34, 35). However, accumulation of O2-FeII-Ngb is excluded because similar spectral changes were induced by sulfide under anaerobic conditions with the exception that a slight increase in the intensity at 558 nm was observed, indicating the presence of a small amount of FeII-Ngb (not shown).
Figure 2.
Changes in the absorption spectrum of human FeIII-Ngb following the addition of sulfide. A and B, spectra obtained following mixing of FeIII-Ngb (A) or H64A FeIII-Ngb (B) (5 μm heme) in aerobic 100 mm HEPES buffer, pH 7.4, with Na2S (1 mm) at 25 °C. Spectra were recorded every minute for 30 min, and a subset is shown for clarity. The black and red traces represent the initial and final spectra, respectively. The inset shows an expanded view of the α/β bands. In B, the spectra were recorded for an additional 30 min with the final spectrum shown in blue.
The H64A mutation resulted in a shift in the Soret peak from 412 to 406 nm (at pH 7.4) compared with wild-type neuroglobin, and the α/β bands were at 565 and 531 nm (Fig. 2B). The addition of sulfide shifted the Soret band to 422 nm and the α/β bands to 570 and 543 nm (red spectrum). Similar absorbance changes were observed under anaerobic conditions (not shown). The maximum at 422 nm slowly decreased in intensity and slightly blue-shifted to 419 nm over the next 30 min (blue spectrum). A slight increase in intensity was observed at ∼620 nm, suggesting that a small amount of sulfneuroglobin had formed from the addition of sulfur to the porphyrin ring (Fig. 2B, inset).
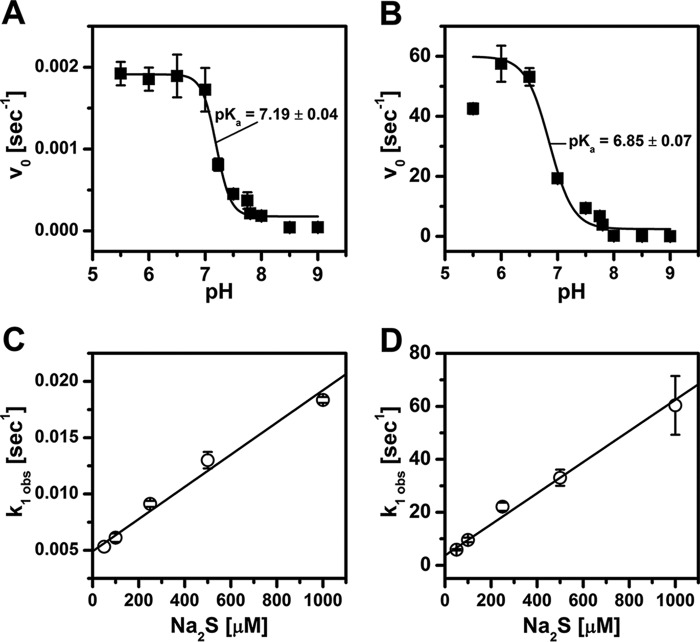
A pH dependence for binding of exogenous ligands to neuroglobin has been reported previously and ascribed to protonation of the distal histidine, which would facilitate its dissociation (15, 36). We therefore examined the pH dependence of sulfide binding to wild-type and H64A neuroglobin (Fig. 3). The interaction of FeIII-Ngb with sulfide exhibited biphasic kinetics at all pH values and was monitored at 412 or 406 nm for wild-type and H64A neuroglobin, respectively. From the pH dependence of the initial velocity for sulfide binding, pKa values of 7.19 ± 0.04 and 6.85 ± 0.07 for wild-type and H64A neuroglobin, respectively, were obtained (Fig. 3, A and B). Because these values are essentially the same within experimental error, it rules out the contribution of the distal His64 ligand to the observed pKa.
Figure 3.
Kinetic characterization of sulfide binding to wild-type and H64A FeIII-Ngb. Dependence of the initial velocity (vo) for sulfide binding to FeIII-Ngb (A) and H64A FeIII-Ngb (B) on pH. The reaction mixtures were the same as in Fig. 2 except that the buffer was varied over the pH range as described under “Experimental procedures.” The data were fitted to Equation 2. Wild-type (C) or H64A (D) FeIII-Ngb in 100 mm HEPES buffer, pH 7.4, 25 °C, was mixed with 0.05–1.0 mm Na2S. For H64A neuroglobin, the reaction was monitored in a stopped-flow spectrophotometer. The kobs for the fast phase was plotted as a function of sulfide concentration.
Replots of the kobs (for the fast phase) on sulfide concentration yielded the following parameters for wild-type neuroglobin: kon = 13.8 ± 0.7 m−1 s−1 and koff = 5.1 ± 0.3 × 10⁻³ s−1 at pH 7.4 and 25 °C, yielding a KD = 370 μm (Fig. 3C). The kobs for the slow phase (5.60 × 10⁻⁴ s−1) was independent of pH and sulfide concentration. The kinetics of sulfide binding to H64A FeIII-Ngb were considerably faster than for the wild-type protein and had to be monitored by stopped-flow spectroscopy. Analysis of the data for H64A neuroglobin yielded the following parameters: kon = 58.8 ± 3.8 × 10³ m−1 s−1, koff = 3.7 ± 0.4 s−1, and KD = 63 μm at pH 7.4 and 25 °C (Fig. 3D).
Sulfide oxidation products of neuroglobin
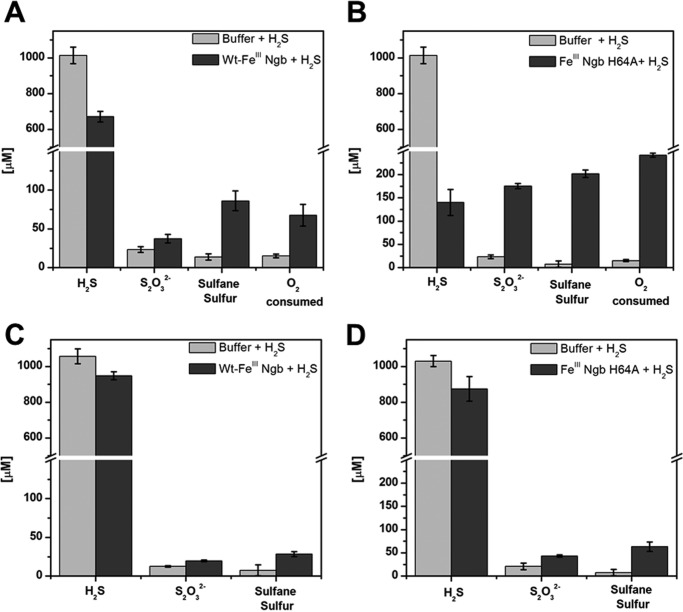
H2S disappeared slowly when mixed with 50 μm FeIII-Ngb under aerobic conditions. After 1 h, 328 ± 30 μm sulfide and 53 ± 14 μm O2 were consumed, whereas 18 ± 6 μm thiosulfate (corresponding to 36 μm sulfur) and 72 ± 13 μm hydropolysulfides were formed, accounting for ∼33% of the total sulfur (Fig. 4A). The H64A mutant was more active in oxidizing sulfide. After 1 h, 859 ± 28 μm sulfide and 227 ± 4 μm O2 were consumed, whereas 194 ± 8 μm thiosulfate and 152 ± 6 μm protein-bound polysulfides were formed, accounting for ∼63% of the total sulfur (Fig. 4B). Under anaerobic conditions, the concentration of H2S lost was equal to the concentration of heme with both wild type and the H64A neuroglobin (Fig. 4, C and D).
Figure 4.
H2S oxidation by FeIII-Ngb. Disappearance of H2S (1 mm) and O2, and formation of sulfide oxidation products 60 min after the addition of sulfide to wild-type (A) or H64A (B) FeIII-Ngb (100 μm each) in 100 mm aerobic HEPES buffer, pH 7.4, at 25 °C. C and D, data from experiments set up as in A and B, respectively, except under anaerobic conditions. The data represent the average of three independent experiments.
Cryo-mass spectrometric characterization of sulfide oxidation intermediates
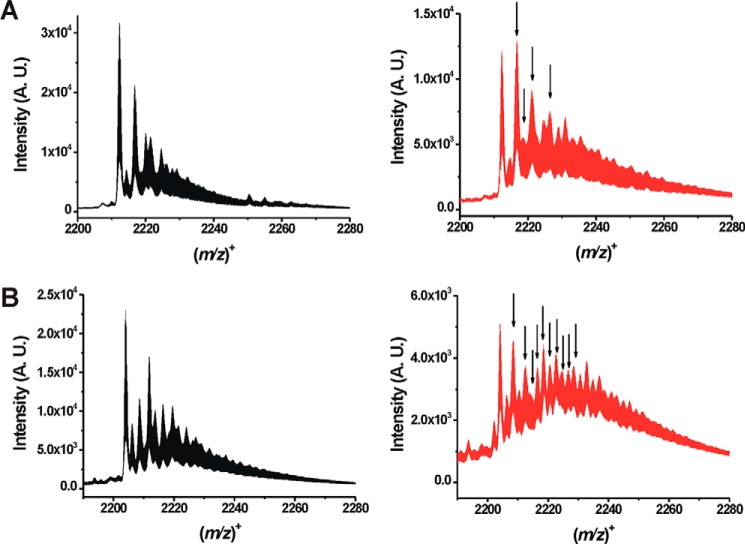
The products of the reaction between neuroglobin and H2S were detected by low-temperature ESI-TOF-MS, which preserves weak coordination species. Significant differences were observed between the mass spectra of wild-type and H64A neuroglobin following H2S treatment (Fig. 5, A and B). Analysis of the Δ(m/z) between the control and H2S-treated samples revealed the actual speciation of the reaction products (Table 1). Whereas a limited number of sulfide oxidation products were observed with wild-type neuroglobin (SO˙̄, SO4−, and S2O32−), a complex array of products was seen with the H64A mutant with 2–6 sulfur atoms (HS2−, HS3−, HS4−, HS5−, HS6−) and variously oxygenated derivatives (Table 1).
Figure 5.
Mass spectrometric analysis of neuroglobin treated with sulfide. A, mass spectra of neuroglobin without (black) and with H2S (red) treatment. B, mass spectra of H64A neuroglobin without (black) and with H2S (red) treatment. Spectra were recorded using a low-temperature spraying mode as described under “Experimental procedures” and represent (8+) species. The arrows indicate the appearance of major new species that are not seen in the spectra of wild-type or H64A neuroglobin alone. The full product list is given in Table 1. A.U. arbitrary units.
Table 1.
ESI-TOF-MS analysis of product speciation
| Species (species coordinated to Fe2+)a | Δ(m/z) wild-type neuroglobin observed (calculated) | Δ(m/z) H64A neuroglobin observed (calculated) |
|---|---|---|
| H2S (HS−) | 33.98 (33.99) | 33.98 (33.99) |
| HSO• (SO˙̄) | 48.96 (48.97) | NDb |
| H2S2 (HS2−) | ND | 65.96 (65.96) |
| H2SO3 (HSO3−) | ND | 81.99 (81.97) |
| HSO4− (SO42−) | 97.00 (96.96) | ND |
| H2S3 (HS3−) | ND | 97.96 (97.93) |
| HS2O3− (S2O32−) | 112.93 (112.94) | 112.97 (112.94) |
| H2S4 (HS4−) | ND | 129.93 (129.90) |
| H2S3O3 (HS3O3−) | ND | 145.94 (145.92) |
| H2S5 (HS5−) | ND | 161.90 (161.88) |
| H2S4O3 (HS4O3−) | ND | 177.94 (177.89) |
| H2S6 (HS6−) | ND | 193.86 (193.85) |
aΔ(m/z) was calculated by comparing the control spectrum of untreated wild-type or mutant neuroglobin with the sulfide-treated spectrum. The mass difference therefore reflects the necessary addition of protons to compensate for the charge difference caused by the coordination to the iron center.
bND, not determined.
To investigate whether the observed species are covalently attached either to the heme or to the protein, samples were mixed with acetonitrile (with 0.5% formic acid) to denature the protein and sprayed into the mass spectrometer. No differences in the heme or protein mass spectra were observed (not shown), demonstrating that the sulfide oxidation products were not covalently attached to the heme or to the protein.
EPR spectroscopy
The EPR spectrum of wild-type FeIII-Ngb at 10 K is complex (Fig. 6) and displays a low-spin ferric signal with g = 3.09, 2.17, and 1.48, which is in good agreement with published data (37). The presence of a high-spin signal (g = 6.0 and 1.99) could be due to the presence of a small population of FeIII-Ngb with a disulfide bridge between Cys46 and Cys55, which promotes His64 dissociation from the iron (38). In the presence of sulfide, a rhombic EPR signal was seen within 5 min with g = 2.48, 2.21, and 1.85 (Fig. 6) representing ∼28% of the initial spin concentration. The broad positive feature at g ≈ 1.35 might represent an integer spin (open shell S = 0) species or a ferric heme with very small dxy dyz splitting, as seen with the cyanide adduct of myoglobin (39). However, its origin is presently unknown. With longer incubation times, the EPR signal decayed further (supplemental Fig. S1).
Figure 6.
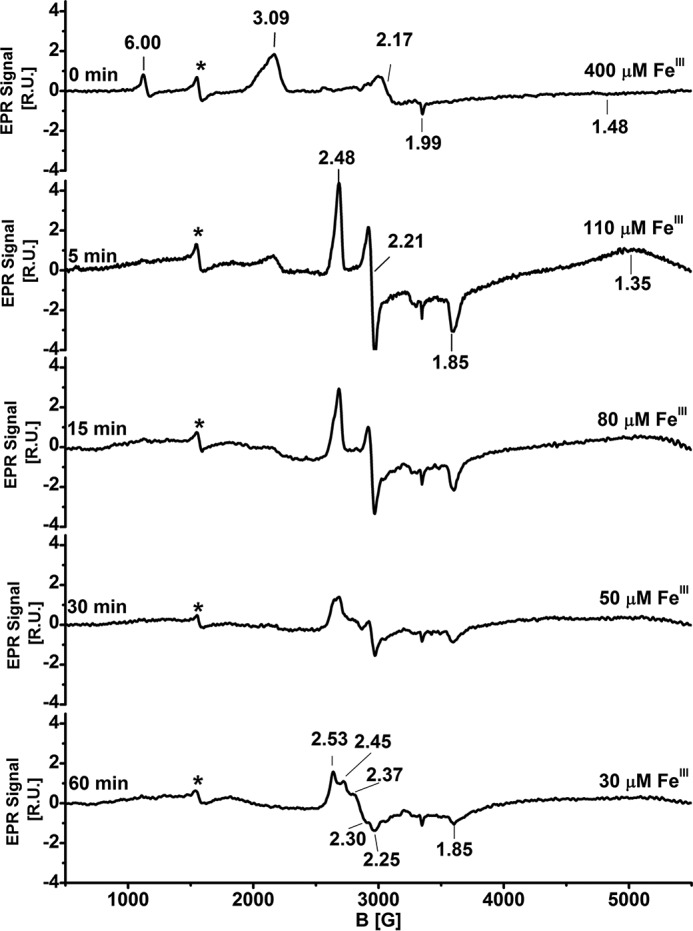
EPR spectroscopic characterization of FeIII-Ngb following the addition of Na2S. Shown is the spectrum of wild-type (400 μm) FeIII-Ngb in aerobic 100 mm HEPES buffer, pH 7.4, containing 20% glycerol (v/v) after the addition of Na2S (10 mm) at 25 °C at the indicated times. FeIII concentrations were quantified using 1 mm copper EDTA standard. The EPR settings are described under “Experimental procedures.” The signal due to adventitious ferric iron is labeled with an asterisk. R.U., relative units.
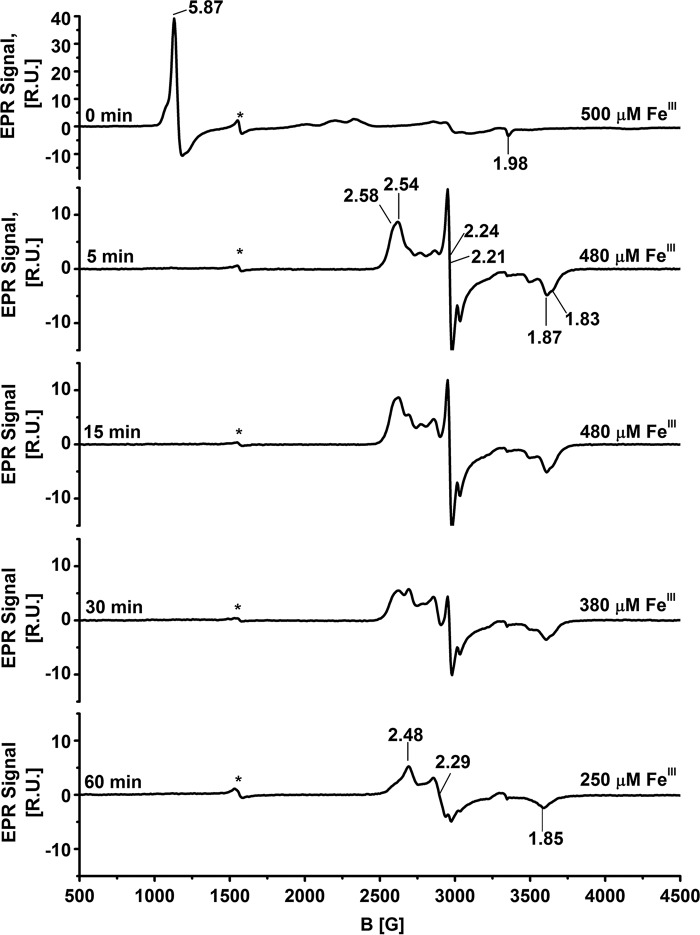
The EPR spectrum of the H64A mutant showed a g = 5.87 axial high-spin signal (Fig. 7). Treatment of H64A neuroglobin with sulfide for 5 min led to the quantitative conversion of the high-spin to a low-spin species, comprising at least two overlapping EPR signals. Simulations were used to deconvolute the spectra to a major signal (∼80%) with g = 2.54, 2.24, and 1.87 and a minor signal (∼20%) with g = 2.58, 2.21, and 1.83 (Fig. 7 and supplemental Figs. S2 and S3). The EPR signal decreased in intensity with time, and at 60 min, ∼50% of the original spin concentration was observed (supplemental Fig. S1). The third EPR signal with g values of 2.48, 2.29, 1.85 were dominant at this time point.
Figure 7.
EPR spectroscopic characterization of H64A FeIII-Ngb following the addition of Na2S. Shown is the spectrum of H64A FeIII-Ngb (500 μm) in aerobic 100 mm HEPES, pH 7.4, and 20% glycerol (v/v) after the addition of Na2S (10 mm) at 25 °C at the indicated times. The EPR settings are described under “Experimental procedures.” The signal marked with an asterisk represents adventitious iron. R.U., relative units.
Resonance Raman analysis of sulfide oxidation by FeIII-Ngb
The high-frequency region of the resonance Raman spectrum comprises in-plane porphyrin vibrational modes that hold information about the oxidation, coordination, and spin states of the heme iron. The resonance Raman spectrum of FeIII-Ngb (0 min) shows bands at 1375 cm−1 (ν4), characteristic of FeIII, and 1507 cm−1 (ν3), characteristic of low-spin FeIII (Fig. 8), which are similar to previously reported spectra of human (40) and murine (41) neuroglobin. Following the addition of sulfide, a gradual shift of ν4 to 1362 cm−1 along with the appearance of ν3 at 1482 cm−1 was observed, indicating the presence of ferrous heme, probably in the low-spin state (42). Increased fluorescence associated with the samples as the reaction progressed (especially between 30–60 min) resulted in the loss of spectral quality. The spectra obtained under aerobic and anaerobic conditions were identical (not shown), ruling out the formation of O2-FeII-Ngb, which is also not expected to accumulate due to its susceptibility to autoxidation (6).
Figure 8.
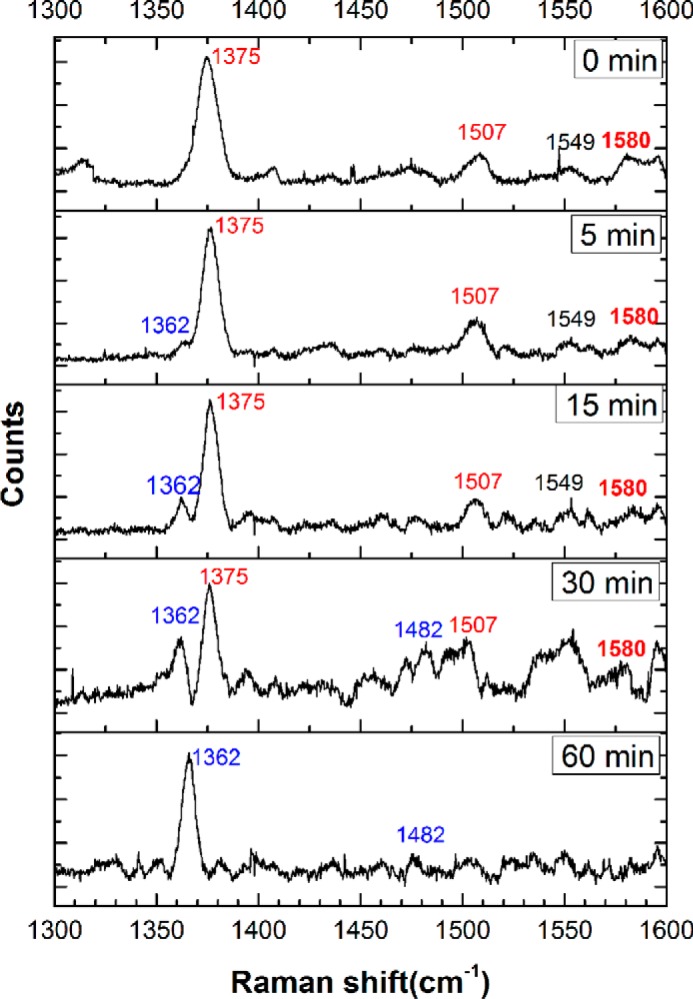
Resonance Raman spectra of FeIII-Ngb treated with sulfide. High-energy region of the spectra monitoring the time-dependent changes in FeIII-Ngb (400 μm) in 100 mm HEPES buffer, pH 7.4, containing 20% glycerol (v/v) incubated with Na2S (10 mm) at 25 °C under aerobic. The data were obtained using 413.1-nm excitation with 10–25-milliwatt laser power. Measurements for each sample took ∼10 min (various exposure time and accumulations). Initially, the observed ν2, ν38, ν3, and ν4 vibrations at 1580, 1549, 1507, and 1375 cm−1, respectively, represent a 6-coordinate ferric low-spin heme. With time, the appearance of the ν3 and ν4 vibrational frequencies at 1482 and 1362 cm−1, respectively, indicates a 6-coordinate ferrous low-spin heme.
The H64A mutant shows the oxidation state marker at 1375 cm−1 (ν4) and the spin state marker at 1475 cm−1 (ν3), indicating the presence of high-spin FeIII heme. This is similar to the resonance Raman spectrum of the H64V mutant reported previously at pH 6.4 with bands at 1374 cm−1 and 1484 cm−1 (40). In contrast to the wild-type protein, sulfide-treated H64A neuroglobin showed persistence of the oxidation state marker at 1375 cm−1 over 60 min (Fig. 9). However, the ν3 marker at 1475 cm−1 decreased in intensity, whereas a band at 1498 cm−1 appeared to increase, suggesting the presence of a mixed population of high- and low-spin FeIII-Ngb. Although this assignment is supported by the observed increase in a new band at 1585 cm−1, characteristic of low-spin heme (43), the assignment is tentative due to its low intensity.
Figure 9.
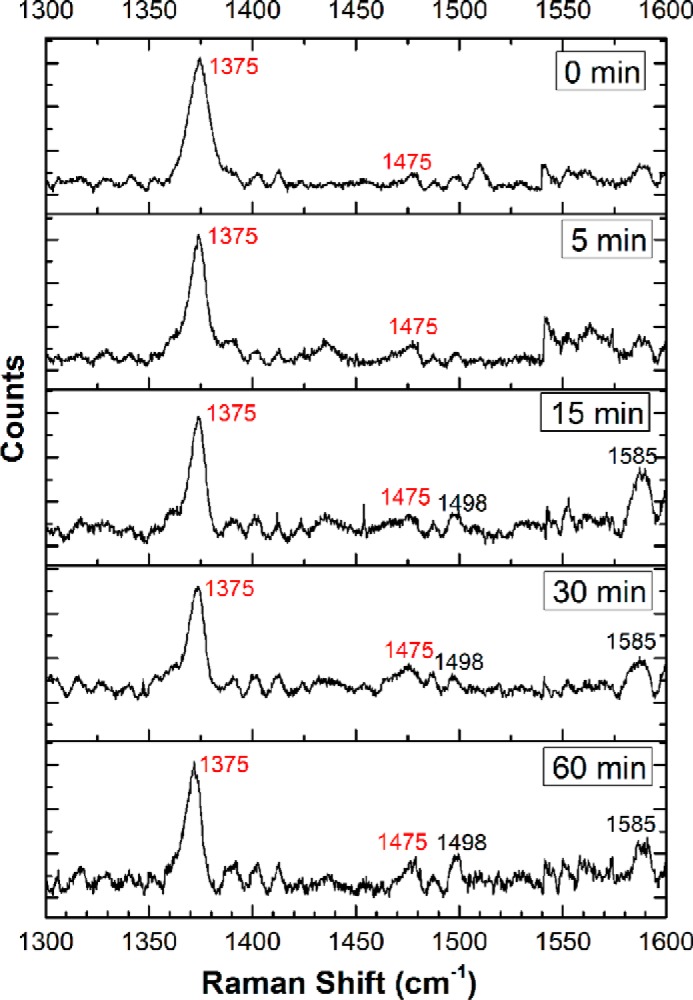
Resonance Raman spectroscopy of H64A FeIII-Ngb treated with sulfide. Shown is the high-energy region of the spectra monitoring the time-dependent changes in H64A FeIII-Ngb (500 μm) in 100 mm HEPES buffer, pH 7.4, containing 20% glycerol (v/v), incubated with Na2S (10 mm) at 25 °C under aerobic conditions. The data were obtained using 413.1-nm excitation with 10–25-milliwatt laser power. The measurement of each sample took ∼10 min (various exposure times and accumulations). The spectra showed strong fluorescence, limiting their quality. The FeIII oxidation state marker band ν4 at 1375 cm−1 is maintained throughout the reaction. The spin state marker band ν3 is observed at 1475 cm−1, indicating that the heme is high-spin. At longer reaction times, an additional signal at 1498 cm−1 appears, which could indicate the presence of a small fraction of low-spin ferric heme.
The low-frequency region of the resonance Raman spectrum contains information about the heme iron-metal ligand vibrational modes. This region of the spectrum for wild-type neuroglobin shows minor differences between 0 and 60 min following sulfide addition (Fig. 10), indicating that no significant changes in the heme pocket occurred over this time course. In contrast, the low-energy region of the spectrum for the H64A mutant shows significant time-dependent changes following sulfide addition (Fig. 11). In particular, an intense new band appeared at 495 cm−1, which was previously observed with ferric myoglobin treated with sulfide and could represent the S–S stretch in hydropolysulfide bound to the iron center. Further evidence for a change in the heme coordination environment is seen in the 351 cm−1 band, which corresponds to the totally symmetric Fe–N stretch of the heme (44, 45). This mode loses intensity over time and shifts to 345 cm−1, whereas a new feature appears at 360 cm−1. A similar band at ∼360 cm−1 was observed in sulfide-treated ferric myoglobin (28). The D2O insensitivity of this band, however, indicates that it does not represent an Fe–SH (or Fe–SH2) vibration, although it could correspond to an Fe–S bond vibration in a hydropolysulfide derivative.
Figure 10.
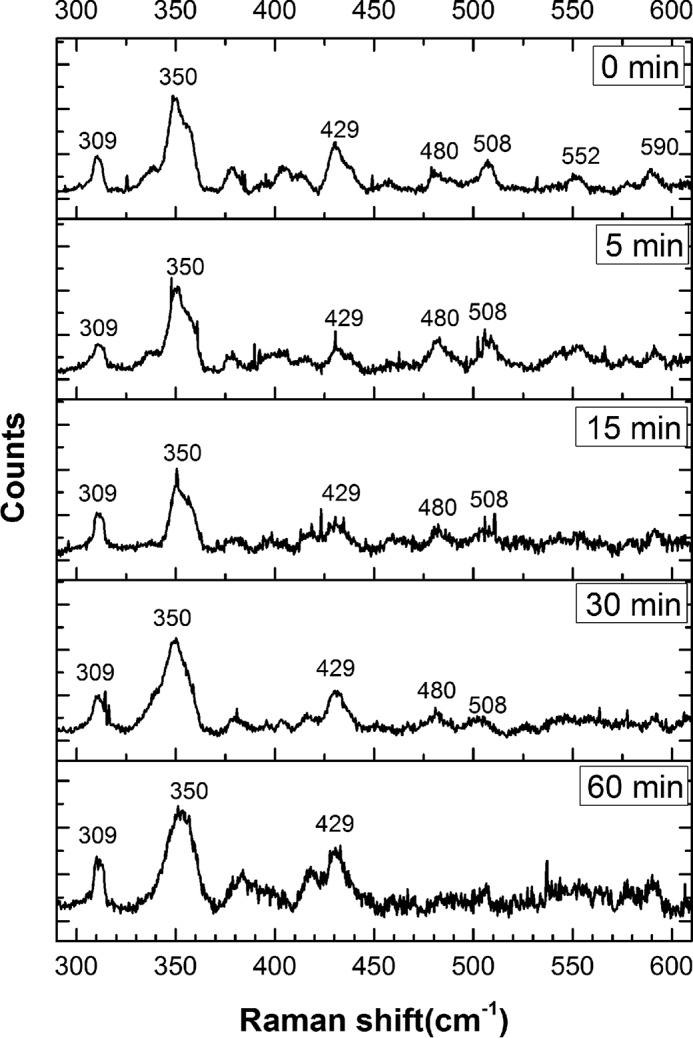
Lower-energy region of the resonance Raman spectra of wild-type FeIII-Ngb, incubated with Na2S. The spectra are of the same samples as described in the legend to Fig. 8 and were acquired under the same conditions.
Figure 11.
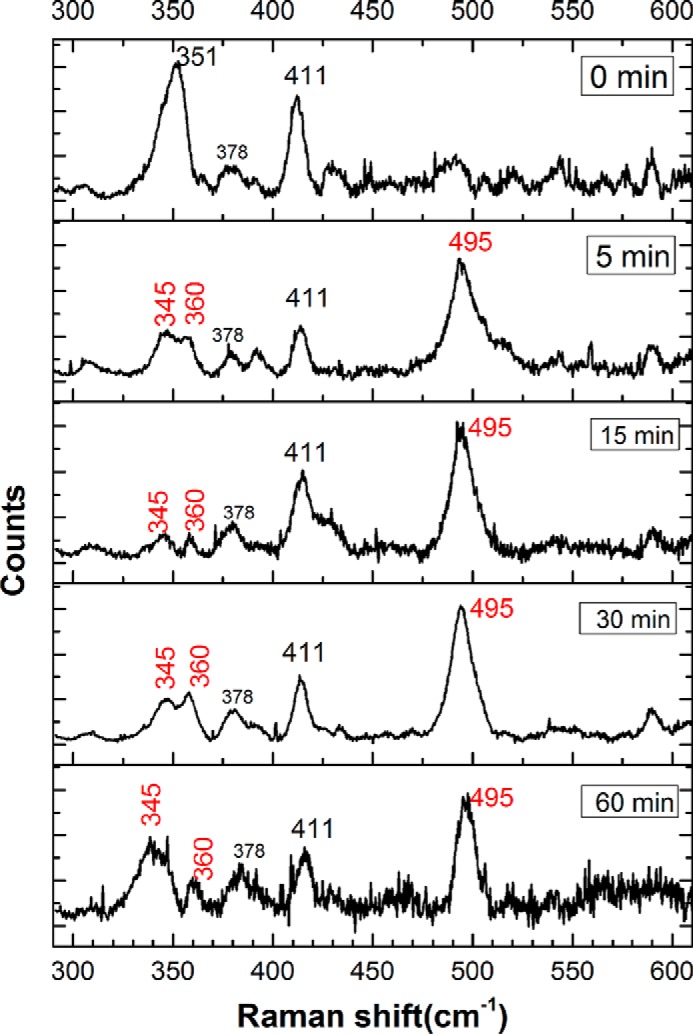
Lower-energy region of the resonance Raman spectra of H64A FeIII-Ngb, incubated with Na2S. The spectra are of the same samples and were acquired under the same conditions as described in the legend to Fig. 9. The appearance of a new, intense band at 495 cm−1 is probably due to polysulfide formation. Other new signals are observed at 345 and 360 cm−1 after a 5-min reaction time (see “Results”). The spectrum at 60 min is hampered by strong fluorescence, which limits the data quality.
XAS characterization of neuroglobin treated with sulfide
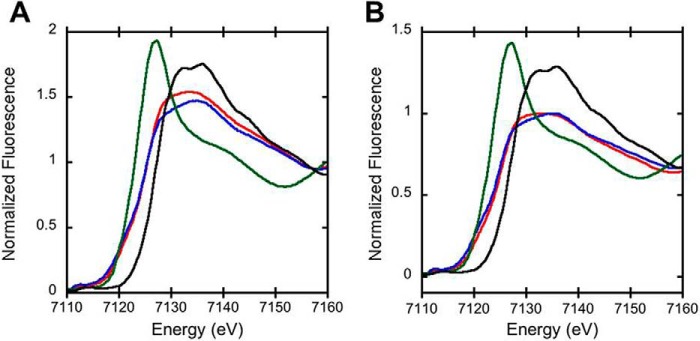
Extended X-ray Absorption Fine Structure (EXAFS) analysis of wild-type FeIII-Ngb in the presence and absence of sulfide reveals the presence of 6-coordinate iron (Table 2). FeIII-Ngb shows a first inflection point edge energy at 7125.5 (−H2S) and 7124.4 eV (+H2S). In comparison with the edge energies of the standards, ferrous sulfate (7122.9 eV) and ferric sulfate (7126.3 eV), the neuroglobin samples appear to consist of a mixture of ferrous and ferric iron (Fig. 12A). The pre-edge peak area of 9.16 10−2 eV (neuroglobin) and 8.16 10−2 eV (neuroglobin + sulfide) is consistent with a pseudosymmetric 6-coordinate iron center. The EXAFS data for both samples are best fit with six nitrogen ligands with Fe–N bond lengths of 1.99 Å (Fig. 13A). In addition, there are three Fe-C vectors that are due to single and multiple scattering signals of the porphyrin ring (Table 2). Sulfur coordination to the heme iron was not detected with wild-type neuroglobin.
Table 2.
Summary of the iron EXAFS simulations for human neuroglobin samples
| Sample | Nearest-neighbor ligand environmenta |
Long-range ligand environmenta |
|||||||
|---|---|---|---|---|---|---|---|---|---|
| Atomb | Rc | C.N.d | σ2e | Atom | R | C.N. | σ2 | F′f | |
| Å | Å | ||||||||
| WT Ngb | N | 1.99 | 6 | 2.73 | C | 3.03 | 6 | 0.93 | 0.27 |
| C | 3.41 | 3 | 2.23 | ||||||
| C | 4.05 | 6 | 4.05 | ||||||
| Wt Ngb + H2S | N | 1.99 | 6 | 3.61 | C | 3.04 | 6 | 2.18 | 0.36 |
| C | 3.40 | 4 | 4.71 | ||||||
| C | 4.08 | 4 | 1.09 | ||||||
| H64A Ngb | N | 1.98 | 5 | 2.95 | C | 3.02 | 5 | 2.95 | 0.34 |
| C | 3.41 | 4 | 1.60 | ||||||
| C | 4.07 | 5 | 0.25 | ||||||
| 5 | 4.89 | ||||||||
| H64A Ngb + H2S | N | 1.99 | 4 | 2.58 | C | 3.04 | 6 | 1.42 | 0.47 |
| S | 2.23 | 1 | 3.96 | C | 4.08 | 6 | 0.42 | ||
a Independent metal-ligand scattering environment.
b Scattering atoms: nitrogen (N), oxygen (O), and carbon (C).
c Average metal-ligand bond length.
d Average metal-ligand coordination number.
e Average Debye-Waller factor (Å × 103).
f Number of degrees of freedom weighted mean square deviation between data and fit.
Figure 12.
Normalized iron XANES spectra of FeIII-Ngb. A, normalized iron XANES of wild-type neuroglobin with (blue) and without (red) sulfide treatment. B, normalized iron XANES of H64A neuroglobin with (blue) and without (red) sulfide treatment. In both panels, the XANES spectra of neuroglobin are compared with the FeIISO4 (green) and FeIIISO4 (black) standards.
Figure 13.
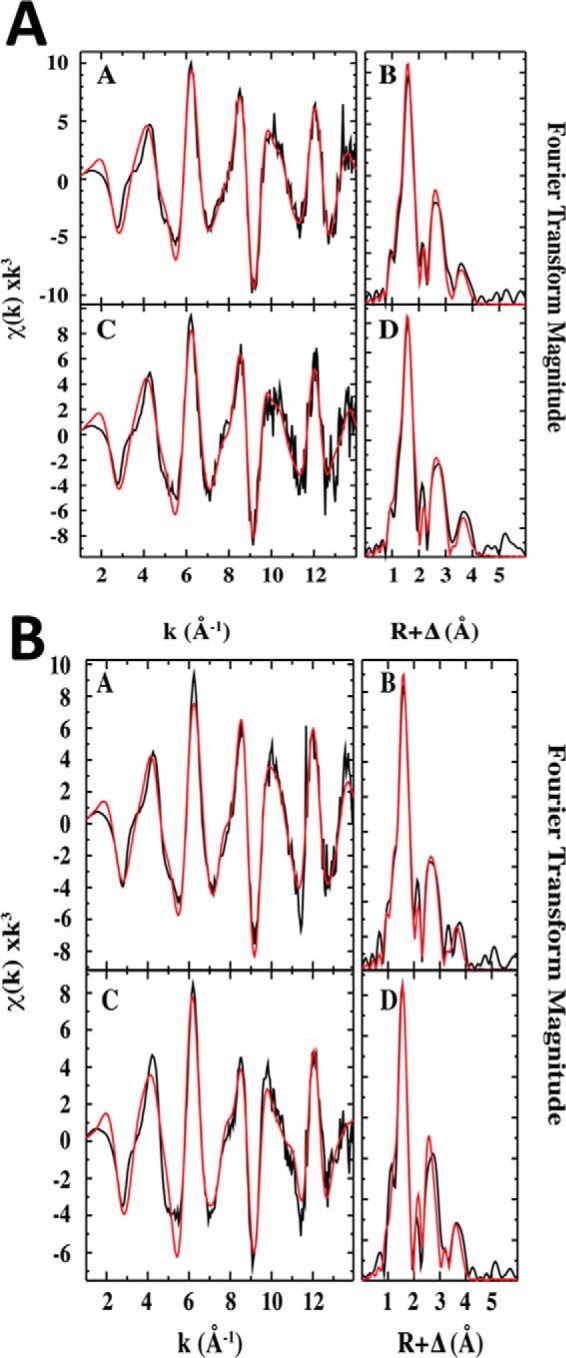
Comparison of iron EXAFS and Fourier transforms of the EXAFS data for wild-type and H64A neuroglobin. A, raw k3-weighted EXAFS data (a) and phase-shifted Fourier transforms of the EXAFS data (b) for wild-type FeIII-Ngb are shown. EXAFS and Fourier transforms for FeIII-Ngb + sulfide are shown in c and d, respectively. B, comparison of iron EXAFS and Fourier transforms of the EXAFS data for H64A neuroglobin. Raw k3-weighted EXAFS data (a) and phase-shifted Fourier transforms of the EXAFS data (b) for H64A FeIII-Ngb are shown. EXAFS and Fourier transforms for H64A FeIII-Ngb + H2S are shown in c and d, respectively.
The XAS spectra of H64A FeIII-Ngb with and without sulfide show first inflection point energies at 7124.9 eV (−H2S) and 7124.0 eV (+H2S) (Fig. 12B). The EXAFS spectrum of H64A neuroglobin is best fit with five nitrogen ligands at a distance of 1.98 Å and three Fe-C vectors with values similar to those seen with wild-type neuroglobin (Fig. 13B). In the H2S-treated sample, in addition to Fe–N bonds with a 1.99-Å length, a sulfur ligand at an Fe–S distance of 2.23 Å was detected (Table 2), which is considerably longer than observed in H2S-treated myoglobin (2.16 Å) (28) but similar to the 2.25-Å bond length predicted for an FeN5S1 species from the Cambridge structural database. Only two Fe-C vectors at bond distances of 3.02 and 4.08 Å were observed in H64A neuroglobin treated with sulfide.
Reaction of FeIII-Ngb with cysteine persulfide
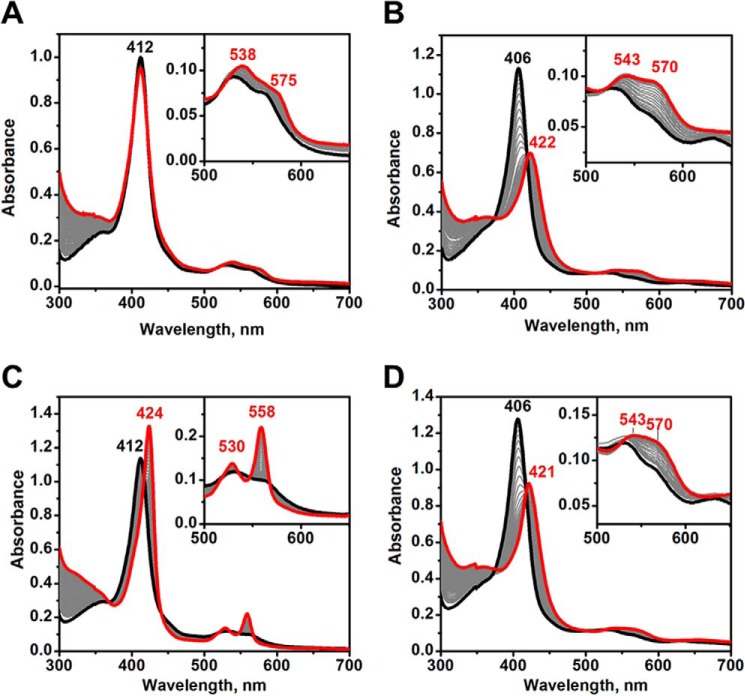
The transsulfuration pathway enzymes generate cysteine persulfide (Cys-SSH) from cystine (46), which is more reactive than H2S and might play a role in sulfide signaling. To test its reactivity toward neuroglobin, Cys-SSH was generated in situ by reaction of γ-cystathionase with cystine (46). Under aerobic conditions, a small decrease in the 412 nm Soret absorption was seen, which was accompanied by small increases at 538 and 575 nm (Fig. 14A). In contrast, marked changes were observed in the spectrum of sulfide treated H64A neuroglobin (Fig. 14B). The Soret peak shifted from 406 to 422 nm with a simultaneous decrease in intensity, and the α/β bands increased in intensity at 543 and 570 nm. Under anaerobic conditions, the Soret peak of the wild-type protein shifted to 424 nm, and the β/α bands sharpened at 530 and 558 nm appear, indicating conversion to FeII-Ngb (Fig. 14C). The spectrum of H64A neuroglobin was similar under aerobic and anaerobic conditions (Fig. 14, B and D).
Figure 14.
Spectral changes in FeIII-Ngb (A and C) and H64A neuroglobin (B and D) induced by Cys-SSH. A and C, FeIII-Ngb (10 μm) in 100 mm HEPES buffer, pH 7.4, was mixed with human CSE (2 μm) and cystine (1 mm) at 37 °C under aerobic (A) or anaerobic (C) conditions. B and D, spectral changes in FeIII-Ngb H64A (9 μm) in 100 mm HEPES buffer, pH 7.4, upon mixing with human CSE (2 μm) and cystine (1 mm) at 37 °C under aerobic (B) and anaerobic (D) conditions. In all panels, the spectra were recorded every minute, and the final spectrum at 60 min is shown in red.
Discussion
Neuroglobin is a divergent member of the globin superfamily whose cellular role continues to be a matter of debate (47). It is up-regulated in response to hypoxia and plays a role in protecting neurons against hypoxic damage (48). Neuroglobin is unusual in several respects, including the presence of a commodious cavity around its 6-coordinate heme (10) that is not present in hemoglobin or myoglobin (Fig. 1A). Spectroscopic studies have revealed the presence of heme orientational isomers and complex kinetics for binding exogenous ligands, which is slowed by displacement of the endogenous distal heme ligand, His64 (6, 12, 40, 41, 49). The oxidation state of a pair of cysteine residues (Cys46 and Cys55 in the human sequence), modulates the O2 affinity of neuroglobin, decreasing it ∼10-fold when the cysteines are reduced (38).
The interaction between neuroglobin and CO, reactive oxygen and reactive nitrogen species that accumulate during ischemia reperfusion has been studied (6, 41, 50). In contrast, the interaction between neuroglobin and H2S, which also accumulates during hypoxia (51) due to inhibition of the O2-dependent route for its disposal, has been minimally investigated (15). Treatment of FeIII-Ngb with NaHS under anaerobic conditions reportedly resulted in a shift in the Soret maximum from 412 to 426 nm (changes in the visible region of the spectrum were not reported) (15). This spectral change was unlike what we observed under similar conditions (Fig. 2) but like the changes that we saw when anaerobic FeIII-Ngb was mixed with Cys-SSH (Fig. 14C). The spectrum of FeIII-Ngb exposed to Cys-SSH under anaerobic conditions showed absorption maxima at 424, 530, and 558 nm, consistent with reduction to FeII-Ngb. Hydrodisulfides are better reducing agents than the corresponding thiols and can reduce heme iron (52). Hence, it is likely that Cys-SSH reduced FeIII-Ngb via an outer-sphere process under these conditions. These results lead us to conclude that the interaction of FeIII-Ngb with spurious sulfide oxidation products was characterized previously (15). In contrast to Na2S used as a sulfide source in our study, NaHS, used in the previous study, is known to be highly contaminated with oxidized sulfide products (53).
When FeIII-Ngb was treated with H2S, we observed small changes in the absorption spectrum over a 30-min period, during which time the Soret peak shifted from 412 to 415 nm (Fig. 2A). The resonance Raman spectra showed a slow conversion from the FeIII to FeII species, and a mixture of oxidation states was present at 30 min (Fig. 8). In contrast, the EPR spectrum showed a rapid loss of paramagnetic signal at 5 min, and ∼10% of the original spin concentration remained at 30 min. Collectively, these spectroscopic data suggest the presence of a mixture of (a) diamagnetic and paramagnetic states and (b) FeIII and FeII species, albeit their relative proportions as reported by EPR and resonance Raman spectroscopy appear to be different. The X-ray absorption near edge structure (XANES) data are consistent with the presence of a mixture of FeIII and FeII oxidation states both in the presence and absence of sulfide, which indicates the occurrence of photoreduction (Table 2). The EXAFS data, however, do not support direct sulfur coordination to the iron in wild-type neuroglobin (Fig. 13A). It is important to note that the samples for XAS data collection were prepared under very different conditions in which the concentration of protein was high relative to O2, as described under “Experimental procedures.” The low-energy Raman data show little change upon exposure of wild-type neuroglobin to sulfide, providing further evidence that sulfide is not directly coordinated to the heme iron.
The chemistry of heme-dependent sulfide oxidation to a mixture of products is complex and poorly understood. To explain the spectroscopic data, we postulate that sulfide binding to the heme pocket in neuroglobin induces O2-dependent formation of reactive sulfur/oxygen radical species that is spin-coupled to FeIII-Ngb, accounting for the initial loss of the EPR signal but retention of the Fe3+ oxidation state marker as the major species at 5 and 15 min (Fig. 8). Detection of reactive sulfur/oxygen species by cryo-MS (Table 1) and limited O2 consumption during the reaction (Fig. 4A) are consistent with this model. Spectroscopic studies provide evidence for the electrostatic stabilization of CO bound to neuroglobin as an Fe=C=O–X+ species in which X+ could be His64 and/or Lys67 (41). These residues could potentially also stabilize sulfide and reactive sulfur species intermediates that are formed in the heme pocket. An alternative explanation to account for the apparent discrepancy at the early time points between the EPR (showing predominance of diamagnetic heme) and the resonance Raman (showing predominance of ferric heme) data is formation of FeII-O2-Ngb. In analogy to FeII-O2-myoglobin (54), FeII-O2-Ngb should exhibit a ferric ν4 signature while being EPR-silent. However, a significant accumulation of an FeII-O2 species seems unlikely because similar absorbance changes were seen under aerobic and anaerobic (not shown) conditions and because FeII-O2-Ngb undergoes fairly rapid autoxidation (6).
Prolonged incubation (>60 min) of FeIII-Ngb with sulfide resulted in the full conversion of ferric to ferrous heme, as indicated by the 1362 cm−1 oxidation state marker in the resonance Raman spectrum (Fig. 8). However, the UV-visible spectra at 30 and 60 min (not shown) were the same and do not correspond to the spectrum described for deoxy-ferrous neuroglobin (i.e. FeII-Ngb), which exhibits a Soret peak at 426 nm and sharp β/α bands at 528 and 558 nm (6). These results indicate that the 415 nm spectrum obtained in the presence of sulfide (Fig. 2A) represents a mixture of species, which cannot be assigned at present. We can, however, rule out the presence of a dominant iron-coordinated sulfur species, which is associated with a significant red shift in the Soret peak. Such peak shifts were seen with myoglobin (409 → 428 nm) and hemoglobin (405 → 423 nm) together with sharpening of the α/β bands (27, 28). As described below, spectral changes similar to those of myoglobin and hemoglobin are observed with the H64A mutant of neuroglobin.
The bimolecular rate constant for the interaction of sulfide with FeIII-Ngb (13.8 m−1 s−1 at pH 7.4 and 25 °C) is considerably smaller than for sulfide binding to hemoglobin (3.2 × 10³ m−1 s−1) or myoglobin (1.6 × 10⁴ m−1 s−1). The difference in the kon values for sulfide binding to the three globins is probably due to the difference in their heme iron coordination states. We note that reduction of the Cys46–Cys55 disulfide bond in neuroglobin stabilizes the 6-coordinate state of the heme iron and decreases its affinity for exogenous ligands (38). Under the conditions of our experiment, where the sulfide concentration was high, the Cys46–Cys55 pair should have been in the reduced dithiol state.
Sulfide oxidation products (i.e. thiosulfate and polysulfides) were detected, albeit in lower amounts with neuroglobin (Fig. 4A) than seen with myoglobin and hemoglobin (27, 28). These results suggest that sulfide oxidation and oxygenation products can be formed even in the absence of direct coordination of the sulfur to the heme. However, we cannot rule out that a small proportion of FeIII-Ngb exists with direct sulfide coordination and is responsible for the observed oxidation products, which do not accumulate above background levels in the absence of O2 (Fig. 4C).
Overall, the reaction and reactivity of sulfide with neuroglobin are substantially different from those of hemoglobin and myoglobin (27, 28), which we attribute to the bis-histidine coordination of the heme iron in neuroglobin. To investigate the influence of the distal histidine on sulfide interaction with neuroglobin, His64 was replaced by alanine. The latter substitution resulted in a Soret peak shift from 412 nm in wild-type FeIII-Ngb to 406 nm. In the presence of sulfide, the Soret peak of the mutant shifted from 406 to 422 nm, and sharpening of the β/α bands at 541 and 572 nm was seen (Fig. 2B). These spectral features are most similar to those of sulfide-treated hemoglobin (423, 541, and 577 nm) (27). Coordination of thiols to ferric hemes generally lowers the thiol pKa by ∼4 units (55), predicting a pKa of ∼3 for sulfide bound to heme. Hence, HS−-FeIII-H64A Ngb is expected to be the initial complex that is formed with a Soret peak at 422 nm.
The EXAFS data provide evidence for sulfur coordination to iron with an Fe–S bond distance of 2.23 Å (Table 2). As with the wild-type protein, a mixture of iron oxidation states was observed by XANES spectroscopy for the mutant with and without H2S treatment (Fig. 12B), indicating photoreduction. The H64A mutant showed evidence for sulfur coordination to ferric iron in the presence of Cys-SSH (Fig. 14, B and D). The Soret peak shifted from 406 to 422 nm, and the α/β bands were observed at 570 and 543 nm. It is unclear whether Cys-SSH was directly coordinated to the iron in this sample or whether H2S produced by spontaneous decomposition of Cys-SSH (Reaction 1) as reported previously (46), was coordinated to the ferric iron.
Interestingly, the spectrum of H64A FeIII-Ngb in the presence of cysteine was similar to that observed in the presence of Cys-SSH (not shown), indicating that the distal heme pocket of neuroglobin can accommodate cysteine and, presumably, Cys-SSH, supporting direct coordination of the persulfide to the ferric iron.
In contrast to myoglobin and hemoglobin, the 422 nm Soret band observed with H64A neuroglobin was not stable and, after ∼5 min, started to shift to 419 nm with a slight increase in intensity (Fig. 2B). It is unclear what the 419 nm band represents, and it is likely to be a mixture of species. We speculate that the accumulation of catenated sulfur oxidation products coordinated to the heme iron might induce the slight blue shift. The H64A mutant exhibited a 4000-fold greater reactivity toward H2S (kon = 58.8 ± 3.8 × 10³ m−1 s−1) than wild-type neuroglobin. A similar enhancement of nitrite reduction was reported by mutation of the distal histidine residue to leucine or glutamine (7). The 700-fold higher koff for sulfide for H64A versus wild-type neuroglobin is consistent with the role of the distal histidine residue in stabilizing sulfide, as was previously noted with CO in the closed conformation of neuroglobin (41).
The EPR spectrum of the H64A mutant shows high-spin iron, consistent with the presence of 5-coordinate ferric heme (Fig. 7). The addition of sulfide resulted in the appearance of a complex mixture of low-spin ferric species within 5 min and a progressive loss of spin intensity, indicating conversion to an EPR-silent species. Multiple species are present in the EPR spectrum of sulfide-treated H64A neuroglobin (also seen in the 30- and 60-min spectra of the wild-type protein (Fig. 6)). This heterogeneity probably reflects distinct stable conformational substates of the distal pocket that have been spectroscopically characterized previously (12). Additionally, with the H64A mutant, the heterogeneity could reflect the presence of a mixture of oxidized sulfur species coordinated to the ferric iron. Similar EPR spectra have been reported for the multiheme protein SoxXA involved in bacterial sulfur oxidation (55). The complexity in SoxXA spectrum arises from the simultaneous presence of three hemes that are coordinated by histidine on one side and to a thiol, persulfide, or methionine on the other (56).
Interestingly, the resonance Raman spectra of the H64A mutant indicates that the iron remains in the ferric state upon sulfide addition for the duration of the experiment (Fig. 9), whereas the EPR spectrum shows a loss of ∼50% of the spin concentration at 60 min (Fig. 7). However, the low quality of the resonance Raman spectra due to the high background fluorescence does not allow us to unequivocally exclude the presence of a small amount of ferrous heme between 15 and 60 min. In the low-energy region of the resonance Raman spectrum, a prominent 495 cm−1 band was observed upon the addition of sulfide (Fig. 11). We assign this band to the S–S vibration of an iron-bound hydropolysulfide product. This assignment is based on its similarity to the 498 cm−1 band in a Cys-SS-ligated [2Fe-2S]2+ cluster in the FNR transcriptional factor, which was assigned using 34S isotope labeling to the S-S stretching mode of the persulfide (57). In the resonance Raman spectrum of Na2S4, a 482 cm−1 band was assigned to the S-S vibration (58).
The H64A mutant catalyzed production of higher concentrations of sulfide oxidation products paralleled by higher O2 consumption compared with wild-type neuroglobin (Fig. 4B). On the other hand, only stoichiometric loss of sulfide was observed under anaerobic conditions and corresponded to the heme iron concentration (Fig. 4D). MS analysis revealed a rich mixture of sulfide oxidation chemotypes with 1–4 oxygens and hydropolysulfides with 2–6 sulfur atoms (Table 1). Whereas the reaction of wild-type neuroglobin was associated with oxygenation at a single sulfur (HSO•, HSO4−, HS2O3−), the H64A mutant was associated with hydropolysulfides (H2S2, H2S3, H2S4, H2S5, and H2S6) with a subset containing oxygenated sulfur (HSO3, HS2O3−, H2S3O3, and H2S4O3). In fact, the only product observed in common between wild-type and H64A neuroglobin was thiosulfate (HS2O3−).
The combination of spectroscopic approaches used in this study allows us to conclude that the reaction of FeIII-Ngb with sulfide is very different from that of the ferric forms of myoglobin, hemoglobin, and H64A neuroglobin and also different from that previously reported for neuroglobin (15). We speculate that with wild-type neuroglobin, outer-sphere electron transfer reactions involving sulfide, oxygen, and ferric iron lead to the limited formation of sulfide oxidation products. The redox potentials for the S•,H+/HS− couple and the ½O2, 2H+/H2O couple are +920 mV (59) and +815 mV versus the standard hydrogen electrode at pH 7. The redox potential for the Fe3+/Fe2+ couple in neuroglobin is −129 mV (6). The large excess of sulfide over FeIII-Ngb probably allows the mismatch in the redox potentials to be overcome in the in vitro experiments but suggests that this reaction is unlikely to occur in vivo. In contrast, persulfides are more reactive toward ferric neuroglobin, and under anaerobic conditions, accumulation of FeII-Ngb is observed (Fig. 14).
In summary, our results indicate that FeIII-Ngb is relatively inert toward oxidizing sulfide, limiting the potential biological relevance of this interaction, especially when the cysteines are in the reduced dithiol state. The reactivity of wild-type neuroglobin toward H2S could, however, increase under cellular redox conditions that result in oxidation of both the cysteine pair and the heme iron. In the dithiol state, the O2 affinity of human neuroglobin is reduced 10-fold primarily due to a decrease in the dissociation rate of the distal histidine ligand (38). By analogy, the presence of the disulfide bond should increase the affinity of FeIII-Ngb for H2S. Preservation of the disulfide bond in the presence of H2S is experimentally difficult to achieve in vitro, although it might be possible in vivo. Under these conditions, the interaction of H2S with neuroglobin is expected to be enhanced and could lead to sulfide oxidation. Unlike the globins with 5-coordinate hemes, including the H64A mutant of neuroglobin, accumulation of sulfide-coordinated heme is not observed with wild-type neuroglobin. The array of catenated sulfide oxidation products generated that were trapped by cryo-MS provides evidence for the rich ferric iron-dependent sulfide oxidation chemistry that can be catalyzed by iron-containing proteins. In contrast to H2S, Cys-SSH results in reduction FeIII-Ngb and accumulation of the bis-His coordinated ferrous species under anaerobic conditions.
Experimental procedures
Materials
Na2S nonahydrate, l-cystine, glutathione, H2S solution (0.8 m) in tetrahydrofuran, meta-phosphoric acid, and potassium ferricyanide were from Sigma. Monobromobimane was from Molecular Probes (Grand Island, NY). Dithiothreitol, isopropyl β-d-thiogalactopyranoside was from Gold Biotechnology (St. Louis, MO), and δ-aminolevulinic acid was from Frontier Scientific (Logan, UT). Glutathione-agarose was from Thermo Scientific (Waltham, MA). All other chemicals were reagent grade and were purchased from Fisher. Recombinant human cystathionine γ-lyase (CSE) was prepared as described previously (60). Protein molecular weight standards were from Bio-Rad.
Purification of human neuroglobin
A thrombin-cleavable GST tag was introduced at the N terminus of neuroglobin. For this, the neuroglobin cDNA was amplified by PCR using a pET28a plasmid containing the human neuroglobin cDNA as template (generously provided by Dr. Gladwin, University of Pittsburgh), using the following primers: 5′-TTATAGGATCCATGGAGCGCCCGGAG-3′ containing the BamHI restriction site and 5′-TTATTCTCGAGTTACTCGCCATCCCAGCC-3′ with the XhoI restriction site. The PCR product was cut with BamHI and XhoI and ligated into the pEGX19 plasmid. The H64A mutation was introduced by site directed mutagenesis using the QuikChange kit with the following primers: 5′-TCGCCTGAGTTCCTGGACGCCATCAGGAAGGTGATGCT-3′ and 5′-AGCATCACCTTCCTGATGGCGTCCAGGAACTCAGGCGA-3′. The presence of the mutation was confirmed by nucleotide sequencing (University of Michigan DNA Sequencing Core).
GST-tagged neuroglobin was expressed in Escherichia coli BL21(DE3) as described previously with some modifications (8). Briefly, starting cultures were grown overnight at 37 °C in Luria-Bertani medium containing 100 μg/ml ampicillin. The initial culture (1 ml) was transferred to 1 liter of Terrific Broth medium (with 100 μg/ml ampicillin) and grown at 37 °C until the A600 reached 0.6–0.8. Then 0.4 mm δ-aminolevulinic acid was added, protein expression was induced by 0.1 mm isopropyl β-d-thiogalactopyranoside, and the culture was grown for 18–20 h at 25 °C. The cells were harvested by centrifugation, and the cell pellet was stored at −80 °C until further use.
The cell pellet was suspended (5 ml/g wet weight) in lysis buffer (50 mm MOPS, pH 7.0, 0.5 mm DTT, 1 mm EDTA, 1 mm phenylmethylsulfonyl fluoride, and 2 mg/ml lysozyme) and stirred for 20 min at 4 °C. The cells were disrupted by sonication and centrifuged at 38,500 × g for 45 min. The supernatant was applied to a 10-ml glutathione-agarose column. The column was washed with 100 ml of phosphate-buffered saline (140 mm NaCl, 10 mm Na2HPO4, 2.8 mm KH2PO4, 1.8 mm KCl), pH 7.3, and GST-tagged neuroglobin was eluted with 10 mm glutathione in 50 mm Tris, pH 8.0, and concentrated to 10 ml with Amicon filters (MWCO = 10,000). Thrombin (5 units/mg of protein) was added to the protein solution, which was dialyzed overnight at 4 °C. Free GST was removed by applying the protein solution onto a GST trap column (GE Healthcare, Uppsala, Sweden). Cleaved recombinant neuroglobin was present in the column eluant and was concentrated using an Amicon filter (MWCO = 10,000). The protein was further purified by size-exclusion chromatography on a 1.6 × 60-cm Hiload Superdex 200 column (GE Healthcare) pre-equilibrated with phosphate-buffered saline. Fractions containing neuroglobin were concentrated and flash-frozen in liquid nitrogen and stored at −80 °C. The yield of wild-type and H64A neuroglobin was 25 mg and 9 mg/liter of culture, respectively.
Before experiments, the heme iron was converted to the ferric state by mixing with a 1.5-fold molar excess of potassium ferricyanide for 5 min at 0 °C. Ferricyanide was removed by filtration using a 10-ml desalting column (MWCO = 6000; Bio-Rad), pre-equilibrated with 100 mm HEPES buffer, pH 7.4.
Kinetics of sulfide binding to neuroglobin
The interaction between wild-type neuroglobin (5 μm) in 100 mm HEPES, pH 7.4, and Na2S (0.05–1.5 mm) was monitored at 25 °C under aerobic conditions. Binding of sulfide to H64A neuroglobin was carried out under anaerobic conditions using an Applied Photophysics stopped-flow spectrophotometer (SX.MV18) placed inside a glove box (Vacuum Atmospheres Co., Hawthorne, CA) with an O2 concentration below 0.7 ppm. A solution of H64A neuroglobin (5 μm) in 100 mm HEPES, pH 7.4, was mixed with Na2S solution (0.025–0.5 mm) to final concentrations ranging from 25 to 500 μm at 25 °C. Biphasic time-dependent changes in absorbance at 412 nm (wild-type neuroglobin) and 406 nm (H64A neuroglobin) were observed and fitted using Equation 1 to obtain the rate constants associated with each reaction phase. In Equation 1, A1 and A2 represent the amplitude changes associated with the two phases, k1 and k2 represent the corresponding rate constants, and y0 is the final absorbance.
| (Eq. 1) |
The values for koff, kon, and KD, were obtained by replotting the dependence of kon on the concentration of sulfide.
Dependence of sulfide-binding kinetics on pH
Neuroglobin (5 μm) in 100 mm aerobic buffer, pH ranging from 5.5 to 9.0 was mixed with 1 mm Na2S solution in the same buffer. Tris was used for pH 9.0, 8.5, 8.0, and 7.8; HEPES for pH 7.75, 7.5, and 7.0; and MES for 6.5, 6.0, and 5.5. The change in absorbance was monitored at 412 nm following the addition of sulfide, and the kinetic data were fit to Equation 1. Due to the faster kinetics of sulfide binding at lower pH, the experiments between pH 5.5 and 6.5 were performed on a stopped-flow spectrophotometer. The pH dependence of sulfide binding to H64A neuroglobin was monitored in a stopped-flow spectrophotometer at 406 nm. The data were fitted to Equation 1 to obtain an estimate of k1, the rate constant for the fast phase. The initial velocity (v0) for the fast phase was then obtained using the relationship, v0 = k1 × A1. The dependence of v0 on pH was fitted to Equation 2 to obtain the pKa value.
| (Eq. 2) |
Reaction of neuroglobin with cysteine persulfide
Neuroglobin (10 μm wild type or H64A mutant) was mixed with CSE (2 μm) in aerobic 100 mm HEPES buffer, pH 7.4, at 37 °C. Persulfide formation was initiated by 1 mm cystine, and the absorbance was monitored from 300 to 750 nm. For monitoring the reaction under anaerobic conditions, it was set up similarly but in an anaerobic chamber, and anaerobic reagents were used.
Analysis of neuroglobin-catalyzed sulfide oxidation
Oxygen consumption was monitored using a Clark O2 electrode. For this, neuroglobin (25 μm) in 100 mm HEPES buffer, pH 7.4, was placed in a 1.5-ml Gilson type chamber, and Na2S (1 mm in the same buffer) was injected into the chamber. O2 consumption was recorded using a chart recorder.
The sulfide oxidation products, sulfite and thiosulfate, were detected using an HPLC method, and polysulfides were measured using cold cyanolysis as described previously (27). For this, neuroglobin (50 μm, 1 ml) was incubated with or without Na2S (1 mm) in aerobic 100 mm HEPES, pH 7.4, at 25 °C in a closed 1.5-ml sample tube. Aliquots were removed at the desired time points. For HPLC analysis, aliquots (45 μl) were mixed with 2.5 μl of 1 m Tris, pH 9.0, and 2.5 μl of 60 mm monobromobimane in DMSO in black 0.5-ml sample tubes and incubated at room temperature for 10 min. Then 100 μl of meta-phosphoric acid (16.8 mg/ml in H2O) was added, the mixture was centrifuged for 3 min at 15,900 × g, and the supernatants were stored at −80 °C until analysis.
HPLC analysis was performed using a Zorbax Eclipse XDB C-18 column (4.6 × 150 mm) using the following solvent system: Buffer A, 100 mm ammonium acetate, pH 4.75, 10% MeOH (v/v); Buffer B, MeOH + 10% 100 mm ammonium acetate, pH 4.75 (v/v). The following gradient was used for sample elution: 0–10 min, linear gradient of 0–20% B; 10–15 min, linear gradient of 20–50% B; 15–20 min, isocratic 50% B; 20–22 min, 50–100% B; 22–27 min, isocratic 100% B; 27–29 min, linear 100 to 0% B; 29–35 min, isocratic 100% A. The bimane adducts of sulfite and thiosulfate were detected by fluorescence emission at 490 nm following excitation at 390 nm. The products were quantified using calibration curves generated with the respective standards.
For determining polysulfide concentrations, 100-μl aliquots were incubated with 50 μl of 62.5 mm potassium cyanide in 125 mm ammonium hydroxide for 45 min at 25 °C. Then 150 μl of Goldstein solution (1.25 g of Fe(NO3)3·9H2O in 50 ml of 17% HNO3) was added, mixed, and centrifuged for 5 min at 15,900 × g. The absorbance at 460 nm was recorded, and the concentration of polysulfides was determined using a calibration curve generated with potassium thiocyanate.
EPR spectroscopy
EPR spectra were recorded on a Bruker EMX 300 equipped with a Bruker 4102-ST cavity and an Oxford liquid helium cryostat. Spectra were measured at 10 K with the following parameters: 9.34-GHz microwave frequency; power, 10 milliwatts; modulation amplitude, 7.5 G; modulation frequency, 100 kHz; 5000-G sweep width centered at 3000 G; conversion time, 164 ms; time constant, 82 ms. FeIII-Ngb (400 μm) and H64A FeIII-Ngb (500 μm) samples were prepared aerobically in 100 mm HEPES, pH 7.4, containing 20% glycerol. Na2S prepared in the same buffer was added to a final concentration of 10 mm. At the desired time points, 300 μl of the solution was transferred to an EPR tube, and the tube was sealed with a silicon septum and frozen in liquid nitrogen. Low spin signals were quantified using a 1 mm copper EDTA solution. Low spin (S = ½) signals were fitted with the Easyspin toolbox (61) using the parameters described in supplemental Tables S1 and S2.
Resonance Raman spectroscopy
The resonance Raman measurements were performed using the 413.13 nm excitation line from a Kr+ gas ion laser (Spectra Physics Beam Lok 2060-RS). The frozen samples were prepared in EPR tubes, which were placed in a liquid N2-filled EPR cold finger Dewar for all measurements or stored in a Dewar filled with liquid N2 in the dark until further use. Raman spectra were recorded at 77 K using an Acton two-stage TriVista 555 monochromator connected to a liquid nitrogen-cooled CCD camera (Princeton instruments Spec-10:400B/LN). The experiments were performed at different exposure times and accumulations due to the background fluorescence associated with neuroglobin, which increased with the reaction time. Typical laser powers were in the 10–30-milliwatt range. Relative wavenumbers (Raman shift) were calibrated using sodium sulfate (Na2SO4).
Mass spectrometry
MS measurements were performed on a UHR-TOF Bruker Daltonik maXis 4G (Bremen, Germany), coupled to a Bruker cryospray unit, an ESI-TOF-MS with a resolution of at least 40,000 full width at half-maximum. Detection was in the positive-ion mode. The flow rates were 300 μl/h. The drying gas (N2) was held at 10 °C, and the spray gas was held at 10 °C. The machine was calibrated before every experiment by direct infusion of the Agilent ESI-TOF low concentration tuning mixture, which provided an m/z range of singly charged peaks up to 2,700 Da in both ion modes. Wild-type or H64A neuroglobin (50 μl of 400 μm) in 200 mm ammonium carbonate buffer, pH 7.4, was mixed with 4 mm H2S (from 0.8 m H2S in tetrahydrofuran), diluted 10-fold with nano-pure water, and sprayed continuously into the MS. The spectra are recorded over 45 min. As a control, covalent modification of the protein or the heme cofactor was investigated by mixing 50 μm neuroglobin in 20 mm ammonium carbonate buffer, pH 7.4, with 500 μm H2S for 45 min. Samples were then mixed with acetonitrile (50/50, v/v) and formic acid (0.5%) and sprayed at 200 °C with a flow rate of 180 μl/h.
XAS analysis
Samples were prepared by mixing wild-type or H64A neuroglobin (1 mm in iron concentration) in 100 mm HEPES, pH 7.4, with H2S (20 mm final concentration) in tetrahydrofuran and incubated for 30 min at 25 °C. An equivalent volume of tetrahydrofuran only was added to the control sample. Glycerol (30% (v/v) final concentration) was added to the samples, which were then loaded into Kapton-wrapped lucite XAS sample cells and frozen quickly in liquid N2 until data collection at the beamline.
XAS data were collected at the Stanford Synchrotron Radiation Laboratory on beamlines 7-3 and 9-3. Beamline 7-3 is equipped with a single rhodium-coated silicon mirror and an Si[220] double crystal monochromator, and harmonic rejection was achieved by detuning the monochromator 50%. The 9-3 beamline is equipped with an Si[220] double crystal monochromator and a harmonic rejection mirror, so spectra were collected under fully tuned conditions. Samples were maintained at 10 K using Oxford Instrument continuous-flow liquid helium cryostats at both beamline locations. Protein fluorescence excitation spectra were collected using a 30-element germanium solid-state array detector at 7-3 and a 100-element germanium solid-state detector at 9-3. XAS spectra were measured using 5-eV steps in the pre-edge regions (6900–7094 eV), 0.25 eV steps in the edge regions (7095–7135 eV), and 0.05 Å−1 increments in the EXAFS region (to k = 13.5 Å−1), integrating from 1 to 20 s in a k3-weighted manner for a total scan length of ∼40 min. X-ray energies were calibrated by collecting an iron foil absorption spectrum simultaneously with collection of protein data. The first inflection point for the iron foil edge was assigned at 7111.3 eV. Each fluorescence channel of each scan was examined for spectral anomalies before averaging, and spectra were closely monitored for photoreduction. Spectra collected at 7-3 represent the average of 7–8 scans, whereas spectra collected at 9-3 represent the average of 4–5 scans.
XAS data processing and analysis were performed following protocols outlined previously (62). EXAFS spectra were simulated using both filtered and unfiltered data; however, simulation results are presented only for fits to raw (unfiltered) data. Simulation protocols and criteria for determining the best fit have been described previously (63).
Author contributions
M. R., J. K., B. E. L., and M. R. F. performed the experiments. N. L. helped analyze the resonance Raman data and co-wrote the manuscript. T. S. helped analyze the XAS data and co-wrote the manuscript. All authors analyzed the experiments performed in their laboratories. M. R. and R. B were primarily responsible for writing the manuscript. All authors edited and approved the final version of the manuscript.
Supplementary Material
Acknowledgments
XAS studies were performed at the Stanford Synchrotron Radiation Lightsource, which is a national user facility operated by Stanford University on behalf of the Department of Energy, Office of Basic Energy Sciences. The Stanford Synchrotron Radiation Lightsource Structural Molecular Biology Program is supported by the Department of Energy, Office of Biological and Environmental Research, and by the National Center for Research Resources, Biomedical Technology Program.
This work was supported in part by National Institutes of Health Grants GM112455 (to R. B.) and DK068139 (to T. L. S.). The authors declare that they have no conflicts of interest with the contents of this article. The content is solely the responsibility of the authors and does not necessarily represent the official views of the National Institutes of Health.
This article contains supplemental Tables S1 and S2 and Figs. S1–S3.
- FeII-Ngb
- ferrous neuroglobin
- FeIII-Ngb
- ferric neuroglobin
- Cys-SSH
- cysteine persulfide
- ESI
- electrospray ionization
- MWCO
- molecular weight cut-off
- XAS
- X-ray absorption spectroscopy
- EXAFS
- extended X-ray absorption fine structure
- XANES
- X-ray absorption near edge structure
- CSE
- cystathionine γ-lyase.
References
- 1. Burmester T., Weich B., Reinhardt S., and Hankeln T. (2000) A vertebrate globin expressed in the brain. Nature 407, 520–523 [DOI] [PubMed] [Google Scholar]
- 2. Fabrizius A., Andre D., Laufs T., Bicker A., Reuss S., Porto E., Burmester T., and Hankeln T. (2016) Critical re-evaluation of neuroglobin expression reveals conserved patterns among mammals. Neuroscience 337, 339–354 [DOI] [PubMed] [Google Scholar]
- 3. Reuss S., Saaler-Reinhardt S., Weich B., Wystub S., Reuss M. H., Burmester T., and Hankeln T. (2002) Expression analysis of neuroglobin mRNA in rodent tissues. Neuroscience 115, 645–656 [DOI] [PubMed] [Google Scholar]
- 4. Geuens E., Brouns I., Flamez D., Dewilde S., Timmermans J. P., and Moens L. (2003) A globin in the nucleus! J. Biol. Chem. 278, 30417–30420 [DOI] [PubMed] [Google Scholar]
- 5. Burmester T., and Hankeln T. (2009) What is the function of neuroglobin? J. Exp. Biol. 212, 1423–1428 [DOI] [PubMed] [Google Scholar]
- 6. Dewilde S., Kiger L., Burmester T., Hankeln T., Baudin-Creuza V., Aerts T., Marden M. C., Caubergs R., and Moens L. (2001) Biochemical characterization and ligand binding properties of neuroglobin, a novel member of the globin family. J. Biol. Chem. 276, 38949–38955 [DOI] [PubMed] [Google Scholar]
- 7. Tiso M., Tejero J., Basu S., Azarov I., Wang X., Simplaceanu V., Frizzell S., Jayaraman T., Geary L., Shapiro C., Ho C., Shiva S., Kim-Shapiro D. B., and Gladwin M. T. (2011) Human neuroglobin functions as a redox-regulated nitrite reductase. J. Biol. Chem. 286, 18277–18289 [DOI] [PMC free article] [PubMed] [Google Scholar]
- 8. Tejero J., Sparacino-Watkins C. E., Ragireddy V., Frizzell S., and Gladwin M. T. (2015) Exploring the mechanisms of the reductase activity of neuroglobin by site-directed mutagenesis of the heme distal pocket. Biochemistry 54, 722–733 [DOI] [PMC free article] [PubMed] [Google Scholar]
- 9. Fordel E., Thijs L., Martinet W., Lenjou M., Laufs T., Van Bockstaele D., Moens L., and Dewilde S. (2006) Neuroglobin and cytoglobin overexpression protects human SH-SY5Y neuroblastoma cells against oxidative stress-induced cell death. Neurosci. Lett. 410, 146–151 [DOI] [PubMed] [Google Scholar]
- 10. Pesce A., Dewilde S., Nardini M., Moens L., Ascenzi P., Hankeln T., Burmester T., and Bolognesi M. (2003) Human brain neuroglobin structure reveals a distinct mode of controlling oxygen affinity. Structure 11, 1087–1095 [DOI] [PubMed] [Google Scholar]
- 11. Trent J. T. 3rd, Watts R. A., and Hargrove M. S. (2001) Human neuroglobin, a hexacoordinate hemoglobin that reversibly binds oxygen. J. Biol. Chem. 276, 30106–30110 [DOI] [PubMed] [Google Scholar]
- 12. Kriegl J. M., Bhattacharyya A. J., Nienhaus K., Deng P., Minkow O., and Nienhaus G. U. (2002) Ligand binding and protein dynamics in neuroglobin. Proc. Natl. Acad. Sci. U.S.A. 99, 7992–7997 [DOI] [PMC free article] [PubMed] [Google Scholar]
- 13. Van Doorslaer S., Dewilde S., Kiger L., Nistor S. V., Goovaerts E., Marden M. C., and Moens L. (2003) Nitric oxide binding properties of neuroglobin. A characterization by EPR and flash photolysis. J. Biol. Chem. 278, 4919–4925 [DOI] [PubMed] [Google Scholar]
- 14. Nienhaus K., Kriegl J. M., and Nienhaus G. U. (2004) Structural dynamics in the active site of murine neuroglobin and its effects on ligand binding. J. Biol. Chem. 279, 22944–22952 [DOI] [PubMed] [Google Scholar]
- 15. Brittain T., Yosaatmadja Y., and Henty K. (2008) The interaction of human neuroglobin with hydrogen sulphide. IUBMB Life 60, 135–138 [DOI] [PubMed] [Google Scholar]
- 16. Pesce A., De Sanctis D., Nardini M., Dewilde S., Moens L., Hankeln T., Burmester T., Ascenzi P., and Bolognesi M. (2004) Reversible hexa- to penta-coordination of the heme Fe atom modulates ligand binding properties of neuroglobin and cytoglobin. IUBMB Life 56, 657–664 [DOI] [PubMed] [Google Scholar]
- 17. Kimura H. (2002) Hydrogen sulfide as a neuromodulator. Mol. Neurobiol. 26, 13–19 [DOI] [PubMed] [Google Scholar]
- 18. Kabil O., and Banerjee R. (2010) The redox biochemistry of hydrogen sulfide. J. Biol. Chem. 285, 21903–21907 [DOI] [PMC free article] [PubMed] [Google Scholar]
- 19. Chiku T., Padovani D., Zhu W., Singh S., Vitvitsky V., and Banerjee R. (2009) H2S biogenesis by cystathionine γ-lyase leads to the novel sulfur metabolites, lanthionine and homolanthionine, and is responsive to the grade of hyperhomocysteinemia. J. Biol. Chem. 284, 11601–11612 [DOI] [PMC free article] [PubMed] [Google Scholar]
- 20. Singh S., Padovani D., Leslie R. A., Chiku T., and Banerjee R. (2009) Relative contributions of cystathionine β-synthase and γ-cystathionase to H2S biogenesis via alternative trans-sulfuration reactions. J. Biol. Chem. 284, 22457–22466 [DOI] [PMC free article] [PubMed] [Google Scholar]
- 21. Shibuya N., Tanaka M., Yoshida M., Ogasawara Y., Togawa T., Ishii K., and Kimura H. (2009) 3-Mercaptopyruvate sulfurtransferase produces hydrogen sulfide and bound sulfane sulfur in the brain. Antioxid. Redox Signal. 11, 703–714 [DOI] [PubMed] [Google Scholar]
- 22. Yadav P. K., Yamada K., Chiku T., Koutmos M., and Banerjee R. (2013) Structure and kinetic analysis of H2S production by human mercaptopyruvate sulfurtransferase. J. Biol. Chem. 288, 20002–20013 [DOI] [PMC free article] [PubMed] [Google Scholar]
- 23. Petersen L. C. (1977) The effect of inhibitors on the oxygen kinetics of cytochrome c oxidase. Biochim. Biophys. Acta 460, 299–307 [DOI] [PubMed] [Google Scholar]
- 24. Hildebrandt T. M., and Grieshaber M. K. (2008) Three enzymatic activities catalyze the oxidation of sulfide to thiosulfate in mammalian and invertebrate mitochondria. FEBS J. 275, 3352–3361 [DOI] [PubMed] [Google Scholar]
- 25. Libiad M., Yadav P. K., Vitvitsky V., Martinov M., and Banerjee R. (2014) Organization of the human mitochondrial H2S oxidation pathway. J. Biol. Chem. 289, 30901–30910 [DOI] [PMC free article] [PubMed] [Google Scholar]
- 26. Goubern M., Andriamihaja M., Nübel T., Blachier F., and Bouillaud F. (2007) Sulfide, the first inorganic substrate for human cells. FASEB J. 21, 1699–1706 [DOI] [PubMed] [Google Scholar]
- 27. Vitvitsky V., Yadav P. K., Kurthen A., and Banerjee R. (2015) Sulfide oxidation by a noncanonical pathway in red blood cells generates thiosulfate and polysulfides. J. Biol. Chem. 290, 8310–8320 [DOI] [PMC free article] [PubMed] [Google Scholar]
- 28. Bostelaar T., Vitvitsky V., Kumutima J., Lewis B. E., Yadav P. K., Brunold T. C., Filipovic M., Lehnert N., Stemmler T. L., and Banerjee R. (2016) Hydrogen sulfide oxidation by myoglobin. J. Am. Chem. Soc. 138, 8476–8488 [DOI] [PMC free article] [PubMed] [Google Scholar]
- 29. Abe K., and Kimura H. (1996) The possible role of hydrogen sulfide as an endogenous neuromodulator. J. Neurosci. 16, 1066–1071 [DOI] [PMC free article] [PubMed] [Google Scholar]
- 30. Kimura Y., Dargusch R., Schubert D., and Kimura H. (2006) Hydrogen sulfide protects HT22 neuronal cells from oxidative stress. Antioxid. Redox Signal. 8, 661–670 [DOI] [PubMed] [Google Scholar]
- 31. Kabil O., Vitvitsky V., Xie P., and Banerjee R. (2011) The quantitative significance of the transsulfuration enzymes for H2S production in murine tissues. Antioxid. Redox Signal. 15, 363–372 [DOI] [PMC free article] [PubMed] [Google Scholar]
- 32. Enokido Y., Suzuki E., Iwasawa K., Namekata K., Okazawa H., and Kimura H. (2005) Cystathionine β-synthase, a key enzyme for homocysteine metabolism, is preferentially expressed in the radial glia/astrocyte lineage of developing mouse CNS. FASEB J. 19, 1854–1856 [DOI] [PubMed] [Google Scholar]
- 33. Linden D. R., Furne J., Stoltz G. J., Abdel-Rehim M. S., Levitt M. D., and Szurszewski J. H. (2012) Sulphide quinone reductase contributes to hydrogen sulphide metabolism in murine peripheral tissues but not in the CNS. Br. J. Pharmacol. 165, 2178–2190 [DOI] [PMC free article] [PubMed] [Google Scholar]
- 34. Giordano D., Boron I., Abbruzzetti S., Van Leuven W., Nicoletti F. P., Forti F., Bruno S., Cheng C. H., Moens L., di Prisco G., Nadra A. D., Estrin D., Smulevich G., Dewilde S., Viappiani C., and Verde C. (2012) Biophysical characterisation of neuroglobin of the icefish, a natural knockout for hemoglobin and myoglobin. Comparison with human neuroglobin. PLoS One 7, e44508. [DOI] [PMC free article] [PubMed] [Google Scholar]
- 35. Fago A., Hundahl C., Dewilde S., Gilany K., Moens L., and Weber R. E. (2004) Allosteric regulation and temperature dependence of oxygen binding in human neuroglobin and cytoglobin: molecular mechanisms and physiological significance. J. Biol. Chem. 279, 44417–44426 [DOI] [PubMed] [Google Scholar]
- 36. Fago A., Mathews A. J., Moens L., Dewilde S., and Brittain T. (2006) The reaction of neuroglobin with potential redox protein partners cytochrome b5 and cytochrome c. FEBS Lett. 580, 4884–4888 [DOI] [PubMed] [Google Scholar]
- 37. Van Doorslaer S., Vinck E., Trandafir F., Ioanitescu I., Dewilde S., and Moens L. (2004) Tracing the structure-function relationship of neuroglobin and cytoglobin using resonance Raman and electron paramagnetic resonance spectroscopy. IUBMB Life 56, 665–670 [DOI] [PubMed] [Google Scholar]
- 38. Hamdane D., Kiger L., Dewilde S., Green B. N., Pesce A., Uzan J., Burmester T., Hankeln T., Bolognesi M., Moens L., and Marden M. C. (2003) The redox state of the cell regulates the ligand binding affinity of human neuroglobin and cytoglobin. J. Biol. Chem. 278, 51713–51721 [DOI] [PubMed] [Google Scholar]
- 39. Gadsby P. M. A., and Thomson A. J. (1990) Assignment of the axial ligands of ferric ion in low-spin hemoproteins by near-infrared magnetic circular dichroism and electron paramagnetic resonance spectroscopy. J. Am. Chem. Soc. 112, 5003–5011 [Google Scholar]
- 40. Uno T., Ryu D., Tsutsumi H., Tomisugi Y., Ishikawa Y., Wilkinson A. J., Sato H., and Hayashi T. (2004) Residues in the distal heme pocket of neuroglobin: implications for the multiple ligand binding steps. J. Biol. Chem. 279, 5886–5893 [DOI] [PubMed] [Google Scholar]
- 41. Couture M., Burmester T., Hankeln T., and Rousseau D. L. (2001) The heme environment of mouse neuroglobin: evidence for the presence of two conformations of the heme pocket. J. Biol. Chem. 276, 36377–36382 [DOI] [PubMed] [Google Scholar]
- 42. Spiro T. G., and Strekas T. C. (1974) Resonance Raman spectra of heme proteins: effects of oxidation and spin state. J. Am. Chem. Soc. 96, 338–345 [DOI] [PubMed] [Google Scholar]
- 43. Morikis D., Champion P. M., Springer B. A., Egebey K. D., and Sligar S. G. (1990) Resonance Raman studies of iron spin and axial coordination in distal pocket mutants of ferric myoglobin. J. Biol. Chem. 265, 12143–12145 [PubMed] [Google Scholar]
- 44. Choi S. Y., Spiro T. G., Langry K. C., and Smith K. M. (1982) Vinyl influences on protoheme resonance Raman spectra: nickel(II) protoporphyrin IX with deuterated vinyl groups. J. Am. Chem. Soc. 104, 4337–4344 [Google Scholar]
- 45. Paulat F., Praneeth V. K., Näther C., and Lehnert N. (2006) Quantum chemistry-based analysis of the vibrational spectra of five-coordinate metalloporphyrins [M(TPP)Cl]. Inorg. Chem. 45, 2835–2856 [DOI] [PubMed] [Google Scholar]
- 46. Yadav P. K., Martinov M., Vitvitsky V., Seravalli J., Wedmann R., Filipovic M. R., and Banerjee R. (2016) Biosynthesis and Reactivity of cysteine persulfides in signaling. J. Am. Chem. Soc. 138, 289–299 [DOI] [PMC free article] [PubMed] [Google Scholar]
- 47. Hankeln T., Ebner B., Fuchs C., Gerlach F., Haberkamp M., Laufs T. L., Roesner A., Schmidt M., Weich B., Wystub S., Saaler-Reinhardt S., Reuss S., Bolognesi M., De Sanctis D., Marden M. C., et al. (2005) Neuroglobin and cytoglobin in search of their role in the vertebrate globin family. J. Inorg. Biochem. 99, 110–119 [DOI] [PubMed] [Google Scholar]
- 48. Sun Y., Jin K., Mao X. O., Zhu Y., and Greenberg D. A. (2001) Neuroglobin is up-regulated by and protects neurons from hypoxic-ischemic injury. Proc. Natl. Acad. Sci. U.S.A. 98, 15306–15311 [DOI] [PMC free article] [PubMed] [Google Scholar]
- 49. Du W., Syvitski R., Dewilde S., Moens L., and La Mar G. N. (2003) Solution 1 h NMR characterization of equilibrium heme orientational disorder with functional consequences in mouse neuroglobin. J. Am. Chem. Soc. 125, 8080–8081 [DOI] [PubMed] [Google Scholar]
- 50. Herold S., Fago A., Weber R. E., Dewilde S., and Moens L. (2004) Reactivity studies of the Fe(III) and Fe(II)NO forms of human neuroglobin reveal a potential role against oxidative stress. J. Biol. Chem. 279, 22841–22847 [DOI] [PubMed] [Google Scholar]
- 51. Morikawa T., Kajimura M., Nakamura T., Hishiki T., Nakanishi T., Yukutake Y., Nagahata Y., Ishikawa M., Hattori K., Takenouchi T., Takahashi T., Ishii I., Matsubara K., Kabe Y., Uchiyama S., et al. (2012) Hypoxic regulation of the cerebral microcirculation is mediated by a carbon monoxide-sensitive hydrogen sulfide pathway. Proc. Natl. Acad. Sci. U.S.A. 109, 1293–1298 [DOI] [PMC free article] [PubMed] [Google Scholar]
- 52. Francoleon N. E., Carrington S. J., and Fukuto J. M. (2011) The reaction of H2S with oxidized thiols: generation of persulfides and implications to H2S biology. Arch. Biochem. Biophys. 516, 146–153 [DOI] [PubMed] [Google Scholar]
- 53. Greiner R., Pálinkás Z., Bäsell K., Becher D., Antelmann H., Nagy P., and Dick T. P. (2013) Polysulfides link H2S to protein thiol oxidation. Antioxid. Redox Signal. 19, 1749–1765 [DOI] [PMC free article] [PubMed] [Google Scholar]
- 54. Jeyarajah S., Proniewicz L. M., Bronder H., and Kincaid J. R. (1994) Low frequency vibrational modes of oxygenated myoglobin, hemoglobins, and modified derivatives. J. Biol. Chem. 269, 31047–31050 [PubMed] [Google Scholar]
- 55. Smith A. T., Pazicni S., Marvin K. A., Stevens D. J., Paulsen K. M., and Burstyn J. N. (2015) Functional divergence of heme-thiolate proteins: a classification based on spectroscopic attributes. Chem. Rev. 115, 2532–2558 [DOI] [PubMed] [Google Scholar]
- 56. Reijerse E. J., Sommerhalter M., Hellwig P., Quentmeier A., Rother D., Laurich C., Bothe E., Lubitz W., and Friedrich C. G. (2007) The unusal redox centers of SoxXA, a novel c-type heme-enzyme essential for chemotrophic sulfur-oxidation of Paracoccus pantotrophus. Biochemistry 46, 7804–7810 [DOI] [PubMed] [Google Scholar]
- 57. Zhang B., Crack J. C., Subramanian S., Green J., Thomson A. J., Le Brun N. E., and Johnson M. K. (2012) Reversible cycling between cysteine persulfide-ligated [2Fe-2S] and cysteine-ligated [4Fe-4S] clusters in the FNR regulatory protein. Proc. Natl. Acad. Sci. U.S.A. 109, 15734–15739 [DOI] [PMC free article] [PubMed] [Google Scholar]
- 58. Janz G. J., Downey J. R., Roduner E., Wasilczyk G. J., Coutts J. W., and Eluard A. (1976) Raman studies of sulfur-containing anions in inorganic polysulfides: sodium polysulfides. J. Inorg. Chem. 15, 1759–1763 [Google Scholar]
- 59. Das T. N., Huie R. E., Neta P., and Padmaja S. (1999) Reduction potential of the sulfhydryl radical: pulse radiolysis and laser flash photolysis studies of the formation and reactions of •SH and HSSH˙̄ in aqueous solutions. J. Phys. Chem. A 103, 5221–5226 [Google Scholar]
- 60. Zhu W., Lin A., and Banerjee R. (2008) Kinetic properties of polymorphic variants and pathogenic mutants in human cystathionine γ-lyase. Biochemistry 47, 6226–6232 [DOI] [PMC free article] [PubMed] [Google Scholar]
- 61. Stoll S., and Schweiger A. (2006) EasySpin, a comprehensive software package for spectral simulation and analysis in EPR. J. Magn. Reson. 178, 42–55 [DOI] [PubMed] [Google Scholar]
- 62. Cook J. D., Bencze K. Z., Jankovic A. D., Crater A. K., Busch C. N., Bradley P. B., Stemmler A. J., Spaller M. R., and Stemmler T. L. (2006) Monomeric yeast frataxin is an iron-binding protein. Biochemistry 45, 7767–7777 [DOI] [PMC free article] [PubMed] [Google Scholar]
- 63. Cotelesage J. J., Pushie M. J., Grochulski P., Pickering I. J., and George G. N. (2012) Metalloprotein active site structure determination: synergy between X-ray absorption spectroscopy and X-ray crystallography. J. Inorg. Biochem. 115, 127–137 [DOI] [PubMed] [Google Scholar]
Associated Data
This section collects any data citations, data availability statements, or supplementary materials included in this article.


