Abstract
The signaling molecule nitric oxide (NO) is synthesized in animals by structurally related NO synthases (NOSs), which contain NADPH/FAD- and FMN-binding domains. During catalysis, NADPH-derived electrons transfer into FAD and then distribute into the FMN domain for further transfer to internal or external heme groups. Conformational freedom of the FMN domain is thought to be essential for the electron transfer (ET) reactions in NOSs. To directly examine this concept, we utilized a “Cys-lite” neuronal NOS flavoprotein domain and substituted Cys for two residues (Glu-816 and Arg-1229) forming a salt bridge between the NADPH/FAD and FMN domains in the conformationally closed structure to allow cross-domain disulfide bond formation or cross-linking by bismaleimides of various lengths. The disulfide bond cross-link caused a ≥95% loss of cytochrome c reductase activity that was reversible with DTT treatment, whereas graded cross-link lengthening gradually increased activity, thus defining the conformational constraints in the catalytic process. We used spectroscopic and stopped-flow techniques to further investigate how the changes in FMN domain conformational freedom impact the following: (i) the NADPH interaction; (ii) kinetics of electron loading (flavin reduction); (iii) stabilization of open versus closed conformational forms in two different flavin redox states; (iv) reactivity of the reduced FMN domain toward cytochrome c; (v) response to calmodulin binding; and (vi) the rates of interflavin ET and the FMN domain conformational dynamics. Together, our findings help explain how the spatial and temporal behaviors of the FMN domain impact catalysis by the NOS flavoprotein domain and how these behaviors are governed to enable electron flow through the enzyme.
Keywords: cysteine-mediated cross-linking, electron transfer, flavin, nitric oxide, pre-steady-state kinetics, domain motion, kinetic model, redox enzyme
Introduction
Nitric oxide (NO) is synthesized in animals by three structurally related NO synthases (NOSs) (1, 2). NOS enzymes are homodimers with each subunit consisting of an N-terminal oxygenase domain (NOSoxy)2 that catalyzes NO synthesis and a C-terminal flavoprotein or reductase domain (NOSr) that provides electrons and is linked to NOSoxy by an intervening calmodulin (CaM)-binding sequence (3). CaM binding triggers electron transfer from NOSr to NOSoxy, which enables heme-catalyzed O2 activation as required for NO synthesis (4, 5).
NOSr belongs to a family of NADPH-dependent dual-flavin reductases that consist of separate NADPH/FAD- and FMN-binding domains that are attached by a peptide linker of various lengths (between 20 and 132 amino acids) (6, 7). During catalysis, NADPH-derived electrons transfer into the bound FAD and then distribute into the FMN domain to ultimately generate FMN hydroquinone (FMNhq), which can then transfer electrons to either an attached heme domain (as in NOS) or to an external hemeprotein partner like cytochrome P450 (8), heme oxygenase (9), or cytochrome c (10). The crystal structures of two family members, cytochrome P450 reductase (CPR) and nNOSr, revealed that they have a similar structure where the FMN domain is partly buried in a cup-shaped cavity formed by the NADPH/FAD domain (6, 11). Although this “closed” conformation positions the FMN and FAD cofactors close enough for direct electron transfer (ET) between them, it also physically shields the FMN from interacting with hemeprotein partners (6). Thus, during catalysis the FMN domain is thought to move so that the enzyme can cycle between closed and more open conformational states to support ET to its protein partners (6, 12). Indeed, a variety of spectroscopic and biophysical studies has shown that open conformational states exist in equilibrium with the closed state in NOS (13–19) and in CPR (20–24), and recently the crystal structures of three open conformations have been reported for CPR mutants or chimeras (25, 26).
The importance of conformational switching in CPR catalysis was previously tested by chemically cross-linking its FMN and NADPH/FAD domains together through a Cys–Cys disulfide bond that was engineered to be located at the domain interface, in order to stabilize the closed structure. Forming the disulfide cross-link inhibited the steady-state cytochrome c reductase activity of CPR (i.e. the electron flux to cytochrome c) by 95% relative to the thiol-reduced (free) form of the enzyme, thus establishing the importance of conformational cycling in electron flux through CPR to cytochrome c and to cytochrome P450 (27).
In this study, we expanded on these results by site-specifically cross-linking the NADPH/FAD and FMN domains of nNOSr through either a disulfide bond or through a series of bismaleimide cross-linkers of varying lengths. We used previously generated Cys-lite nNOSr (CL nNOSr), in which reactive cysteines have been mutated to serines (17), and for site-specific cross-linking studies, we generated a CLSSnNOSr variant by mutating Arg-1229 in the NADPH/FAD domain and Glu-816 in the FMN to cysteines in our CL nNOSr construct. This allowed us to investigate how restricting FMN domain movement, either tightly or by allowing graded degrees of conformational freedom, would impact the steady-state catalytic activity (cytochrome c reduction) and CaM response of nNOSr, as well as influence the key steps and parameters that underlie its catalysis. These include the kinetics and extent of flavin reduction, the rate of interflavin ET, the open-closed conformational equilibrium, the reactivity of reduced closed or open states with cytochrome c, and the dynamics of the open-closed conformational switching. Together, our findings refine our understanding of how FMN domain motion relates to catalysis and regulation in NOSr and, by extension, to other members of the dual-flavin reductase family.
Results
General properties of E816C/R1229C CL nNOSr (CLSS)
The UV-visible spectrum of purified CLSS was similar to nNOSr, and it contained the expected one FAD and one FMN per mol of protein (data not shown). It bound 2 mol of Alexa Fluor 555 (A555) maleimide dye per mol of protein, whereas the precursor protein CL nNOSr bound only a trace of the maleimide dye (Fig. 1). These properties indicate that CLSS was suitable for our studies.
Figure 1.
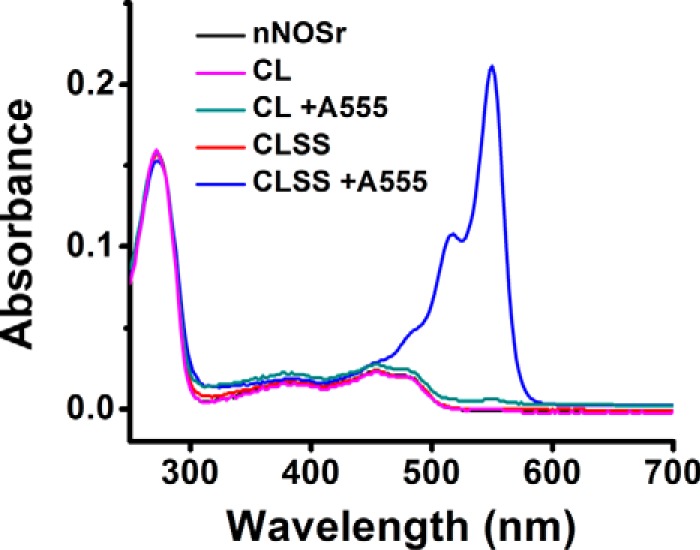
Spectrum and reactive thiol content of the various proteins. The indicated proteins had their UV-visible spectra recorded after they were or were not reacted with Alexa Fluor 555 (A555) maleimide dye. The absorbance peak near 550 nm is the maximum for the dye. Results are representative of three trials.
Steady-state reductase activities
Fig. 2 compares the cytochrome c reductase activities of nNOSr, CL, and CLSS proteins in their CaM-free and CaM-bound states. The activity and CaM response of CL were similar to nNOSr, whereas the CLSS had CaM-free and CaM-bound activities that were nearly equivalent and similar to the CaM-bound nNOSr. The high activity of CaM-free CLSS was expected, due to the Cys substitutions at Arg-1229 and Glu-816 disrupting a salt bridge that normally forms between them (6) and represses the cytochrome c reductase activity of nNOSr in the absence of CaM, likely by stabilizing its closed conformation (19, 28).
Figure 2.
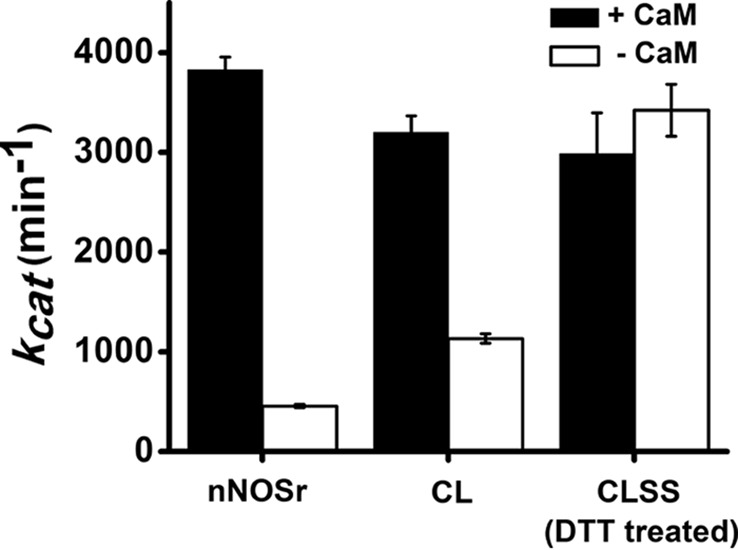
Steady-state cytochrome c reductase activity of various proteins. 10–25 nm enzyme was used in the assay. Experiments were done at 25 °C and the values are the mean ± S.D. for six preparations, three measurements each. See text for details.
Disulfide and bismaleimide cross-linked CLSS
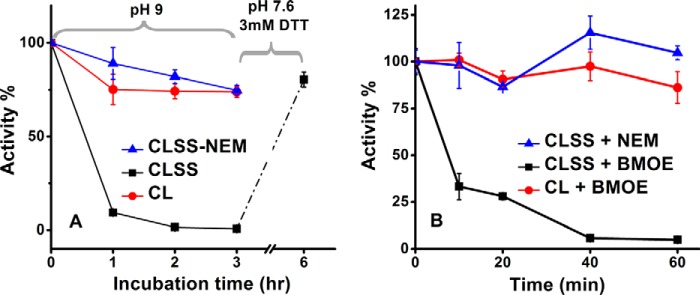
We incubated the CLSS in 50 mm Tris-HCl, 150 mm NaCl, pH 9 buffer, to promote disulfide formation between Cys-1229 and Cys-816. This led to a time-dependent loss in CLSS reductase activity down to 2% of the original value, and the loss was reversed when the pH 9 incubated protein was transferred into pH neutral buffer containing DTT (Fig. 3A). In comparison, neither a CLSS sample whose Cys groups had been modified with N-ethylmaleimide (NEM) nor the CL precursor protein itself lost their reductase activities during incubation in the pH 9 buffer (Fig. 3A). Thus, the intended disulfide cross-link formed at pH 9 between Cys-1229 and Cys-816 and caused CLSS to reversibly lose its reductase activity. Likewise, when CLSS was incubated with the shortest possible bismaleimide cross-linking agent bismaleimidoethane (BMOE), there was a time-dependent drop in the cytochrome c reductase activity down to 5% of the original activity (Fig. 3B). Neither NEM-pretreated CLSS nor the CL precursor itself lost activity during an identical incubation with BMOE. Because cross-linking the NADPH/FAD and FMN domains together through either a disulfide bond or a short linker (BMOE) greatly diminished CLSS electron flux to cytochrome c, our results directly demonstrate that freedom of movement of the FMN domain is critical for catalysis of electron flux by nNOSr.
Figure 3.
Effect of domain cross-linking on CLSS cytochrome c reductase activity. A, indicated CaM-bound proteins were incubated in pH 9 buffer to induce a reversible domain-domain disulfide cross-link in CLSS, and aliquots were removed at the indicated times for activity assay. The CLSS protein was further incubated in neutral buffer with DTT for 3 h, and its activity was assayed to test for reversibility. B, indicated CaM-bound proteins were incubated with NEM or with BMOE to induce a covalent domain-domain cross-link in CLSS, and aliquots were removed at the indicated times for activity assay. Values are the mean ± S.D. of three measurements, representative of two trials.
Impact of domain cross-linking on substrate interactions
We examined whether the domain-domain disulfide cross-link would impact the NADPH or cytochrome c interactions of CLSS by comparing the apparent Km values for its free versus disulfide cross-linked form. The Km values of NADPH for free and disulfide cross-linked CLSS are 4.4 ± 0.4 and 3.4 ± 0.5 μm, respectively, whereas the Km of cytochrome c for free and disulfide cross-linked CLSS are 3.9 ± 0.5 and 3.5 ± 0.2 μm, respectively. These data show that cross-linking the NADPH/FAD and FMN domains did not alter the apparent Km value for NADPH nor the apparent Km value for cytochrome c. We therefore conclude that changes in NADPH or cytochrome c interaction were not involved in causing the considerable loss of cytochrome c reductase activity of CLSS when in the disulfide or BMOE cross-linked state.
Reaction with bismaleimide cross-linkers of varying length and the impact on electron flux to cytochrome c
We next tested how cross-linker length would impact the steady-state electron flux through CLSS to cytochrome c. We utilized seven bismaleimide cross-linking agents that had fully extended arm lengths ranging from 8 to 52 Å and had calculated “random walk” average arm lengths (29) ranging from 8.0 to 19.4 Å (Table 1). Because reaction with bismaleimides can generate subpopulations of CLSS molecules where either one or both of the cross-linking Cys groups have reacted with a bismaleimide, but have failed to form an intramolecular domain-domain cross-link, we incorporated a cleanup procedure that utilized thiol-Sepharose beads to remove these undesirable CLSS reaction products, which would contain one or two reactive maleimide groups per mol of CLSS protein and thus would covalently bind to the thiol-Sepharose resin. To validate our method, we quantified the number of maleimide-reactive thiol groups, and the thiol-reactive maleimide groups, that remained on CLSS after it had reacted with each of the bismaleimides and then undergone the thiol-Sepharose cleanup step. We found 0–5% free thiol groups remained in the reacted CLSS after the cleanup, as judged by their reactivity toward a maleimide fluorescent dye, and the proteins were found to contain less than 0.01 mol of free maleimide per mol of CLSS (data not shown). Also, SDS-PAGE showed there were negligible amounts of intermolecular cross-links formed among CLSS molecules under our cross-linking reaction conditions (i.e. CLSS dimers or trimers; data not shown). In this way, our procedure could generate homogeneous preparations of each cross-linked CLSS protein.
Table 1.
Abbreviated names, lengths, and structures of the bismaleimide cross-linkers used in the study
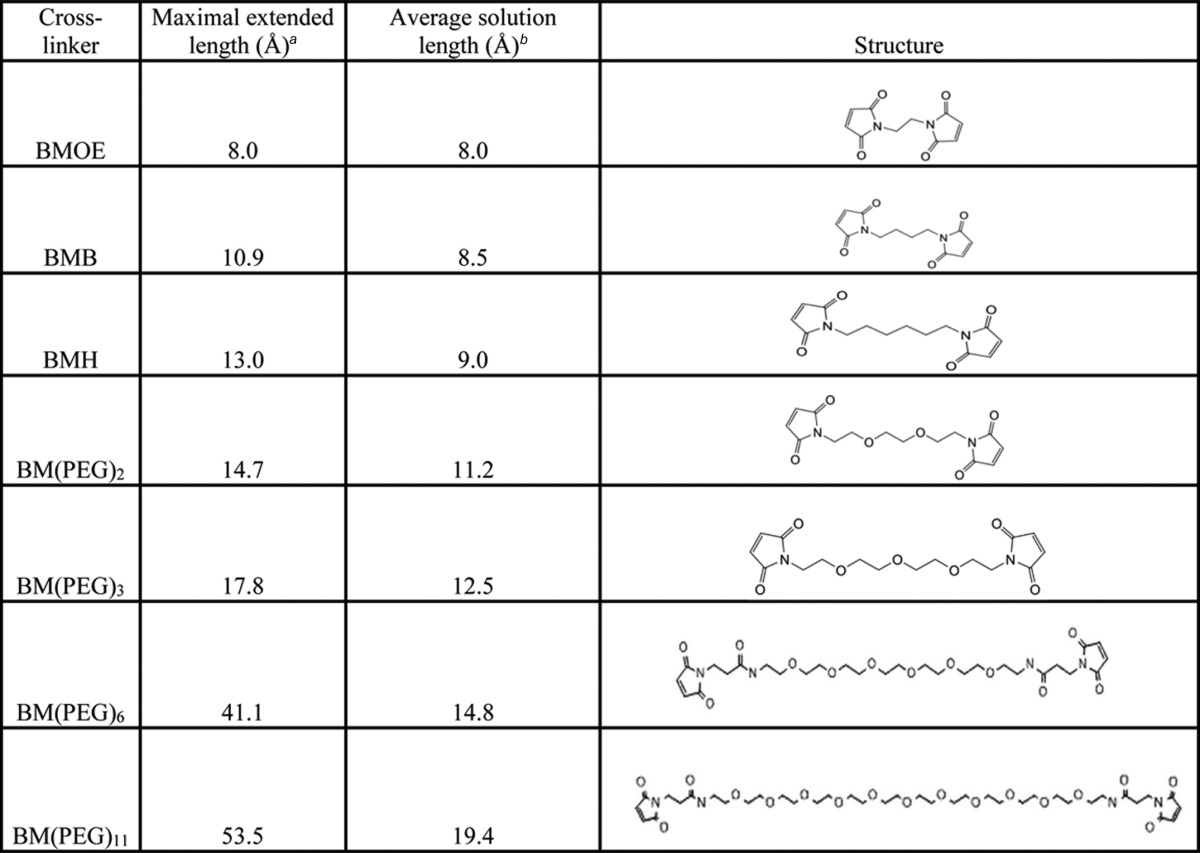
a Distance was measured from the ring to ring.
b Distance was calculated from a random walk analysis for the free cross-linker (not protein-bound) adapted from a previous report (29).
Fig. 4 compares the steady-state cytochrome c reductase activities of the cross-linked CLSS proteins. The reductase activities increased as cross-linker lengths increased but began to level out at (fully extended) linker lengths of 18 Å or greater. The cross-linking also made CLSS become responsive to CaM binding, because the CaM-bound forms now all showed greater activity than their CaM-free forms, unlike the response of the free CLSS (Fig. 4, dashed and dotted lines), whose CaM-free and -bound activities were nearly equal. However, the cross-linked proteins at best achieved only 12% of the maximal activity of the free CLSS (Fig. 4).
Figure 4.
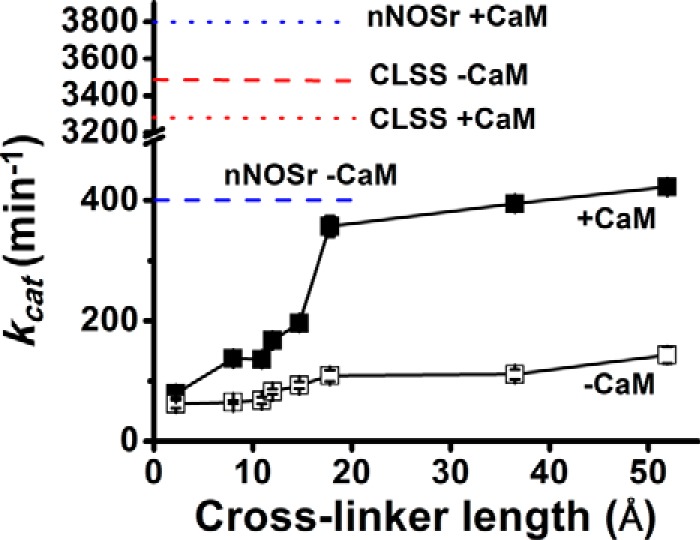
Steady-state cytochrome c reductase activities versus domain cross-linker length. Solid lines, CLSS protein was cross-linked with either a disulfide bond (left-most data points) or with bismaleimides with the indicated maximum lengths, and their activities were measured at 25 °C and in the presence (■) or absence (□) of CaM. Dotted and dashed lines, activities of DTT-treated CLSS or nNOSr in the presence or absence of CaM. Values are the mean ± S.D. of three measurements, representative of three trials.
Impact of cross-linking on the conformational equilibrium of the flavin-oxidized CLSS
To examine how domain cross-linking impacts the conformational behavior of the fully oxidized CLSS, we monitored its flavin fluorescence, whose intensity primarily reflects the quenching level of the bound FMN cofactor, which in turn is sensitive to the open-closed conformational equilibrium of the nNOSr (30, 31). We compared the flavin fluorescence intensities of the free or cross-linked CLSS and how they may change in response to CaM binding. The flavin fluorescence traces in Fig. 5, left panel, show that the fluorescence intensities were similar among the various cross-linked CLSS in the absence of CaM, which were in turn similar to that of CaM-free wild-type nNOSr. When Ca2+ was added to promote CaM binding, it caused flavin fluorescence to increase for nNOSr, as seen previously (32), but it caused a very small increase in flavin fluorescence for the disulfide or BMOE cross-linked CLSS. Thus, CaM binding could not cause a shift to a more open conformational state if the NADPH/FAD and FMN domains were tightly cross-linked. For the other cross-linkers, we observed flavin fluorescence increases upon CaM binding that were directly proportional to the cross-linker length (Fig. 5, left and right panels), and the longest cross-linker we tested allowed a fluorescence increase that reached 60% of the increase observed when CaM bound to nNOSr. In comparison, the flavin fluorescence intensity of the free CLSS was high even in its CaM-free state, and it increased no further upon CaM binding, consistent with CLSS existing primarily in an open conformation. Together, these results suggest that all of the cross-linkers, regardless of length, stabilized the closed conformation of the CaM-free, flavin-oxidized CLSS, and did so to an extent that was equivalent to that seen in wild-type nNOSr. CaM binding negated their stabilizing effects and allowed the cross-linked CLSS to shift toward more open conformations.
Figure 5.
Effect of domain cross-linking on the flavin fluorescence and CaM response of nNOSr proteins. Left panel, proteins were excited at 457 nm, and their fluorescence emission was monitored at 530 nm over time. Representative emission traces are shown for nNOSr (red) and for the CLSS protein that was DTT-treated (black) or was cross-linked by either a disulfide bond (blue), BMOE (brown), BMH (dark green), BM(PEG)2 (pink), or BM(PEG)3 (green). Ca2+ and EDTA was added at 200 and 400 s, respectively, to induce and reverse CaM binding. Right panel, fluorescence emission gain observed upon CaM binding to the indicated proteins, as derived from the left panel. Maximum cross-link distances are indicated. Data are representative of two experiments.
Flavin reduction kinetics
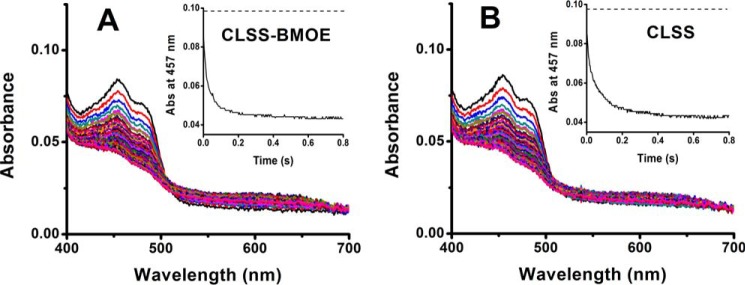
We next investigated how domain cross-linking would impact the import of NADPH-derived electrons into CLSS by analyzing the kinetics of flavin reduction. Each cross-linked or free CLSS was rapidly mixed with a 10-fold molar excess of NADPH in a stopped-flow instrument under anaerobic conditions, and flavin reduction was monitored by recording the spectrum from 400 to 700 nm versus time (33). Fig. 6, A and B, shows representative data for the free versus BMOE cross-linked CLSS proteins. The overall absorbance decreases were similar, indicating that the domain cross-linking by BMOE did not prevent electron loading into the FAD and FMN cofactors of CLSS. Similar flavin reduction behavior was observed when CLSS was cross-linked with the disulfide bridge or with the longer bismaleimides (data not shown).
Figure 6.
Effect of domain cross-linking on the extent and kinetics of NADPH-dependent flavin reduction. Fully oxidized CLSS that was either BMOE cross-linked (A) or free (B) was rapidly mixed with excess NADPH under anaerobic conditions, and sequential wavelength scans were collected versus time. Panel insets, the 457-nm absorption change versus time as extracted from the spectral data, with dashed lines indicating the time = 0 absorbance at 457 nm. Data are representative of 5–7 trials.
The absorbance kinetic traces at 457 nm (Fig. 6, insets) suggested that flavin reduction was faster in the BMOE-cross-linked than in the free CLSS. To examine this more closely, we recorded the kinetics of absorbance change at 600 nm during the NADPH-driven reduction of the free and various cross-linked CLSS proteins. The absorbance change at 600 nm detects neutral flavin semiquinone species whose formation and disappearance in CLSS rely on sequential interflavin ET steps (Scheme 1).
Scheme 1.

Formation and disappearance of flavin semiquinone species (red) during NADPH reduction of fully oxidized CLSS.
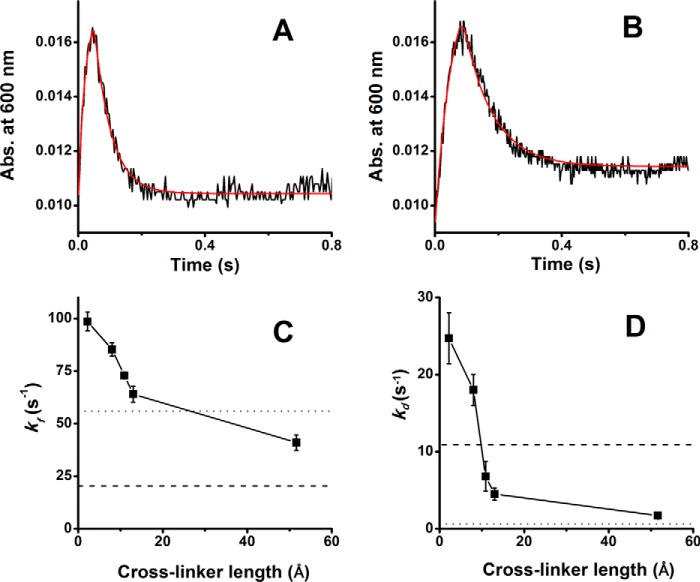
We first compared the free and disulfide-linked CLSS proteins. As shown in Fig. 7, A and B, the disulfide-linked protein clearly had faster rates of flavin semiquinone formation and disappearance. This was confirmed by fitting the absorbance traces at 600 nm, which indicated it had five and two times faster rates of flavin semiquinone formation and decay, respectively (Table 2). Results from experiments done with the other cross-linked CLSS proteins are reported in Table 2. Fig. 7, C and D, plots the fitted rates versus cross-linker length and also indicates as dashed and dotted lines the fitted rates we measured for the free CLSS or determined previously under similar conditions for nNOSr (34). In general, the cross-linked CLSS all had faster rates of flavin semiquinone formation than did free CLSS, and as cross-linker length increased, there was a corresponding slowing in the rates of flavin semiquinone formation and disappearance. CLSS cross-linked with the two longest linkers displayed rates that were most similar to those reported for nNOSr. Together, the results suggest that cross-linking the NADPH-FAD and FMN domains facilitated the interflavin ET to an extent that was inversely proportional to the cross-linker length.
Figure 7.
Effect of domain cross-linking on the kinetics of flavin semiquinone formation and disappearance. Fully oxidized CLSS whose domains were either free (DTT-treated) or were cross-linked with the various bismaleimides was mixed with excess NADPH at 10 °C, and flavin semiquinone was monitored at 600 nm versus time. A and B, absorbance traces for the disulfide cross-linked or free CLSS, respectively, with the lines of best fit indicated in red. C and D, rates of flavin semiquione formation and decay derived from the lines of best fit, respectively, for CLSS cross-linked by a disulfide bond or with the bismaleimides of the indicated length. The dashed and dotted lines indicate the rates of flavin semiquinone formation and decay obtained for the free CLSS and for nNOSr, respectively, under the same conditions. Data are the mean ± S.D. for 5–7 trials.
Table 2.
Rates of flavin semiquinone formation (kf) and decay (kd) during NADPH reduction of the free and cross-linked CLSS
The absorbance at 600 nm was followed after rapidly mixing each fully oxidized protein (∼10 μm) with excess NADPH (100 μm) at 10 °C, according to details under “Experimental procedures.” Values are the mean ± S.D. of 5–7 trials.
| Enzyme | kf | kd |
|---|---|---|
| s−1 | s−1 | |
| CLSS, pH 9-treated | 98.6 ± 4.5 | 24.7 ± 3.3 |
| CLSS-BMOE | 85.3 ± 3.2 | 18 ± 2.0 |
| CLSS-BMB | 72.9 ± 1.4 | 6.8 ± 1.9 |
| CLSS-BMH | 64 ± 3.8 | 4.5 ± 0.8 |
| CLSS-BM(PEG)11 | 41 ± 3.6 | 1.7 ± 0.4 |
| CLSS, DTT-treated | 20.4 ± 2.2 | 10.9 ± 1.9 |
Impact of cross-linking on the conformational equilibrium and reactivity of the CaM-free reduced CLSS
To examine how domain cross-linking impacts the conformational behaviors of the fully reduced, CaM-free CLSS, we followed an established approach (10) that uses stopped-flow spectroscopy to monitor the reaction of fully reduced NOSr proteins with excess cytochrome c. In such experiments, a four-electron reduced NADPH-bound NOSr is mixed under anaerobic conditions with excess cytochrome c, and the kinetics of its reduction are recorded at 550 nm (10). Through application of a four-state kinetic model that relates NOSr conformational cycling to the ET steps within the enzyme and the ET to cytochrome c (Fig. 8), one can detect the populations of NOSr that are differentially reactive toward cytochrome c (i.e. the open and closed reduced conformations, species d and a in Fig. 8), can estimate their relative abundance, and can estimate best fit rates for the interflavin ET step and the nNOSr conformational transitions between its fast and slow reacting states. Based on this approach, we know that fully reduced CaM-free nNOSr exists as a mixture of fast- and slow-reacting conformations. The fast-reacting population is able to transfer an electron from FMNhq to cytochrome c at a rate that is within the mixing dead time of the stopped-flow instrument, and the slow-reactive nNOSr population is able to reduce cytochrome c at a rate that is related to its rate of conformational opening, which is slow enough to be observed by the stopped-flow approach (10). As catalysis continues, the rates of conformational cycling and interflavin ET all contribute to determining the flux of electrons going to cytochrome c during steady-state catalysis. Using this approach, we have studied how conformational behavior controls electron flux through various NOS proteins (10, 16, 35) and through related dual-flavin reductase enzymes like CPR and methionine synthase reductase.
Figure 8.
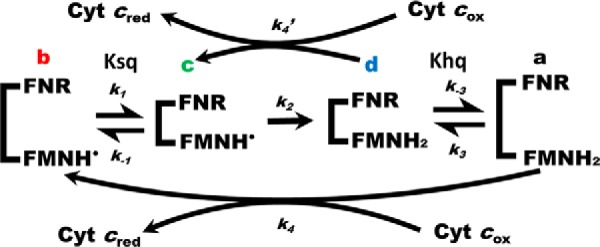
Modified four-state kinetic model for cytochrome c reduction by dual-flavin enzymes. The model indicates a sequential cycling among conformationally open or closed forms that contain FMN semiquinone or FMN hydroquinone. Rates of conformational opening (k−1 and k−3) and closing (k1 and k3), FMN reduction (k2), and the rates of ET to oxidized cytochrome c (k4 and k4′) are indicated. Ksq and Khq are the conformational equilibrium settings for the partly oxidized and fully reduced forms of the enzyme, respectively. We assumed Ksq = Khq = Keq in our study. FNR is the NADPH/FAD domain. See text for details.
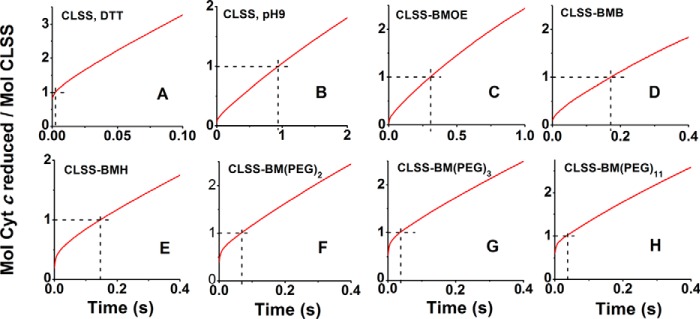
Fig. 9, A and B, contains the averaged stopped-flow traces of cytochrome c reduction by fully reduced, CaM-free CLSS when it was conformationally free (DTT-treated) or was cross-linked by the disulfide bridge, respectively. In each panel of Fig. 9, the x axis indicates the cytochrome c absorption at time = 0, a horizontal dashed line indicates the absorption increase achieved when 1 mol of CLSS reduces the 1st molar eq of cytochrome c, and a vertical dashed line indicates the time taken to reduce the 1st eq of cytochrome c. For the free CLSS (Fig. 9A), the reaction trace shows that the 1st eq of cytochrome c was reduced almost completely within the mixing dead time. This confirms that the fully reduced CaM-free CLSS exists predominantly in an open conformation that is very reactive toward cytochrome c. In contrast, the reaction trace of CLSS that was cross-linked by the disulfide bond (Fig. 9B) shows that less than 5% of the 1st eq of cytochrome c was reduced in the mixing dead time, and instead a slow rate of reduction occurred throughout the time course. This result is consistent with an efficient domain-domain cross-linking by the disulfide bond and suggests that in this circumstance the CLSS can only transfer electrons to cytochrome c at a much slower rate.
Figure 9.
Stopped-flow traces of cytochrome c reduction by the various free and cross-linked CLSS proteins. Each fully reduced protein was mixed with excess cytochrome c at 10 °C under anaerobic conditions, and the reduction was monitored versus time at 550 nm. Horizontal and vertical dashed lines indicate the absorbance change and time elapsed during the reduction of 1 molar eq of cytochrome c by each protein. Data are representative of 5–7 trials.
The traces in Fig. 9, C–H, show the averaged stopped-flow traces of cytochrome c reduction by fully reduced, CaM-free CLSS that was cross-linked with bismaleimide linkers of various lengths. As the cross-linker length increased, there was a corresponding increase in the percentage of cytochrome c that was reduced in the mixing dead time, going from ≤5% to about 60% from the shortest to longest cross-linker. These percentages indicate the percentage of enzyme that was in the open reactive conformation at the time of mixing, and they are listed in Table 3 and plotted as a function of cross-linker length in Fig. 10. Once the fast-reacting population had reduced cytochrome c, the traces in all cases deflected to a slower reduction rate and achieved an apparent steady state shortly after the 1st eq of cytochrome c was reduced. The same behavior was seen previously in the reactions catalyzed by nNOSr or other dual-flavin enzymes (10). The steady-state rates as determined from tangent lines drawn to the traces in Fig. 9 during reduction of the 2nd eq of cytochrome c are graphed as a function of cross-linker length in Fig. 10. The comparison indicates that a good correlation exists between each enzyme's steady-state activity and the extent to which its fully reduced form populated the open reactive conformation. Together, the stopped-flow results suggest that the domain cross-linkers shifted the conformational equilibrium of the CaM-free, fully reduced CLSS toward the closed conformational state in inverse relation to the cross-linker length. This in turn correlated well with decreases in their steady-state cytochrome c reductase activities.
Table 3.
Equilibrium and kinetic values derived from the stopped-flow absorbance traces of cytochrome c reduction by the free or cross-linked CLSS proteins
The reactions mixed each NADPH-bound, pre-reduced enzyme with excess cytochrome c. Fitting was done using the kinetic model of Fig. 8. See text and under “Experimental procedures” for details. NA means not applicable.
| Enzyme | Conformational Keq (open/closed) | Open % | k1 | k−1 | k3 | k−3 | k2 |
|---|---|---|---|---|---|---|---|
| s−1 | s−1 | s−1 | s−1 | s−1 | |||
| CLSS, pH9 | NA | <1 | NA | NA | NA | NA | 100 |
| CLSS-BMOE | 0.02 | 2 | 100 | 2 | 100 | 2 | 85 |
| CLSS-BMB | 0.15 | 13 | 80 | 12 | 80 | 12 | 65 |
| CLSS-BMH | 0.26 | 21 | 60 | 16 | 60 | 16 | 48 |
| CLSS-BM(PEG)2 | 0.69 | 41 | 40 | 27 | 40 | 27 | 40 |
| CLSS-BM(PEG)3 | 1.1 | 53 | 30 | 33 | 30 | 33 | 35 |
| CLSS-BM(PEG)11 | 1.6 | 61 | 25 | 39 | 25 | 39 | 30 |
| CLSS, DTT | 5.7 | 85 | 60 | 340 | 60 | 340 | 15 |
Figure 10.
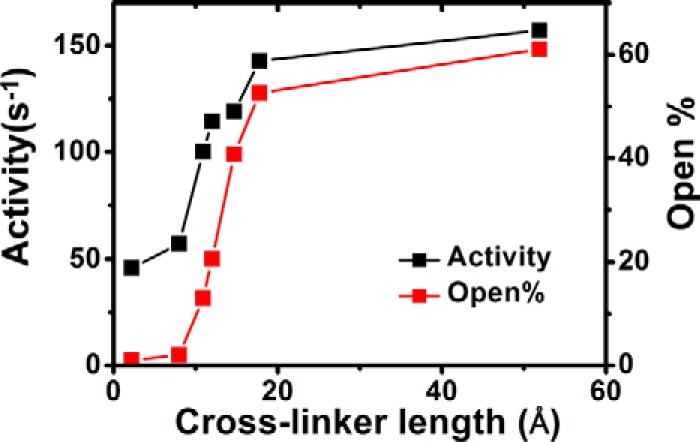
Correlation between the cytochrome c reductase activity and the open conformational subpopulation present in the various cross-linked CLSS. The values are from Table 3.
Impact of CaM on the conformational equilibrium of the cross-linked reduced CLSS
We used an identical approach to study whether CaM binding may influence the conformational equilibrium of the reduced, cross-linked CLSS. Fig. 11 compares cytochrome c reduction traces that were recorded for CaM-bound versus CaM-free CLSS that had been cross-linked with four bismaleimides of various lengths. CaM increased the slopes of the traces and shortened the time required to reduce 1 eq of cytochrome c in direct relation to the cross-linker length. This indicates it increased the rate of cytochrome c reduction and confirms the CaM effect we observed in our conventional reductase activity measures (see Fig. 4). In contrast, the traces indicate that CaM had very little impact on the percentage of fast versus slow reacting species that were present at the time of mixing in the cross-linked CLSS. The calculated estimates for the percentage of open conformational species are listed in Table 4. Thus, we conclude that CaM binding increased the reductase activity of the longer cross-linked CLSS without significantly altering their conformational Keq.
Figure 11.
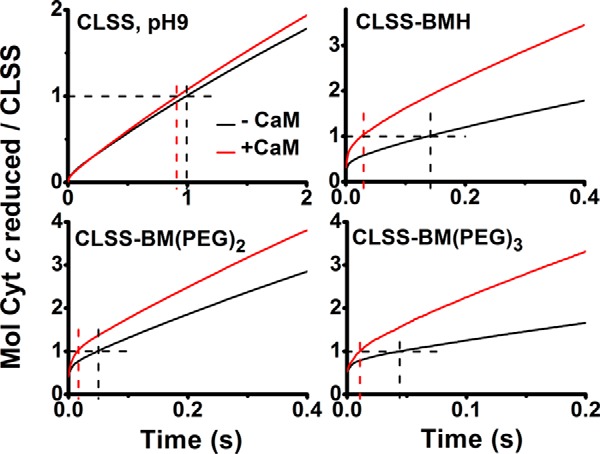
Effect of CaM on the cytochrome c reduction by various cross-linked and reduced CLSS proteins. Each fully reduced CLSS that was cross-linked as indicated in each panel was mixed with excess cytochrome c at 10 °C under anaerobic conditions, and the reduction was monitored versus time at 550 nm. Horizontal and vertical dashed lines indicate the absorbance change and time elapsed during the reduction of 1 molar eq of cytochrome c by each protein. Data are representative of 5–7 trials.
Table 4.
Effect of CaM on the open conformation subpopulation of cross-linked CLSS
The reactions mixed each CaM-free or CaM-bound, pre-reduced enzyme with excess cytochrome c. The percentage open conformation were determined from the traces in Fig. 11. See text and “Experimental procedures” for details.
| Enzyme | Open % |
|
|---|---|---|
| −CaM | +CaM | |
| CLSS, pH9 | <1 | <1 |
| CLSS-BMH | 20.6 ± 1.9 | 30.6 ± 0.6 |
| CLSS-BM(PEG)2 | 39.2 ± 2.7 | 41.0 ± 1.1 |
| CLSS-BM(PEG)3 | 50.1 ± 0.3 | 52.0 ± 0.6 |
Derivation of conformation-based parameters
To derive the best-fit kinetic parameters, we performed computer simulations of the reaction traces in Fig. 9 according to the modified four-state kinetic model in Fig. 8, which now takes into account the low but detectable reactivity of the conformationally closed CLSS (i.e. disulfide cross-linked CLSS) toward cytochrome c. To derive rates for the ET reactions of this conformationally closed species, we simulated a two-state kinetic model where the disulfide cross-linked CLSS stays in a closed state during the electron transfer to cytochrome c, and simply cycles between species d and c in Fig. 8. The simulation provided best-fit rate estimates for the interflavin ET (k2 = 100 s−1) and for the ET to cytochrome c by the disulfide cross-linked species d (k4′ = 0.019 μm−1s−1). These values are listed in Table 3 and were incorporated into our kinetic model of Fig. 9 and in all further simulations.
Because each of the reduced and bismaleimide cross-linked CLSS samples contained subpopulations that reacted with cytochrome c in the mixing dead time (see Fig. 9, reaction traces), it implies that conformationally open forms were present in each case and that they are kinetically uniform in their reactivity toward cytochrome c. We could thus assume they all reacted with cytochrome c at a rate k4 = 225 s−1 under our experimental reaction conditions (10). As explained previously (36), the simulations also incorporate the measured conformational equilibrium Keq value of each protein (derived from the reaction traces in Fig. 9 as noted above) and incorporate the measured time that was required for each protein to reduce the 1st eq of cytochrome c. Together, this allowed us to derive best-fit estimates for the rates of interflavin electron transfer (k2) and the rates of conformational opening and closing (k1, k-1, k3, and k−3 in Fig. 8) for each cross-linked CLSS protein. The kinetic values are listed in Table 3, and these values are graphed as a function of the cross-linker length in Fig. 12, A–C, and are compared with values obtained for the free CLSS or for nNOSr. Clear trends exist between cross-linker length and the simulated rates of conformational opening, conformational closing, and interflavin ET. These relationships are discussed below.
Figure 12.
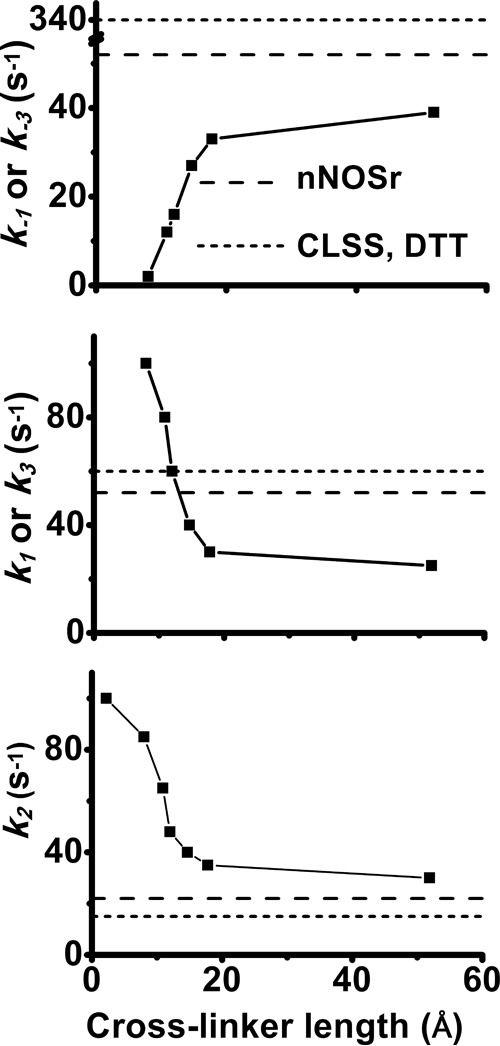
Effect of cross-linker length on the best fit rates of conformational change and interflavin ET in CLSS. Rate values were derived from the simulations of the cytochrome c traces in Fig. 9 as explained in the text. Upper and middle panels, rates of conformational opening and closing, respectively. Lower panel, rate of interflavin ET. For comparison, dashed and dotted lines are included in each panel that indicate values determined for nNOSr and free CLSS.
Discussion
Dual-flavin reductases exist as dynamic mixtures of closed and open conformational forms (14, 17, 18, 20). We engineered a cross-linking site into CL nNOSr to tether its FMN and NADPH-FAD domains and to study how restricting FMN domain movement to varying degrees would affect key aspects of catalysis.
Cross-linking at Cys-1229 and Cys-816 by a Cys–Cys disulfide bond is the shortest possible tether for the two domains, and it mimics the conformationally closed nNOSr crystal structure (6). Having a stable closed form of CLSS allowed us to measure its ET and catalytic properties, which otherwise cannot be derived from the dynamic conformational mixtures that normally exist. We found that restricting the enzyme to a closed conformational state had no discernable impact on its NADPH interaction, but it did enhance the rates of flavin reduction relative to the conformationally free CLSS or to nNOSr (34). Indeed, the rate of interflavin ET (which is essentially the k2 parameter in the model of Fig. 8) was increased by the domain cross-linking. This is consistent with the FAD and FMN isoalloxazine rings being close enough in the closed structure of nNOSr to allow a direct ET between them. We also saw that the rate of flavin reduction became progressively slower as the cross-linker length increased, which in turn was associated with a graded increase in the conformationally open subpopulation. Together, our findings imply that the freedom of motion normally available to the FMN domain in nNOSr or in CLSS actually inhibits the kinetics of their FMN reduction, because it becomes partly rate-limited by the enzyme's conformational equilibrium and dynamics. On a related note, we found that CaM binding to the disulfide cross-linked CLSS did not increase its rate of flavin reduction, which otherwise normally occurs when CaM binds to nNOSr (37). This implies that a change in FMN domain conformational behavior is needed for CaM to have its kinetic effect on flavin reduction. A recent study showed that CaM speeds the conformational dynamics of nNOSr (16), and this effect, in light of our current results, can explain how CaM could speed flavin reduction in nNOSr but fail to do so in the disulfide-linked CLSS.
The disulfide cross-linked CLSS greatly, but not completely, lost its ability to catalyze ET to cytochrome c. We suspect that its residual activity is due to catalysis by the disulfide cross-linked CLSS itself, rather than any contamination by non-cross-linked CLSS. This would be consistent with a low but detectable cytochrome c reductase activity being measured for the isolated nNOS NADPH/FAD domain (33) and for CPR maintaining 5–10% of its activity when its FMN and NADPH/FAD domains have been similarly disulfide cross-linked (27). In any case, our results highlight the importance of FMN domain conformational freedom in facilitating electron flux through nNOSr to cytochrome c and reveal that it is similar in this respect to the related enzyme CPR.
Our study also addressed three related questions. How does a gradual change in FMN domain conformational freedom influence (i) the steady-state cytochrome c reductase activity, (ii) the reactivity of the reduced FMN domain toward cytochrome c, and (iii) the open-closed conformational equilibrium of nNOSr? Before addressing these questions, we should consider the range of conformational freedom that is available to the FMN domain, which may be estimated from the crystal structures of the related enzyme CPR in its open conformations. In two of the open structures, the CPR residues Asp-147 and Arg-514 (analogous to Cys-816 and Cys-1229 in CLSS) are separated by a distance of 40 Å (26), and in a maximally extended CPR structure, they are separated by 85 Å (25). For comparison, our bismaleimide cross-linkers in their fully extended conformations (see Table 1) would allow maximal distances between the Cys-816 and Cys-1229 residues of 11–53 Å, so in principle they can permit a range of conformational freedom that is within what is seen in two of the open CPR structures but would not allow the most extended structure to form. As discussed elsewhere (10, 20, 25, 26, 36, 38), populating maximally extended open conformations may occur for diflavin reductases in solution, but they are not needed to support cytochrome c reduction, which only requires a small displacement and rotation of the FMN domain from the closed structure. In fact, populating the more extended open structures could be detrimental for steady-state catalysis of cytochrome c reduction, because they may require a longer time to re-form the closed conformation after their ET reaction has occurred.
In this context, we observed that the cytochrome c reductase activity of CLSS increased as the cross-linker length increased, with the greatest change occurring between cross-linker maximal lengths of 13–18 Å, after which further lengthening only gave small gains. The same pattern was seen for the CaM-free and CaM-bound proteins. Given these results, and the fact that each cross-link tether may support on average a shorter length than its maximally extended value, our data suggest that affording the FMN domain only a small extent of conformational freedom is enough for it to catalyze electron flux to cytochrome c in our system. This is consistent with a small displacement and rotation of the reduced FMN domain from the closed nNOSr structure as being sufficient for catalysis.
All of the cross-linked CLSS had lower steady-state catalytic activities than free CLSS or nNOSr. This means the domain tethering somehow limited electron flux through CLSS. Their lower reductase activities were not due to a problem in electron loading into the CLSS flavins, which was faster in the cross-linked CLSS, nor was it due to their FMN domain having an inherently lower reactivity toward cytochrome c, because all of the cross-linked CLSS preparations with tethers longer than BMOE contained conformationally open subpopulations whose reduced FMN domain reacted with cytochrome c as fast as it did in the free CLSS (i.e. within the mixing dead time). This kinetic uniformity implies that even a small extent of conformational freedom allows the bound FMN to get close enough to the heme in cytochrome c for rapid ET (39). The kinetic parameters we derived from fitting the cytochrome c reduction traces revealed that the cross-linkers probably slowed electron flux through CLSS by stabilizing its closed conformation and by slowing its conformational dynamics.
Cross-linking had a remarkable capacity to stabilize CLSS in its closed conformation (40–90% closed, depending on the linker), because CLSS otherwise exists primarily in an open conformation in both its fully oxidized and fully reduced states. The cross-linking also restricted the ability of CaM to impact the conformational equilibrium, because it only affected the equilibrium of CLSS in the flavin-oxidized state, whereas CaM shifts the equilibrium of free nNOSr in both its fully oxidized or fully reduced states (16, 17). Providing the cross-link between the NADPH/FAD and FMN domains also made up for the stabilization due to the Arg-1229–Glu-816 salt bridge that normally forms in the domain-domain interface of nNOSr but is lost in CLSS due to the Cys substitutions at these two positions. The longer cross-linkers stabilized the closed conformation of fully reduced CLSS to an extent equivalent to the native Arg-1229–Glu-816 salt bridge (supporting about 50–50 open-closed), whereas the shorter cross-linkers provided even greater stabilization. Because a conformational Keq near 1 is optimal to support electron flux through dual-flavin reductases (36), the ability to bring the conformational Keq of CLSS closer to unity was a positive effect of the longer cross-linker, but this was ultimately overcome by their slowing down the domain conformational dynamics to a point where it lowered steady-state activity relative to the free enzyme.
To conclude, employing cross-linkers of varying length was a successful strategy to control the conformational freedom in CLSS, and it revealed how FMN domain conformational freedom shapes the enzyme's physical and kinetic properties, its CaM response, and its electron flux to cytochrome c. This increases our general understanding of dual-flavin enzymes, and it provides a framework to study how FMN domain conformational freedom influences catalysis of NO synthesis in the full-length NOS.
Experimental procedures
General methods and materials
BMOE, bismaleimidobutane, bismaleimidohexane (BMH), bismaleimido-diethyleneglycol (BM(PEG)2), and bismaleimido-triethyleneglycol (BM(PEG)3) were purchased from Thermo Fisher Scientific (Waltham, MA). Bismaleimido-hexaethyleneglycol and bismaleimido-hendecethyleneglycol were purchased from BROADPHARM (San Diego). All other reagents and materials were obtained from sources reported elsewhere (10). UV-visible spectra and steady-state activity data were obtained using a Shimadzu UV-2401 PC UV-visible spectrophotometer. Origin 8.0 (OriginLab, Northampton, MA) was used to plot and fit all the data unless stated otherwise. All experiments were repeated two or more times with independently prepared batches of proteins. The results were shown as mean ± S.D.
Molecular biology
Rat nNOSr constructs were used (amino acids 695–1429) (31), and they all contained the adjacent N-terminal CaM-binding motif. A previously constructed pCWori expression plasmid (10) containing the Cys-lite rat nNOSr (CL nNOSr) (17) was used for mutagenesis. CL nNOSr double mutant (E816C/R1229C) was prepared by site-directed mutagenesis of the CL nNOSr DNA. First, we mutated the Glu-816 to Cys, and then the E816C mutant was used as a template to mutate Arg-1229 to Cys. Oligonucleotides for site-directed mutagenesis were obtained from Integrated DNA Technologies (Coralville, IA). The primers used to generate the E816C/R1229C mutant were as follows: E816C sense, 5′-GGAGACCCCCCTTGTAACGGGGAGAAATTC-3′, and E816C antisense, 5′-GAATTTCTCCCCGTTACAAGGGGGGTCTCC-3′; R1229C sense, 5′-CCCTGCTTCGTGTGTGGTGCCCCTAGCTTC-3′, and R1229C antisense, 5′-GAAGCTAGGGGCACCACACACGAAGCAGGG-3′. Site-directed mutagenesis was performed using the QuikChange XL mutagenesis kit (Agilent Technologies-Stratagene, La Jolla, CA). The sequences of mutations were confirmed by DNA sequencing at the Cleveland Clinic Genomics Core Facility at the Cleveland Clinic. This mutant is referred to as CLSS.
Expression and purification of wild-type and mutant nNOSr
pCWori vectors containing DNA of either CL, CLSS, of nNOSr were each transformed into Escherichia coli BL21 (DE3), which contained a CaM expression plasmid (10, 17, 35). CL, CLSS, and nNOSr proteins were purified by sequential chromatography on a 2′,5′-ADP-Sepharose affinity column and a CaM-Sepharose affinity column as reported previously (10, 17, 35). Their concentrations were determined using an extinction coefficient of 22.9 mm−1 cm−1 at 457 nm (10, 17, 35).
Preparation of cross-linked, N-ethylmaleimide-conjugated, DTT-treated, or pH 9-treated CLSS
10 mm bismaleimide cross-linker stock solutions were made in DMSO immediately before use, and cross-linking was carried out on ice by incubating protein pre-treated with 10 eq of tris(2-carboxyethyl)phosphine (TCEP) and 5 eq of oxidized nicotinamide adenine dinucleotide phosphate (NADP+) with 2 eq of bismaleimide for 40 min on ice in 40 mm EPPS, 150 mm NaCl, 10% glycerol, pH 7.0 buffer. In the meantime, thiopropyl-Sepharose 4B resin (GE Healthcare) was activated by incubating with 1 mm DTT for 30 min and then washing the resin with 40 mm EPPS, 150 mm NaCl, 10% glycerol, pH 7.0 buffer. Each reaction mixture was then incubated with the activated thiopropyl-Sepharose 4B resin for 40 min on ice to bind and remove any CLSS molecules that had reacted with the bismaleimide but failed to cross-link. The mixture was then centrifuged at 10,000 rpm for 3 min at 4 °C to remove the beads, and the supernatant was loaded onto a PD10 column (GE Healthcare) to remove excess TCEP, NADP+, and bismaleimide.
NEM-conjugated CLSS was prepared using a method described previously (40). DTT-reduced CLSS was prepared by incubating CLSS in 40 mm EPPS, 150 mm NaCl, 10% glycerol, pH 7.6 buffer, containing 0.5 mm DTT for 1 h on ice. The pH 9-treated CLSS was prepared by incubating CLSS in 50 mm Tris-HCl, 150 mm NaCl, pH 9.0 buffer, for 1 h on ice and then passing it through a Sephadex G-25 column (GE Healthcare).
Reactive thiol and maleimide quantification
Reactive thiol groups on the BM cross-linked CLSS (CLSS-BMs) samples or on CL were quantified using the Alexa Fluor 555 maleimide dye (A555, Thermo). A555 maleimide labeling was performed using the method described previously (17). The number of maleimide groups remaining in the CLSS-BM preparations was quantified using Amplite fluorimetric maleimide quantitation kit (AAT Bioquest, CA).
Steady-state cytochrome c reduction assays
The cytochrome c reductase activity of nNOSr proteins was determined by monitoring the absorbance increase at 550 nm using an extinction coefficient of 21 mm−1 cm−1 (31). Experiments were done at 25 or 10 °C and performed in triplicate.
Flavin reduction kinetics and analysis
The anaerobic flavin reduction kinetics were measured using methods reported previously (31, 34). Briefly, fully oxidized nNOSr proteins (10–15 μm) were mixed with NADPH (100 μm) anaerobically in the stopped-flow instrument at 10 °C. In the experiment, the spectrum from 400 to 700 nm or the absorbance change at 457 or 600 nm was recorded over time by SF-61DX2 or SF-61 stopped-flow instruments, respectively (TGK Scientific, UK). The signal to noise ratio in the flavin reduction experiments was improved by averaging 5–7 individual scans in all cases. A double exponential equation was used to fit the recorded traces at 600 nm to obtain the flavin semiquinone formation kf and decay rates kd (34).
Pre-steady-state cytochrome c reduction kinetics and analysis
Experiments and analyses were done essentially as detailed previously (10, 35). Briefly, fully reduced nNOSr proteins (10∼15 μm) were mixed with cytochrome c (100 μm) anaerobically in the stopped-flow instrument at 10 °C. The absorbance at 550 nm when 1 eq of cytochrome c was reduced by each CLSS protein and the conformational equilibrium constant Keq of each CLSS protein were determined using previously published methods (10, 35).
Simulation of pre-steady-state cytochrome c reduction traces
The simulations were performed using methods described in detail previously (10, 35, 36), with modifications. Briefly, and as described under “Results,” a two-state model was used to simulated the pre-steady-state cytochrome c reduction of the pH 9-treated CLSS (disulfide cross-linked CLSS), whereas a modified four-state model was used to simulate the cytochrome c reduction traces of all the CLSS-BM and DTT-treated CLSS proteins. All simulations were done using the program Gepasi version 3.30 (41). All simulated reactions began with 100% of the enzyme in the fully reduced state (36), with the initial concentrations of the open and closed species being calculated from the experimentally determined Keq (36). In the simulation of the two-state transition model, the cross-linked CLSS protein cycles only between the reduced closed and oxidized closed species. The cytochrome c reduction rate constant k4′ for the closed conformation was treated as a variable to determine the best-fit value. The best-fit k4′ value was then used in our other simulations that used the modified four-state model. In these simulations, the four conformational change rates (k1, k−1, k3, and k−3) and the interflavin electron transfer rate (k2) were treated as variables. The cytochrome c reduction rate constant (k4) for the open conformational form was set to be 225 s−1 in all cases (10, 35, 36). Rate constants were first chosen that allowed us to match the cytochrome c reduction rate obtained from each experimental trace and then were refined in an iterative process using the time recorded for the first turnover and the overall best fit to the trace as a criteria to obtain the best-fit rate constants.
Fluorescence spectroscopy
Flavin fluorescence emission of nNOSr proteins was measured in a 1-ml quartz cuvette in a Hitachi model F-2500 spectrofluorometer as reported previously (30) with modifications. Samples contained a 2 μm concentration of each protein in 40 mm EPPS, pH 7.6, containing 3 μm CaM and 0.6 mm EDTA. The samples were excited at 457 nm, and the emission intensity at 530 nm was monitored versus time before and after adding 1 mm CaCl2 and 3 mm EDTA.
Apparent Km of cytochrome c and NADPH
Apparent Km values for NADPH or cytochrome c were determined for the DTT-treated or the pH 9-treated CLSS by Origin 8.0 using the Michaelis-Menten function (42). The ferricyanide reduction activity versus initial NADPH concentration was measured in cuvettes at 420 nm at 25 °C (43), in the absence of CaM and in the presence of an NADPH-regenerating system containing 0.5 unit of glucose-6-phosphate dehydrogenase and 0.5 mm glucose 6-phosphate (44). The cytochrome c reductase activity was measured from the initial rates of absorbance increase at 550 nm as described above, and in the absence of CaM, except the concentration of cytochrome c used here ranged from 0.1 to 100 μm (30).
Author contributions
Y. D. designed the study, performed the experiments, analyzed the data, and prepared the manuscript. M. M. H. carried out the experiments and analyzed the data. D. J. S. designed the study, analyzed the data, and prepared the manuscript. All authors performed critical reading of the manuscript prior to submission and approved the final version of paper.
Acknowledgments
We thank Dr. Saurav Misra and members of the Stuehr laboratory for helpful advice and Deborah Durra for excellent technical assistance.
This work was supported by National Institutes of Health Grants GM51491 and HL081064 (to D. J. S.). The authors declare that they have no conflicts of interest with the contents of this article. The content is solely the responsibility of the authors and does not necessarily represent the official views of the National Institutes of Health.
- NOSoxy
- oxygenase domain of nitric-oxide synthase
- nNOS
- neuronal nitric-oxide synthase
- NOSr
- reductase domain of nitric-oxide synthase
- nNOSr
- reductase domain of nNOS
- CL
- Cys-lite nNOSr
- CLSS
- CL with E816C R1229C mutations
- CaM
- calmodulin
- CPR
- cytochrome P450 reductase
- FMNhq
- two-electron reduced (hydroquinone) FMN
- EPPS
- 4-(2-hydroxyethyl)-1-piperazinepropanesulfonic acid
- DTT
- dithiothreitol
- BMOE
- bismaleimidoethane
- BMH
- bismaleimidohexane
- BM(PEG)2
- bismaleimido-diethyleneglycol
- BM(PEG)3
- bismaleimido-triethyleneglycol
- BM(PEG)6
- bismaleimido-hexaethyleneglycol
- BM(PEG)11
- bismaleimido-hendecethyleneglycol
- NEM
- N-ethylmaleimide
- TCEP
- tris(2-carboxyethyl)phosphine
- A555
- Alexa Fluor 555 maleimide dye
- ET
- electron transfer.
References
- 1. Förstermann U., and Sessa W. C. (2012) Nitric-oxide synthases: regulation and function. Eur. Heart J. 33, 829–837 [DOI] [PMC free article] [PubMed] [Google Scholar]
- 2. Griffith O. W., and Stuehr D. J. (1995) Nitric-oxide synthases: properties and catalytic mechanism. Annu. Rev. Physiol 57, 707–736 [DOI] [PubMed] [Google Scholar]
- 3. Daff S. (2010) NO synthase: structures and mechanisms. Nitric Oxide 23, 1–11 [DOI] [PubMed] [Google Scholar]
- 4. Stuehr D. J. (1997) Structure-function aspects in the nitric-oxide synthases. Annu. Rev. Pharmacol. Toxicol. 37, 339–359 [DOI] [PubMed] [Google Scholar]
- 5. Tejero J., Haque M. M., Durra D., and Stuehr D. J. (2010) A bridging interaction allows calmodulin to activate NO synthase through a bi-modal mechanism. J. Biol. Chem. 285, 25941–25949 [DOI] [PMC free article] [PubMed] [Google Scholar]
- 6. Garcin E. D., Bruns C. M., Lloyd S. J., Hosfield D. J., Tiso M., Gachhui R., Stuehr D. J., Tainer J. A., and Getzoff E. D. (2004) Structural basis for isozyme-specific regulation of electron transfer in nitric-oxide synthase. J. Biol. Chem. 279, 37918–37927 [DOI] [PubMed] [Google Scholar]
- 7. Stuehr D. J., Tejero J., and Haque M. M. (2009) Structural and mechanistic aspects of flavoproteins: electron transfer through the nitric-oxide synthase flavoprotein domain. FEBS J. 276, 3959–3974 [DOI] [PMC free article] [PubMed] [Google Scholar]
- 8. Iyanagi T. (2005) Structure and function of NADPH-cytochrome P450 reductase and nitric-oxide synthase reductase domain. Biochem. Biophys. Res. Commun. 338, 520–528 [DOI] [PubMed] [Google Scholar]
- 9. Spencer A. L., Bagai I., Becker D. F., Zuiderweg E. R., and Ragsdale S. W. (2014) Protein/protein interactions in the mammalian heme degradation pathway: heme oxygenase-2, cytochrome P450 reductase, and biliverdin reductase. J. Biol. Chem. 289, 29836–29858 [DOI] [PMC free article] [PubMed] [Google Scholar]
- 10. Haque M. M., Bayachou M., Tejero J., Kenney C. T., Pearl N. M., Im S. C., Waskell L., and Stuehr D. J. (2014) Distinct conformational behaviors of four mammalian dual-flavin reductases (cytochrome P450 reductase, methionine synthase reductase, neuronal nitric-oxide synthase, endothelial nitric-oxide synthase) determine their unique catalytic profiles. FEBS J. 281, 5325–5340 [DOI] [PMC free article] [PubMed] [Google Scholar]
- 11. Wang M., Roberts D. L., Paschke R., Shea T. M., Masters B. S., and Kim J. J. (1997) Three-dimensional structure of NADPH-cytochrome P450 reductase: prototype for FMN- and FAD-containing enzymes. Proc. Natl. Acad. Sci. U.S.A. 94, 8411–8416 [DOI] [PMC free article] [PubMed] [Google Scholar]
- 12. Iyanagi T., Xia C., and Kim J. J. (2012) NADPH-cytochrome P450 oxidoreductase: prototypic member of the diflavin reductase family. Arch. Biochem. Biophys. 528, 72–89 [DOI] [PMC free article] [PubMed] [Google Scholar]
- 13. Arnett D. C., Persechini A., Tran Q. K., Black D. J., and Johnson C. K. (2015) Fluorescence quenching studies of structure and dynamics in calmodulin-eNOS complexes. FEBS Lett. 589, 1173–1178 [DOI] [PMC free article] [PubMed] [Google Scholar]
- 14. Astashkin A. V., Chen L., Zhou X., Li H., Poulos T. L., Liu K. J., Guillemette J. G., and Feng C. (2014) Pulsed electron paramagnetic resonance study of domain docking in neuronal nitric-oxide synthase: the calmodulin and output state perspective. J. Phys. Chem. A 118, 6864–6872 [DOI] [PMC free article] [PubMed] [Google Scholar]
- 15. Ghosh D. K., Ray K., Rogers A. J., Nahm N. J., and Salerno J. C. (2012) FMN fluorescence in inducible NOS constructs reveals a series of conformational states involved in the reductase catalytic cycle. FEBS J. 279, 1306–1317 [DOI] [PubMed] [Google Scholar]
- 16. Haque M. M., Ray S. S., and Stuehr D. J. (2016) Phosphorylation controls endothelial nitric-oxide synthase by regulating its conformational dynamics. J. Biol. Chem. 291, 23047–23057 [DOI] [PMC free article] [PubMed] [Google Scholar]
- 17. He Y., Haque M. M., Stuehr D. J., and Lu H. P. (2015) Single-molecule spectroscopy reveals how calmodulin activates NO synthase by controlling its conformational fluctuation dynamics. Proc. Natl. Acad. Sci. U.S.A. 112, 11835–11840 [DOI] [PMC free article] [PubMed] [Google Scholar]
- 18. Leferink N. G., Hay S., Rigby S. E., and Scrutton N. S. (2015) Towards the free energy landscape for catalysis in mammalian nitric-oxide synthases. FEBS J. 282, 3016–3029 [DOI] [PubMed] [Google Scholar]
- 19. Welland A., Garnaud P. E., Kitamura M., Miles C. S., and Daff S. (2008) Importance of the domain-domain interface to the catalytic action of the NO synthase reductase domain. Biochemistry 47, 9771–9780 [DOI] [PubMed] [Google Scholar]
- 20. Frances O., Fatemi F., Pompon D., Guittet E., Sizun C., Pérez J., Lescop E., and Truan G. (2015) A well-balanced preexisting equilibrium governs electron flux efficiency of a multidomain diflavin reductase. Biophys. J. 108, 1527–1536 [DOI] [PMC free article] [PubMed] [Google Scholar]
- 21. Huang W. C., Ellis J., Moody P. C., Raven E. L., and Roberts G. C. (2013) Redox-linked domain movements in the catalytic cycle of cytochrome p450 reductase. Structure 21, 1581–1589 [DOI] [PMC free article] [PubMed] [Google Scholar]
- 22. Hubbard P. A., Shen A. L., Paschke R., Kasper C. B., and Kim J. J. (2001) NADPH-cytochrome P450 oxidoreductase. Structural basis for hydride and electron transfer. J. Biol. Chem. 276, 29163–29170 [DOI] [PubMed] [Google Scholar]
- 23. Laursen T., Jensen K., and Møller B. L. (2011) Conformational changes of the NADPH-dependent cytochrome P450 reductase in the course of electron transfer to cytochromes P450. Biochim. Biophys. Acta 1814, 132–138 [DOI] [PubMed] [Google Scholar]
- 24. Pudney C. R., Heyes D. J., Khara B., Hay S., Rigby S. E., and Scrutton N. S. (2012) Kinetic and spectroscopic probes of motions and catalysis in the cytochrome P450 reductase family of enzymes. FEBS J. 279, 1534–1544 [DOI] [PubMed] [Google Scholar]
- 25. Aigrain L., Pompon D., Moréra S., and Truan G. (2009) Structure of the open conformation of a functional chimeric NADPH cytochrome P450 reductase. EMBO Rep. 10, 742–747 [DOI] [PMC free article] [PubMed] [Google Scholar]
- 26. Hamdane D., Xia C., Im S. C., Zhang H., Kim J. J., and Waskell L. (2009) Structure and function of an NADPH-cytochrome P450 oxidoreductase in an open conformation capable of reducing cytochrome P450. J. Biol. Chem. 284, 11374–11384 [DOI] [PMC free article] [PubMed] [Google Scholar]
- 27. Xia C., Hamdane D., Shen A. L., Choi V., Kasper C. B., Pearl N. M., Zhang H., Im S. C., Waskell L., and Kim J. J. (2011) Conformational changes of NADPH-cytochrome P450 oxidoreductase are essential for catalysis and cofactor binding. J. Biol. Chem. 286, 16246–16260 [DOI] [PMC free article] [PubMed] [Google Scholar]
- 28. Panda K., Haque M. M., Garcin-Hosfield E. D., Durra D., Getzoff E. D., and Stuehr D. J. (2006) Surface charge interactions of the FMN module govern catalysis by nitric-oxide synthase. J. Biol. Chem. 281, 36819–36827 [DOI] [PubMed] [Google Scholar]
- 29. Baird E. J., Holowka D., Coates G. W., and Baird B. (2003) Highly effective poly(ethylene glycol) architectures for specific inhibition of immune receptor activation. Biochemistry 42, 12739–12748 [DOI] [PubMed] [Google Scholar]
- 30. Adak S., Ghosh S., Abu-Soud H. M., and Stuehr D. J. (1999) Role of reductase domain cluster 1 acidic residues in neuronal nitric-oxide synthase. Characterization of the FMN-FREE enzyme. J. Biol. Chem. 274, 22313–22320 [DOI] [PubMed] [Google Scholar]
- 31. Konas D. W., Zhu K., Sharma M., Aulak K. S., Brudvig G. W., and Stuehr D. J. (2004) The FAD-shielding residue Phe1395 regulates neuronal nitric-oxide synthase catalysis by controlling NADP+ affinity and a conformational equilibrium within the flavoprotein domain. J. Biol. Chem. 279, 35412–35425 [DOI] [PubMed] [Google Scholar]
- 32. Gachhui R., Presta A., Bentley D. F., Abu-Soud H. M., McArthur R., Brudvig G., Ghosh D. K., and Stuehr D. J. (1996) Characterization of the reductase domain of rat neuronal nitric-oxide synthase generated in the methylotrophic yeast Pichia pastoris. Calmodulin response is complete within the reductase domain itself. J. Biol. Chem. 271, 20594–20602 [DOI] [PubMed] [Google Scholar]
- 33. Konas D. W., Takaya N., Sharma M., and Stuehr D. J. (2006) Role of Asp(1393) in catalysis, flavin reduction, NADP(H) binding, FAD thermodynamics, and regulation of the nNOS flavoprotein. Biochemistry 45, 12596–12609 [DOI] [PubMed] [Google Scholar]
- 34. Guan Z. W., Haque M. M., Wei C. C., Garcin E. D., Getzoff E. D., and Stuehr D. J. (2010) Lys842 in neuronal nitric-oxide synthase enables the autoinhibitory insert to antagonize calmodulin binding, increase FMN shielding, and suppress interflavin electron transfer. J. Biol. Chem. 285, 3064–3075 [DOI] [PMC free article] [PubMed] [Google Scholar]
- 35. Haque M. M., Bayachou M., Fadlalla M. A., Durra D., and Stuehr D. J. (2013) Charge-pairing interactions control the conformational setpoint and motions of the FMN domain in neuronal nitric-oxide synthase. Biochem. J. 450, 607–617 [DOI] [PMC free article] [PubMed] [Google Scholar]
- 36. Haque M. M., Kenney C., Tejero J., and Stuehr D. J. (2011) A kinetic model linking protein conformational motions, interflavin electron transfer and electron flux through a dual-flavin enzyme-simulating the reductase activity of the endothelial and neuronal nitric-oxide synthase flavoprotein domains. FEBS J. 278, 4055–4069 [DOI] [PMC free article] [PubMed] [Google Scholar]
- 37. Abu-Soud H. M., Yoho L. L., and Stuehr D. J. (1994) Calmodulin controls neuronal nitric-oxide synthase by a dual mechanism. Activation of intra- and interdomain electron transfer. J. Biol. Chem. 269, 32047–32050 [PubMed] [Google Scholar]
- 38. Leferink N. G., Pudney C. R., Brenner S., Heyes D. J., Eady R. R., Samar Hasnain S., Hay S., Rigby S. E., and Scrutton N. S. (2012) Gating mechanisms for biological electron transfer: integrating structure with biophysics reveals the nature of redox control in cytochrome P450 reductase and copper-dependent nitrite reductase. FEBS Lett. 586, 578–584 [DOI] [PubMed] [Google Scholar]
- 39. Page C. C., Moser C. C., and Dutton P. L. (2003) Mechanism for electron transfer within and between proteins. Curr. Opin. Chem. Biol. 7, 551–556 [DOI] [PubMed] [Google Scholar]
- 40. Guan L., and Kaback H. R. (2007) Site-directed alkylation of cysteine to test solvent accessibility of membrane proteins. Nat. Protoc. 2, 2012–2017 [DOI] [PMC free article] [PubMed] [Google Scholar]
- 41. Mendes P. (1993) GEPASI: a software package for modelling the dynamics, steady states and control of biochemical and other systems. Comput. Appl. Biosci. 9, 563–571 [DOI] [PubMed] [Google Scholar]
- 42. Qiu Y., Antony E., Doganay S., Koh H. R., Lohman T. M., and Myong S. (2013) Srs2 prevents Rad51 filament formation by repetitive motion on DNA. Nat. Commun. 4, 2281. [DOI] [PMC free article] [PubMed] [Google Scholar]
- 43. Panda K., Adak S., Konas D., Sharma M., and Stuehr D. J. (2004) A conserved aspartate (Asp-1393) regulates NADPH reduction of neuronal nitric-oxide synthase: implications for catalysis. J. Biol. Chem. 279, 18323–18333 [DOI] [PubMed] [Google Scholar]
- 44. Adak S., Wang Q., and Stuehr D. J. (2000) Molecular basis for hyperactivity in tryptophan 409 mutants of neuronal NO synthase. J. Biol. Chem. 275, 17434–17439 [DOI] [PubMed] [Google Scholar]


