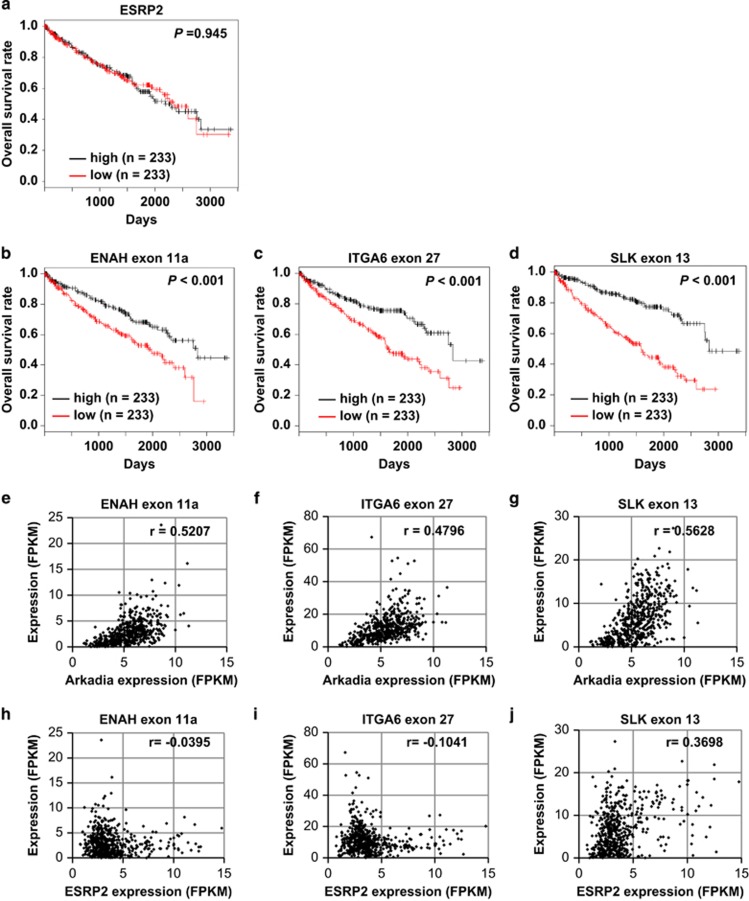
Figure 2.
ESRP-splicing function and prognosis in ccRCC. (a–d) Kaplan–Meier analysis of overall survival in ccRCC patients enrolled in the TCGA database, with classifications based on the expression of ESRP2 mRNA (a), ENAH exon 11a (b), ITGA6 exon 27 (c) or SLK exon 13 (d) in TCGA ccRCC RNA-seq data. Patients were divided into two equally sized groups based on the expression of ESRP2 mRNA or ESRP-target exons. The half of the patients with higher expression of ESRP2 mRNA or each ESRP-target exon are shown in black, and the half of the patients with lower expression are shown in red; n=466. P-values are based on the log-rank significance tests. (e–g) Scatter plots of Arkadia expression and ENAH exon 11a (e), ITGA6 exon 27 (f) or SLK exon 13 (g) expression in TCGA ccRCC RNA-seq data; n=542. (h–j) Scatter plots of ESRP2 expression and ENAH exon 11a (h), ITGA6 exon 27 (i) or SLK exon 13 (j) expression in TCGA ccRCC RNA-seq data; n=542. The r-values were determined using Pearson's correlation. FPKM, fragments per kilobase of exon per million mapped sequence reads.

