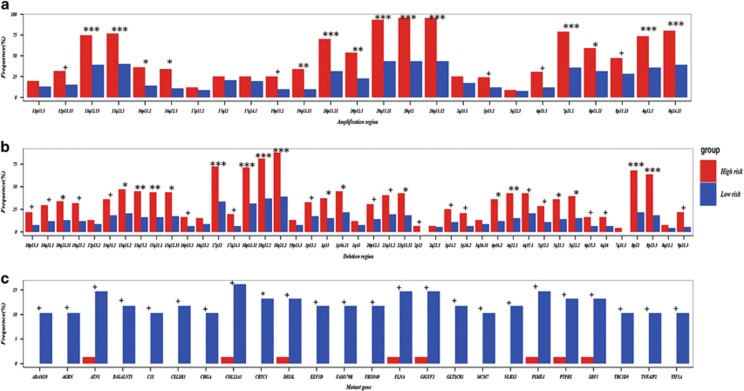
Figure 4.
The copy number aberration regions and mutation genes characterizing the high- and low-risk patients, respectively. The frequencies of (a) 23 amplification regions, (b) 45 deletion regions and (c) 24 mutation genes in the high- and low-risk groups, respectively. The 24 mutation genes exhibited significantly higher frequencies in the low-risk group compared with the high-risk group (Fisher test, P-value<0.01). ***P-value<0.00001, **P-value<0.0001, *P-value<0.001, +P-value<0.05.

