

SUMMARY
The mechanisms underlying the formation of acyl protein modifications remain poorly understood. By investigating the reactivity of endogenous acyl-CoA metabolites, we found a class of acyl-CoAs that undergoes intramolecular catalysis to form reactive intermediates which non-enzymatically modify proteins. Based on this mechanism, we predicted, validated, and characterized a protein modification: 3-hydroxy-3-methylglutaryl(HMG)-lysine. In a model of altered HMG-CoA metabolism, we found evidence of two additional protein modifications: 3-methylglutaconyl(MGc)-lysine and 3-methylglutaryl(MG)-lysine. Using quantitative proteomics, we compared the ‘acylomes’ of two reactive acyl-CoA species, namely HMG-CoA and glutaryl-CoA, which are generated in different pathways. We found proteins that are uniquely modified by each reactive metabolite, as well as common proteins and pathways. We identified the tricarboxylic acid cycle as a pathway commonly regulated by acylation, and validated malate dehydrogenase as a key target. These data uncover a fundamental relationship between reactive acyl-CoA species and proteins, and define a new regulatory paradigm in metabolism.
INTRODUCTION
Protein lysine acetylation and acylation are evolutionarily conserved, reversible post-translational modifications (PTMs). Eukaryotic cellular lysine acylation is enriched on metabolic proteins and negatively regulates fatty acid oxidation, the tricarboxylic acid (TCA) cycle, and the urea cycle, among other processes (Hirschey et al., 2010; Nakagawa et al., 2009; Yu et al., 2012). The NAD+-dependent protein sirtuin deacylases catalyze the removal of acyl modifications, thereby regulating a variety of cellular processes including metabolism, gene transcription, DNA repair, and stress resistance (Anderson et al., 2014; Wagner and Hirschey, 2014). Of the seven mammalian sirtuins (SIRT1-7), wide-spread protein deacetylation is catalyzed by the deacetylases SIRT1, SIRT2, and SIRT3. Protein demalonylation, desuccinylation, and deglutarylation are catalyzed by SIRT5 (Du et al., 2011; Peng et al., 2011; Tan et al., 2014). Modifications of lysine residues with long-chain acyl groups are removed by SIRT6 (Jiang et al., 2013); additionally, several sirtuins remove long-chain acyl-lysine modifications in vitro (Feldman et al., 2013; Madsen et al., 2016). Much work has focused on the mechanisms and physiological relevance of lysine deacylation catalyzed by the sirtuins; in contrast, the mechanisms leading to protein lysine acylation are poorly understood.
While dedicated acetyltransferases catalyze the addition of acetyl modifications on specific proteins, historical and recent evidence has shown that acetyl-CoA is a reactive metabolite that can non-enzymatically acetylate proteins under some conditions (Paik et al., 1970; Wagner and Hirschey, 2014; Wagner and Payne, 2013; Weinert et al., 2014). Non-enzymatic protein acetylation is thought to be a pH-dependent process, with more acetylation occurring at higher pH (Tanner et al., 1999), which could explain wide-spread acetylation in the mitochondrial matrix where the pH is elevated (Wagner and Payne, 2013). Similarly, acetyl-phosphate is a reactive metabolite that may mediate non-enzymatic acetylation of proteins in E. coli (Weinert et al., 2013).
In contrast, less is known about the mechanisms leading to lysine acylation. One observation in a previous study showed that succinylation of proteins by succinyl-CoA was less dependent on the pH of the reaction buffer compared to protein acetylation by acetyl-CoA (Wagner and Payne, 2013). This prior observation suggested that metabolite-intrinsic properties could contribute to differences in the type and abundance of different acyl modifications across the proteome. Understanding these potential differences in acylating behavior is critical to fully understand the mechanisms of protein acylation and the biological importance of this phenomenon in physiological and pathophysiological conditions. The unexpected acylating behavior displayed by succinyl-CoA prompted us to investigate the differences in reactivity between acetyl-CoA and succinyl-CoA towards proteins.
RESULTS
Succinyl-CoA is a Highly Reactive Metabolite
First, we directly compared the protein acylating capacity of acetyl- and succinyl-CoA. Bovine serum albumin (BSA) incubated in 1 mM succinyl-CoA exhibited a molecular mass shift of 5–7 kDa (Figure 1A), suggesting it was heavily succinylated. In contrast, BSA incubated in 1 mM acetyl-CoA exhibited no mass shift (Figure 1A), suggesting significantly lower levels of protein modification. Measuring protein acylation by immunoblotting with acetyl-lysine or succinyl-lysine antibodies showed a strong signal from succinyl-lysine, and much weaker signal from acetyl-lysine (Figure 1A), suggesting that succinyl-CoA is a more reactive agent for protein modification than acetyl-CoA when both are present at equal concentrations.
Figure 1.
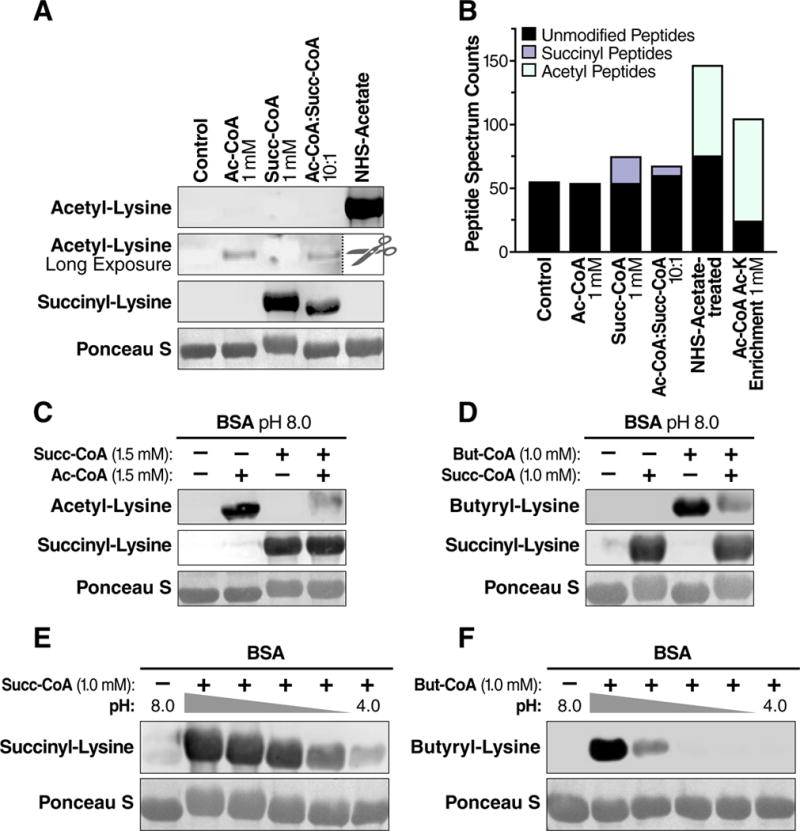
The primary citric acid cycle intermediate succinyl-CoA is an efficient acylating agent. (A) Western blot for acetyl-lysine or succinyl-lysine residues on BSA acylated in vitro with acetyl-CoA and succinyl-CoA. BSA was incubated with different concentrations of acyl-CoAs, NHS-acetate, or immunoenriched with an acetyl-lysine antibody. The acetyl-lysine long exposure was performed after the NHS-acetate treated sample lane was removed. (B) Total peptide spectral matches (PSMs) of unmodified (non-acylated) or acylated (acetyl or succinyl) peptides identified from samples in (A) using liquid chromatography tandem mass spectrometry. (C) Protein acylation by succinyl-CoA outcompetes acylation by acetyl-CoA at equimolar concentration. (D) Protein acylation by succinyl-CoA outcompetes acylation by butyryl-CoA at equimolar concentrations. (E) Western blot for succinyl-lysine or (F) butyryl-lysine residues on BSA acylated by succinyl-CoA or butyryl-CoA over pH range 8–4. The middle lanes are pH 7,6, and 5 from left to right. The nitrocellulose membranes used for immunoblotting were stained with the non-specific protein marker Ponceau S. WB, Western blot.
Since antibodies could display different affinity towards these modifications, we directly investigated if the observed mass-shift correlated with the degree of protein modification by analyzing tryptic digests of the in vitro acylated BSA proteins via nanoflow liquid chromatography mass spectrometry (nLC-MS/MS). We performed these analyses on samples with and without immunoenrichment for acetyl-lysine peptides with an acetyl-lysine antibody. MS analysis of acetyl-CoA treated BSA without acetyl-lysine enrichment showed no evidence of acetyl-lysine containing peptides (Figure 1B), despite excellent protein coverage and clear detection of acetylated lysines by immunoblot (Figure 1A). Importantly, MS-based analysis of samples after immunoenrichment or of BSA samples treated with the acetylating agent N-hydroxysuccinimidyl acetate revealed extensive acetyl-lysine modification (Figure 1B). In contrast, immunoenrichment was not required to detect 21 succinyl-lysine peptides from succinyl-CoA treated BSA (Figure 1B), again consistent with a greater degree of protein modification with this metabolite.
Furthermore, analysis of BSA incubated with acetyl-CoA and succinyl-CoA at a 10:1 ratio (1 mM acetyl-CoA: 0.1 mM succinyl-CoA) resulted in detection of 7 succinyl-lysine containing peptides and no acetyl-lysine containing peptides (Figs. 1A and 1B), supporting the idea that succinyl-CoA is significantly more reactive than acetyl-CoA. Together, these data demonstrate that succinyl-CoA is intrinsically more reactive than acetyl-CoA toward protein amine groups.
Acetyl-CoA and succinyl-CoA differ by their respective number of acyl carbons, as well as by charge at physiological pH. To test if the number of carbons was important for the apparent reactivity of succinyl-CoA, we directly compared the reactivity of succinyl-CoA (4 carbons, charged) to butyryl-CoA (4 carbons, uncharged) and acetyl CoA (2 carbons, uncharged) against BSA. Importantly, succinyl-CoA outcompeted equimolar concentrations of acetyl-CoA and butyryl-CoA for protein acylation as measured by immunoblotting (Figure 1C & 1D). Together, these data show that succinyl-CoA is intrinsically more reactive than acetyl-CoA or butyryl-CoA, and results in significantly more protein modifications on BSA.
A terminal carboxylic acid differentiates succinyl-CoA from the uncharged acyl chains of acetyl- or butyryl-CoA, suggesting this functional group could underlie its increased reactivity. The titratable nature of succinyl-CoA’s carboxylic acid prompted us to interrogate its acylating behavior over a range of pH. Incubating BSA with 1 mM succinyl-CoA from pH 4 to 8 demonstrated that lysine succinylation occurred over a broad pH range, and was only partially attenuated at pH 4–5, which is the approximate pKa of carboxylic acids (Figure 1E). This broad reactivity of succinyl-CoA was also observed using purified bovine glutamate dehydrogenase, demonstrating this acylation behavior is not specific to BSA (Figure S1A). In contrast to succinylation, protein butyrylation by butyryl-CoA occurred predominantly at alkaline pH (Figure 1F), consistent with the behavior of acetylation by acetyl-CoA (Wagner and Payne, 2013). Together, these data show that succinyl-CoA is a highly reactive endogenous metabolite, and can modify proteins over a wide range of pH.
Succinyl-CoA has a short half-life of 1–2 hours at room temperature and pH 7.5 (Simon and Shemin, 1953). This unusual instability was postulated to result from a chemical phenomenon called intramolecular general base catalysis, wherein the proximity of the carboxylate to the acyl carbonyl carbon promotes a nucleophilic attack and self-hydrolysis (Bender, 1960). Importantly, self-hydrolysis of succinyl-CoA is predicted to generate free coenzyme A (CoASH) and a highly reactive cyclic anhydride intermediate. To test the possibility that intramolecular general base catalysis could underlie the reactivity of succinyl-CoA, we first monitored the formation of free CoASH from several acyl-CoAs. Ellman’s Reagent (5, 5′-dithiobis-(2-nitrobenzoic acid); DTNB) reacts with free thiols and can be used to quantify unbound CoA. We found the acyl-CoAs including acetyl-, butyryl-, propionyl-, and hexanoyl-CoA liberated minimal CoASH at pH 8.0 and were relatively stable over time (Figure 2A & S1C). In contrast, succinyl-CoA generated ~10-fold more free CoASH than the other acyl-CoAs tested over 15 minutes, which steadily increased over time (Figure 2A & S1B). Using a zero-order kinetic model, the half-life of succinyl-CoA was calculated at approximately 1.15 hours (~70 minutes) (Figure S1C), in agreement with a previous report (Simon and Shemin, 1953). These results support the model that succinyl-CoA undergoes self-hydrolysis through intramolecular general base catalysis.
Figure 2.
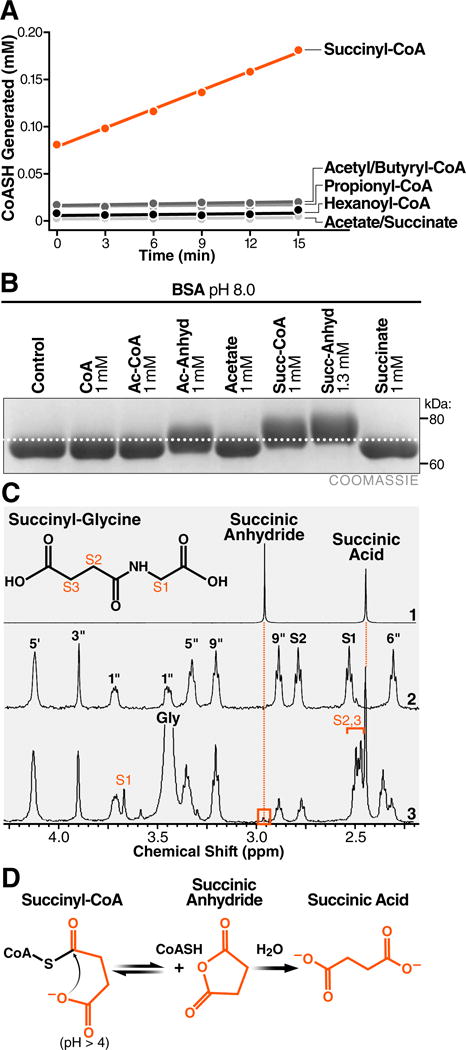
Succinyl-CoA undergoes intramolecular catalysis-mediated formation of a highly reactive cyclic anhydride intermediate. (A) Equimolar acyl-CoAs were monitored for the formation of free CoASH with Ellman’s reagent. (B) Comparison of mass shifts induced by incubation of BSA with acetyl-CoA, acetic anhydride, succinyl-CoA, or succinic anhydride. (C) Expansions of proton NMR spectra demonstrating the formation of succinyl-glycine from succinyl-CoA and glycine at pH 5.0. (1) Succinic anhydride and succinic acid at pH 5.0. (2) Succinyl-CoA with assignments based on (Laurieri et al., 2014). The S1 and S2 peaks correspond to the succinyl methylene groups. (3) Succinyl-CoA with glycine at pH 5.0. The reaction produces succinyl-glycine with assignments indicated. Succinyl-CoA generates a small peak at 2.96 ppm that is consistent with the transient formation of the cyclic succinic anhydride intermediate. (D) Model of succinyl-CoA undergoing intramolecular catalysis to form a reactive anhydride intermediate.
In addition to generating free CoASH, self-hydrolysis of succinyl-CoA is predicted to form a cyclic anhydride intermediate, which may convert back to an acyl-CoA or hydrolyze to a free acid. Importantly, in the presence of protein (e.g., in biological systems) this anhydride intermediate would robustly react with free lysine ε-amino groups, generating succinyl-lysine protein modifications. To test this prediction, we first compared the reactivity of various acyl-CoAs and their related anhydrides by monitoring molecular mass shifts of modified proteins. Incubating protein with 1 mM acetyl-CoA did not induce a protein mass shift, but 1 mM acetic anhydride induced a mass shift of approximately 3 kDa, demonstrating anhydrides are more reactive towards protein than thioesters and can be monitored by protein mass shifts (Figure 2B). In contrast, both succinyl-CoA and succinic anhydride, but not succinic acid, induced comparable protein mass shifts of 5–7 kDa (Figure 2B), supporting the idea that production of a reactive anhydride intermediate could explain the increased reactivity of succinyl-CoA against proteins.
To further test the possibility that succinyl-CoA was forming a succinic anhydride intermediate, we used 1H-NMR to monitor this transient species. “Glycine trapping” is one strategy to measure reactive anhydride intermediates (Buckel, 1976), which leverages the ability of anhydride intermediates, but not acyl-CoA thioesters, to react with the amino group of glycine under standard conditions. Therefore, we measured the ability of acetyl- or succinyl-CoA incubated with glycine to form an acyl-glycine product. As expected, incubating acetyl-CoA with excess glycine failed to generate an acetylglycine product at pH 5, 6, or 7, indicating that the acyl thioester group does not readily react with glycine under these conditions (Figure S2). In contrast, succinyl-CoA generated a succinyl-glycine product at each pH tested (Figure 2C & Figure S2), demonstrating that this reaction must involve a higher-energy (non-thioester-based) intermediate. Remarkably, one NMR spectrum showed that succinyl-CoA generated a small peak consistent with the transient formation of succinic anhydride, providing direct evidence that succinyl-CoA forms a cyclic anhydride intermediate in this system (Figure 2C). Together, these results support the model that succinyl-CoA facilitates protein lysine succinylation through the intramolecular catalysis-mediated formation of a high-energy anhydride intermediate, and provides an explanation for its increased reactivity (Figure 2D).
HMG-CoA and Glutaryl-CoA are Similarly Reactive Metabolites
Several dicarboxyl-acyl compounds with four- or five-carbon acyl backbones are known to undergo intramolecular catalysis (Bender, 1960), but the relevance of this concept in the context of biologically activated primary metabolites has not been explored. Lysine glutarylation was recently identified as a protein modification likely derived from glutaryl-CoA, which is a five-carbon CoA thioester (Tan et al., 2014). Therefore, we considered whether glutaryl-CoA could also induce protein lysine acylation through intramolecular catalysis and anhydride formation. We found that similar to succinyl-CoA, glutaryl-CoA displayed a time-dependent increase in CoASH generation indicative of self-hydrolysis and anhydride formation (Figure 3A & S3A). Additionally, 1H-NMR analysis demonstrated the formation of glutaryl-glycine from glutaryl-CoA, but no formation of butyryl-glycine from butyryl-CoA (Figure 3B and S3C–D). Consistent with this model, glutaryl-CoA acylated BSA over a wide range of pH (Figure 3C), exhibited similar molecular mass shifts as protein treated with glutaric anhydride (Figure 3C), and acylated BSA at least five-fold more efficiently than butyryl-CoA or malonyl-CoA (Figure 3D). Together, these results indicate that glutaryl-CoA, like succinyl-CoA, can undergo intramolecular catalysis to form high-energy cyclic anhydride intermediates, leading to protein lysine glutarylation.
Figure 3.
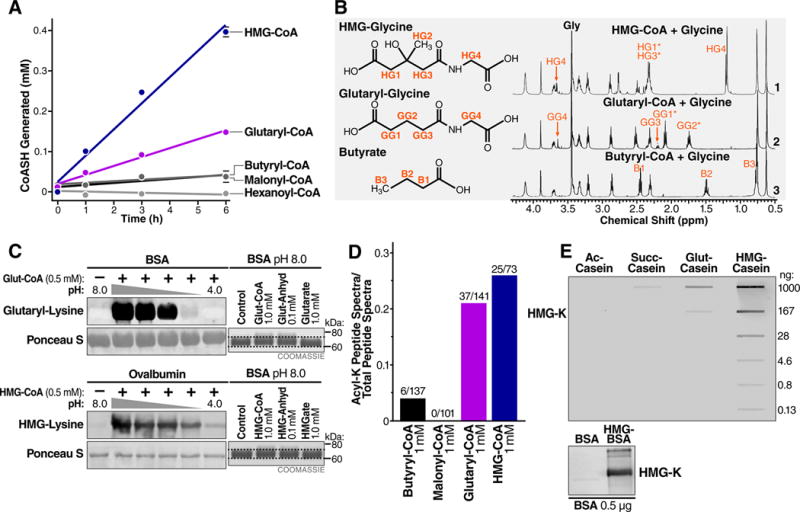
Endogenous five-carbon dicarboxyl acyl-CoAs undergo intramolecular catalysis and anhydride formation. (A) Equimolar acyl-CoAs were monitored for the formation of free CoASH with Ellman’s reagent. (B) Proton NMR spectra of acyl-glycine formation after incubating (1) HMG-, (2) glutaryl-, and (3) butyryl-CoA with glycine at pH 7.0. (C) (Left) the acylation of BSA by glutaryl-CoA and HMG-CoA over pH range 8–4. The middle lanes are pH 7,6, and 5 from left to right. The nitrocellulose membranes used for immunoblotting were stained with Ponceau S for loading. (Right) Comparison of mass shifts induced by incubation of BSA with glutaryl-CoA, HMG-CoA and their related anhydrides and acids. (D) BSA was acylated in vitro with butyryl-CoA, malonyl-CoA, glutaryl-CoA, or HMG-CoA and subjected to liquid chromatography tandem mass spectrometry. Fraction of acylated peptide spectra (butyryl, malonyl, glutaryl, and hydroxymethylglutaryl) identified out of the total number of peptide spectra (acyl-lysine and non-acyl-lysine) is shown. (E) (Top) Sensitivity and specificity of purified HMG-K antiserum was tested against the indicated amounts of casein after acetylation (ac-casein), succinylation (suc-casein), glutarylation (glut-casein), and HMGylation (HMG-casein). (Bottom) The hydroxymethylglutaryl-lysine (HMG-K) antiserum recognizes BSA chemically modified to contain hydroxymethylglutaryl-lysine modifications, but not unmodified BSA.
Because succinyl-CoA and glutaryl-CoA readily form reactive anhydrides at physiological pH and temperature, and have corresponding validated PTMs associated with them (lysine succinylation and glutarylation, (Tan et al., 2014; Zhang et al., 2011)), we considered the possibility that other endogenous four- and five-carbon backbone dicarboxylacyl-CoAs might exhibit similar behaviors. One metabolite that has a similar structure to glutaryl-CoA is 3-hydroxy-3-methylglutaryl-CoA (HMG-CoA). This dicarboxyl CoA metabolite has a similar five-carbon backbone, plus an additional carbon in the 3-position (Figure 4A). HMG-CoA is an important intermediary metabolite generated in leucine catabolism, ketogenesis, and sterol biosynthesis. To determine if HMG-CoA exhibited similar behavior as succinyl-CoA and glutaryl-CoA, we monitored its reactivity profile. Remarkably, HMG-CoA generated more free CoASH over time than glutaryl-CoA (Figure 3A & S3A), was reactive against glycine at neutral pH (Figure 3B & S3E,F), and acylated BSA at least six-fold more efficiently than butyryl-CoA (Figure 3D), indicating that HMG-CoA is another biological metabolite that undergoes intramolecular catalysis to form an anhydride intermediate.
Figure 4.
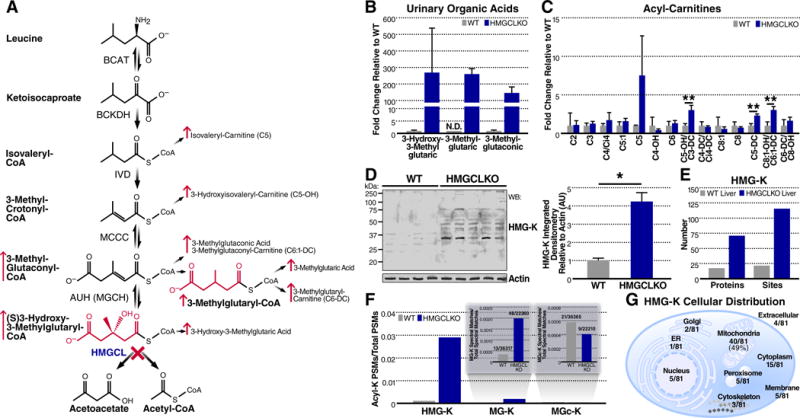
Lysine HMGylation is an endogenous protein modification. (A) Schematic of leucine catabolism indicating the step compromised in HMGCL deficiency and consequent elevation of acyl-CoAs, organic acids, and acyl-carnitines. (B) Relative quantification of select organic acids derived from leucine catabolism from urine in WT and HMGCLKO mice. Levels of 3-methylglutaric acid in WT urine were not detectable (N.D.), therefore, a relative comparison is depicted with the WT value set to 0.1 and fold-change derived accordingly. Data represent mean ± SEM (C) Relative quantification of selected acyl-carnitines in WT and HMGCLKO mouse livers. Multiple t-tests were used to evaluate statistical significance without correction for multiple comparisons. Data represent mean ± SD **P ≤ 0.01. (D) Western blot probing for HMG-lysine modifications and actin in WT (n=4) and HMGCLKO (n=5) liver lysates. At right, quantification of integrated densitometry in the Western blot normalized to actin. A two-tailed Mann-Whitney U test was used to evaluate statistical significance. Data represent mean ± SD *P ≤ 0.05. (E) Summary of HMG-K containing peptides and proteins identified in WT and HMGCLKO livers (F) The fraction of peptide spectral matches identified in the HMG-K immunoprecipitation containing HMG-lysine, 3-methyglutaryl-lysine (MG-K), and 3-methylglutaconyl-lysine (MGc-K) modifications. (G) The cellular distribution of HMG-K containing proteins identified in the HMG-K immunoprecipitation.
In contrast to four- and five-carbon CoA thioesters, we predicted malonyl-CoA (3 carbons, charged) would not be as reactive, because with fewer carbons it cannot undergo intramolecular catalysis and cyclic anhydride formation. To test this, we monitored the reactivity of malonyl-CoA using the same strategies as described above. First, we measured the rates of self-hydrolysis and found that malonyl-CoA liberated minimal CoASH compared to succinyl-, glutaryl-, or HMG-CoA (Figure 3A), demonstrating elevated rates of self-hydrolysis are not a general feature of negatively charged dicarboxyl acyl-CoAs. Next, we monitored its reactivity profile against BSA, and found low levels of protein malonylation observed by western blotting (Figure S3G). As expected, succinyl-CoA also outcompeted equimolar concentrations of malonyl-CoA for protein acylation as judged by the molecular mass shift that occurred exclusively in the succinyl-CoA treated conditions, but not in the malonyl-CoA treated condition (Figure S3G). Finally, we measured the fraction of malonylated peptides by MS, but found none, consistent with low intrinsic reactivity of this metabolite (Figure 3D). Together, these data suggest the negative charge of dicarboxyl-acyl-CoAs cannot explain their elevated reactivity, and support the model that intramolecular catalysis and anhydride formation is a key mechanism underlying the elevated reactivity of a succinyl-, glutaryl-, and HMG-CoAs.
Lysine HMGylation is Found on a Wide Range of Proteins in vivo
To further characterize HMG-CoA-mediated protein 3-hydroxy-3-methylglutarylation (HMGylation), we generated an antibody recognizing HMG-lysine. Briefly, rabbits were immunized with a chemically HMGylated BSA antigen to produce HMG-lysine antiserum. This anti-serum showed specific reactivity against HMG-modified proteins, compared to glutaryl-, succinyl-, or acetyl-proteins (Figure 3E). Using this antiserum, we found HMG-CoA also caused acylation of proteins under acidic conditions in vitro (Figure 3C), consistent with glutaryl-CoA and succinyl-CoA. Together, these data demonstrate that HMG-CoA undergoes intramolecular catalysis to generate a high-energy anhydride intermediate, which can modify prototypical proteins under a wide pH range in vitro.
Next, we considered the possibility that the reactivity of HMG-CoA can similarly lead to protein HMGylation in vivo. Hydroxymethylglutaryl-CoA lyase (HMGCL) is an enzyme in ketogenesis and leucine catabolic pathways which converts HMG-CoA to acetoacetate and acetyl-CoA (Figure 4A). HMGCL deficiency (OMIM 613898) is a severe human inborn error associated with hypoketotic-hypoglycemia and often early death (Mitchell et al., 1998). This disorder has been modeled with liver-specific HMGCL ablation (HMGCLKO) in mice, which leads to fasting intolerance and shortened lifespan (Gauthier et al., 2013). Consistent with HMGCL-deficient patients, HMGCL-deficient mice exhibited a marked increase in urinary 3-hydroxy-3-methylglutaric acid, which is an acidic derivative of the corresponding acyl-CoA (Figure 4B and Table S1). These data suggested that in the absence of HMGCL, accumulating HMG-CoA could lead to elevated protein HMGylation.
Using our pan-hydroxymethylglutaryl-lysine antiserum (Figure 3E), we measured protein lysine HMGylation in liver lysates from wild-type (WT) and liver-specific HMGCL knockout mice via immunoblotting. We found a significant and marked four-fold increase in protein HMGylation in HMGCLKO mouse livers compared to WT mice (Figure 4D). Importantly, the HMGylated protein signal was competed away by co-treating immunoblots with chemically HMGylated BSA, confirming this signal was specific to HMG modifications and not caused by non-specific reactivity of the antiserum (Figure S4A). No differences in protein lysine acetylation, succinylation, or glutarylation were observed in the HMGCL knockout samples (Figures S4B–D), demonstrating the specificity of elevated protein HMGylation in this disease model.
To identify the HMG-modified proteins, we performed immunoenrichment and nLC-MS/MS-based proteomic analysis of tryptic peptides derived from WT and HMGCL knockout mouse livers and monitored for peptides with a +144.04226 Dalton mass shift as a variable modification on lysine residues (HMG-lysine). At a 1% false discovery rate (FDR), this analysis detected 22 sites across 18 proteins with lysine HMGylation in WT livers, whereas 115 sites across 72 proteins were detected in HMGCL deficient livers (Figure 4E, and Table S2). Consistent with HMGCL being a mitochondrial protein, and HMGCL deficiency leading to elevations in reactive HMG-CoA, we found that nearly 50% of the HMGylated proteins in HMGCL deficient livers were localized to mitochondria (Figure 4F) (Calvo et al., 2016). These results demonstrate HMG-lysine is a PTM present in WT mice and the prevalence of HMGylation increases in HMGCL deficiency.
In addition to elevations in urinary 3-hydroxy-3-methylglutaric acid in HMGCLKO mice, we observed elevated 3-methylglutaconic acid and 3-methylglutaric acid (Figure 4B), suggesting 3-methylglutaconyl (MGc)-CoA and 3-methylglutaryl (MG)-CoA might be elevated. Humans with HMGCL deficiency excrete the diagnostically specific metabolite 3-methylglutaryl-carnitine (Roe et al., 1986), which is a water-soluble analog of 3-methylglutaryl-CoA. While the origin of 3-methyglutaryl-CoA is not completely known, it is likely formed by a non-specific reductase acting on 3-methylglutaconyl-CoA (Roe et al., 1986). Consistent with these prior observations, acyl-carnitine profiling of mouse liver tissue (Koves et al., 2005) suggested elevated 3-methylglutaryl-carnitine (C6-DC), which was confirmed by separating 3-methylglutaryl-carnitine from its C6-DC isomer adipoyl-carnitine by derivatization of acyl-carnitines to butyl esters followed by LC-MS (Figures 4C and S4F)(Kraus et al., 2015). Interestingly, we also observed a series of elevated C6:1-DC species suggestive of 3-methylglutaconyl-carnitine (Figures 4C and S4F). Together, these data suggested that like HMG-CoA, MG-CoA and MGc-CoA are also elevated in HMGCL deficiency. Thus, to further interrogate this model of reactive acyl-CoAs leading to protein modifications, we tested if 3-methylglutaryl-lysine (MG-K, MGylation) or 3-methylglutaconyl-lysine (MGc-K, MGcylation) are additional protein modifications formed in the setting of HMGCL deficiency.
Since our HMG-K antibody cross-reacted with BSA chemically labeled to contain MG-K modifications (Figure S4E), we re-searched our non-quantitative mass spectral data from the HMG-K peptide immunoprecipitations for a variable mass shift corresponding to MG-K (+128.04734 Da) or MGc-K (+126.0316941 Da). We indeed observed evidence for peptides corresponding to both MG-K and MGc-K (Figure 4G and Table S2), suggesting that like HMGylation by HMG-CoA, MGylation and MGcylation are protein modifications derived from elevated MG-CoA and MGc-CoA.
Quantitative Proteomics Reveals Overlap Between the HMGylome and Glutarylome
While this proteomic strategy identified the breadth of changes in HMGylation by comparing WT and HMGCLKO mice, its qualitative nature provided little information on the depth of changes; specifically, whether more proteins are modified in HMGCLKO mice, whether proteins that are modified in HMGCLKO mice contain more HMGylation, or both. Therefore, we set out to obtain a more comprehensive and quantitative HMGylome. Because protein lysine HMGylation is predominantly found on mitochondrial proteins (Figure 4F), we isolated liver mitochondria from WT and HMGCLKO animals and performed quantitative proteomics with isobaric tags using a previously optimized strategy for PTM analysis (Grimsrud et al., 2012) (Figure 5A). From the peptides identified at 1% FDR, we identified 681 sites of HMGylation across 234 proteins (Figure 5B). Quantitatively comparing HMGylation in WT and HMGCLKO samples showed dramatically increased HMGylation occurring at virtually every quantifiable site in the HMGCLKO mitochondria (Figure 5C). Nearly all HMGylation sites had a positive fold-change in the HMGCLKO mice relative to WT, with minimal changes in total protein abundance—other than HMGCL—assessed from performing MS analysis on a small fraction of the IP input (Figure 5C & S5A). The majority of proteins we identified contained one site of HMGylation; however, 32 proteins contained more than five sites of HMGylation (Figure 5D). Remarkably, we found several proteins with greater than 50-fold elevations in acylation in HMGCLKO mice compared to WT (Figure 5E). Interestingly, proteins related to ketogenesis or leucine degradation are among those that are the most heavily HMGylated (Figure 5E), suggesting that HMG-CoA generated in these pathways is a reactive metabolite that locally and non-enzymatically reacts with proteins to form HMG-lysine protein modifications.
Figure 5.
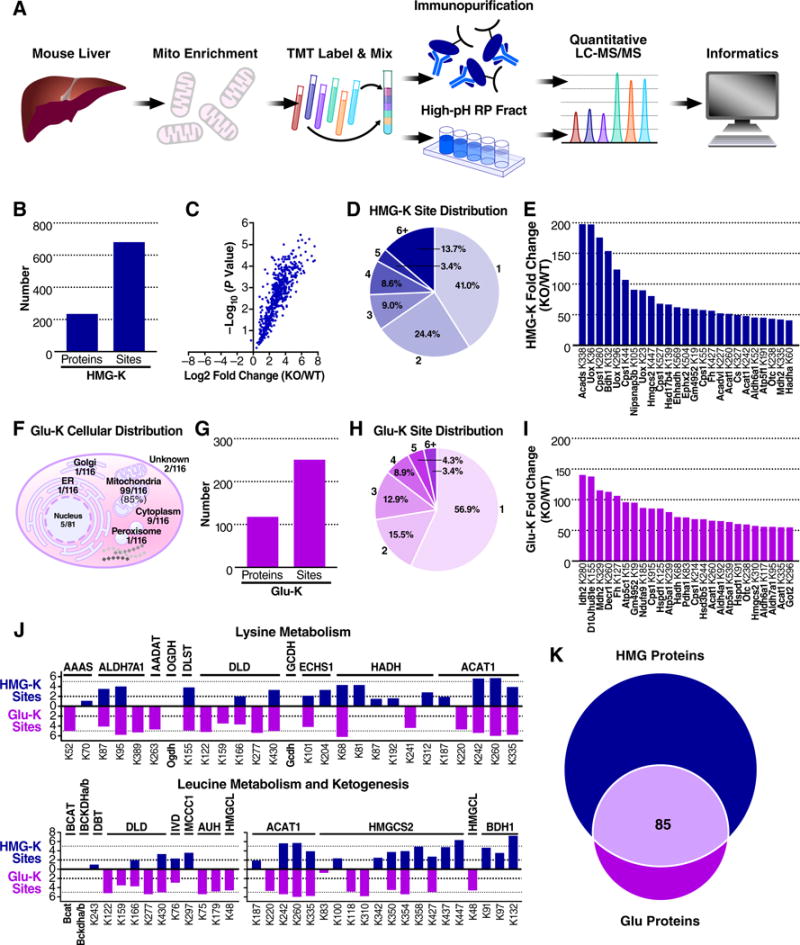
Quantitative proteomics reveals the breadth and depth of the mitochondrial HMGylome. (A) Proteomic workflow. (B) Summary of HMGylated proteins and sites identified through quantitative proteomics (C) Volcano plot of log2 fold-change in HMGylation at sites identified in the HMGCLKO mitochondria relative to WT mitochondria and their associated −log10 P values. (D) Distribution of the number of HMGylation sites on HMGylated proteins. (E) Protein lysine residues displaying the greatest increases in HMGylation in HMGCLKO mitochondria. (F) Cellular distribution of glu-K proteins identified in GCDHKO mouse liver. (G) Summary of glutarylated proteins and sites identified through quantitative proteomics. (H) Distribution of the number of glutarylation sites on glutarylated proteins. (I) Protein lysine residues displaying the greatest increases in glutarylation in GCDHKO liver, relative to WT. (J) Fold-change in HMGylation (blue) and glutarylation (purple) at specific sites on proteins of lysine metabolism and leucine metabolism and ketogenesis in HMGCLKO and GCDHKO samples, relative to their respective WT controls. (K) The number of proteins containing a detected site of lysine HMGylation, lysine glutarylation, or both.
To further test this concept, we compared the “HMGylome” from HMGCLKO mice to the “glutarylome” from glutaryl-CoA dehydrogenase knock-out (GCDHKO) mice. Glutaryl-CoA is elevated in a mouse model of Glutaric Acidemia Type I (GA, OMIM 231670) and is well known to modify proteins (Tan et al., 2014). Since glutaryl-CoA and HMG-CoA are reactive metabolites with near-equal potency (Figure 3), but are generated in different metabolic pathways, we hypothesized that proteins in the lysine metabolic pathway might be more glutarylated, while proteins in the leucine or ketogenic pathways might be more HMGylated. We performed TMT-based quantitative proteomics on liver lysates collected from GCDHKO mice, similar as performed on HMGCLKO mice. Consistent with the idea that reactive metabolites locally modify proteins, and acyl-coAs typically cannot cross organelle/cellular membranes, we found the majority of glutarylated sites were on mitochondrial proteins (Figure 5F). We quantified 249 sites of glutarylation across 116 unique proteins (Figure 5G). Similar to the HMGylome, we found most proteins had one or two sites of glutarylation (Figure 5H), and found several glutarylated proteins in the GCDHKO mice with greater than 50-fold elevations in acylation compared to WT (Figure 5I).
Next, we directly compared the levels of HMGylation (blue) to the levels of glutarylation (purple) on proteins in the lysine, leucine, and ketogenic pathways (Figure 5J). In the lysine metabolic pathway, glutaryl-CoA is converted to crotonyl-CoA by GCDH. In the absence of GCDH, glutaryl-CoA heavily glutarylates all of the enzymes upstream of GCDH (Figure 5J). In contrast, we saw no pattern of HMGylation on proteins in the lysine metabolic pathway in HMGCLKO mice, supporting the concept that proteins in a pathway that generates a reactive metabolite are susceptible to non-enzymatic acylation. Upon inspection of the ketogenic pathway, we found all of the enzymes were heavily HMGylated in HMGCLKO mice (Figure 5J). Interestingly, beta-hydroxybutyrate dehydrogenase (BDH1) was significantly HMGylated in HMGCLKO mice, but no glutarylation was detected for this protein in GCDHKO mice. In contrast, proteins in the leucine metabolic pathway showed elevations in both HMG and glutaryl modifications (Figure 5J). Comparing the protein acylomes reveals both unique and overlapping protein acylation signatures for HMGylation and glutarylation (Figure 5K). Together, these data suggest that some pathways are susceptible to modification by specific protein acyl modifications, whereas other pathways are commonly modified regardless of the acyl-CoA metabolite.
The TCA Cycle is Commonly Modified by Protein Acylation
The TCA cycle is one pathway with strong overlapping protein HMGylation and glutarylation signatures (Figures 6A–D), suggesting this pathway may be commonly regulated by protein acylation. Indeed, acetylation has previously been shown to regulate the TCA cycle (Hebert et al., 2013; Zhao et al., 2010). We found every protein in the TCA cycle contained at least one site of HMGylation, and most sites were significantly elevated in the absence of HMGCL (Figures 6A and 6B). Every protein in the TCA cycle contained at least one site of glutarylation except the succinyl-CoA synthetase complex in GCDH deficiency; again, most sites were significantly elevated (Figures 6C and 6D).
Figure 6.
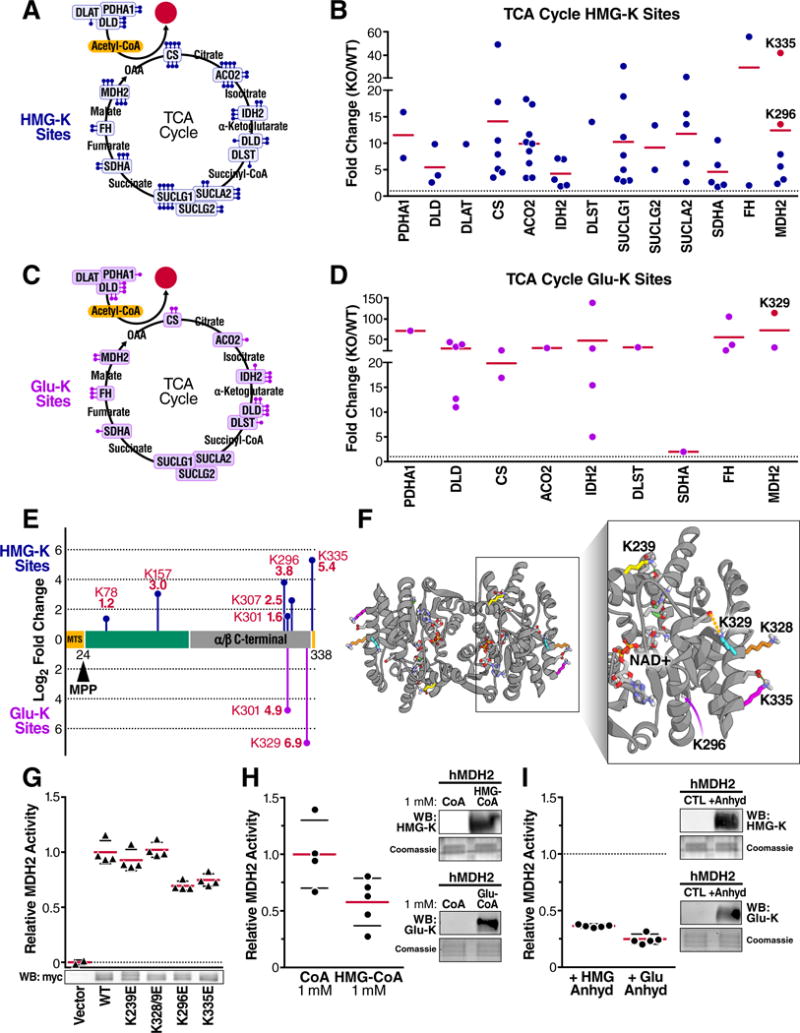
Acylation reduces MDH2 activity. (A) Summary of TCA Cycle proteins with elevated HMGylation in HMGCLKO liver mitochondria as determined through quantitative TMT proteomics. Each ball-stick represents one unique quantifiable site of HMGylation. (B) Site-specific relative fold-change in HMGylation occurring on proteins in the TCA cycle in HMGCLKO mitochondria relative to WT. HMGylation sites found on MDH2 that were mutated are colored in red. Horizontal lines represent the average fold change for all sites within a protein. (C) Similar to (A), but showing sites of glutarylation found GCDHKO mouse liver (D) Similar to (B), but showing relative fold change in glutarylation sites found in GCDHKO mouse liver. (E) The protein domains plotted in the amino acid sequence of MDH2 showing the quantified sites of HMGylation and glutarylation as blue and purple ball-stick diagrams, respectively. The height of the mark represents the relative fold increase in modification at that site. (F) Structural analysis of human MDH2 crystal structure (PDB 2DFD) modeling lysines 239, 296, 328/9 and 335 and relevant intramolecular interactions. The dashed green lines indicate hydrogen bonds and the dashed orange lines indicate electrostatic interactions. (G) Relative activity of recombinant human wild-type MDH2 and mutant MDH2 containing lysine (K) to glutamate (E) mutations overexpressed in 293T cells and activity was measured in cell lysates; values corrected for vector control activity and MDH2 protein abundance. Below, a representative Western blot probing for myc in cell lysate containing the overexpressed MDH2-myc constructs. (H) Relative catalytic activity of human recombinant MDH2 after incubation with coenzyme A (CoA) (n = 4) or 3-hydroxy-3-methylglutaryl-CoA (HMG-CoA) (n = 5) for 12 hours. At right, Western blots for HMG-K or glu-K modifications in CoA, HMG-CoA, and glutaryl-CoA treated hMDH2 samples. (I) Catalytic activity of human recombinant malate dehydrogenase 2 (hMDH2) after incubation with hydroxymethylglutaric anhydride or glutaric anhydride for 5 minutes (n = 5 for both conditions) relative to untreated MDH2. At right, Western blots for HMG-K or glu-K modifications in HMG anhydride and glutaric anhydride treated hMDH2 samples. Data represent mean ± standard deviation. WB, Western blot.
To identify how acylation influences TCA cycle enzyme function, we further tested the effects of HMGylation and glutarylation on malate dehydrogenase (MDH2). Previous studies have shown that MDH2 is regulated by acetylation (Hebert et al., 2013; Zhao et al., 2010). Importantly, our proteomic analyses showed MDH2 was hyperacylated in both HMGCLKO and GCDHKO mouse models (Figures 6B and D). We searched our proteomic data for modified lysines with the potential to be functionally relevant based on known MDH2 sequence annotation and site-specific increases in HMGylation and glutarylation (Figures 6E and 6F). We found MDH2 lysines 239 (K239) and 329 (K329) were HMGylated in our qualitative data (Table S2), and K239 was previously described to be a site that is also acetylated and influences its activity (Hebert et al., 2013). In our quantitative data, MDH2 lysine 296 (K296) and lysine 335 (K335) showed 13-fold and 42-fold increases in HMGylation, respectively, in HMGCLKO mice (Figures 6B, E and Table S3). Furthermore, we found K329 was the lysine with the largest increase in glutarylation in GCDHKO mice (Figures 6D and 6E). Interestingly, we previously found all of these lysines were glutarylated in the absence of SIRT5 (Tan et al., 2014), indicating that they may be regulatory sites in addition to being reactive sites. Thus, we experimentally mimicked the effect of HMGylation and glutarylation on MDH2 at K239, K329, K296, and K335 by mutating these residues to glutamate (K239E, K296E, K328/9E, and K335E). While glutamate is an imperfect HMG- or glutaryl-lysine mimetic, this amino acid substitution best reproduces the negative charge introduced by these acylation marks. We measured MDH2 activity after overexpressing the wild-type and mutated MDH2 constructs in 293T cells. The K328/9 mutations did not significantly alter MDH2 activity, while the K239E showed only a modest trend towards reduction (Figure 6G). However, the K296E and K335E mutations led to an over 30% and 25% reduction in catalytic rate relative to wild-type protein, respectively (Figure 6G). Together, these findings suggest that protein acylation events differentially influence enzyme activity.
To further understand how acylation impaired activity, we modeled several sites on the crystal structure of human MDH2, with a particular emphasis on K296 and K335 (Figure 6F). Next, we performed solvent-based energy minimization of the native structure. Analysis of the intramolecular interactions of K296 indicated that its neighboring amino acid, K297, forms a salt bridge with glutamate 300, suggesting that acylation of K296 could interfere with the formation of this proximal salt bridge and potentially the stability of this alpha helical region (Figure S6B). Analysis of MDH2 K335 showed that it forms a salt bridge and hydrogen bond interactions with D332. Acylation of K335 would abolish these interactions and potentially destabilize this alpha-helix which interacts with a nearby alpha-helix directly involved in malate/oxaloacetate binding (Figure 6F). These in silico analyses suggest that acylation disrupts key local interactions, thereby impairing MDH2 enzymatic activity. Together, our data support a model where a protein is decorated with several acyl modifications, which together, rather than a single site, influence enzyme activity.
To test this idea, and because amino acid substitutions cannot fully capture the effect of protein acylation by acyl-CoAs, we incubated MDH2 with either HMG-CoA or glutaryl-CoA in vitro in order to mimic the biological mechanism by which MDH2 becomes acylated. Treating with each acyl-CoA increased the acylation signal of MDH2 as determined via immunoblotting (Figure 6H). When measuring the activity of acylated MDH2, we found an over 40% decrease in catalytic activity in the HMGylated state (Figures 6H and S6C). To our surprise, incubating MDH2 with glutaryl-CoA led to an immediate reduction in enzymatic activity, before any protein acylation was observed (data not shown); while the mechanistic basis for this is currently unknown, it prevented us from interrogating the role of acylation by glutaryl-CoA on MDH2 activity.
To overcome this challenge, we turned to anhydrides as another mechanism to determine the role of protein acylation on MDH2 activity. Importantly, our proposed protein acylation model involves HMG-CoA and glutaryl-CoA generating highly reactive cyclic anhydride intermediates. Therefore, to further test the role of acylation on MDH2 activity, we incubated recombinant human MDH2 in vitro with hydroxymethylglutaric anhydride or glutaric anhydride. This treatment increased MDH2 acylation as monitored by immunoblot with our HMG-lysine or glutaryl-lysine antiserum (Figure 6I). In this setting, HMGylation reduced MDH2 enzymatic activity by more than 60%, whereas glutarylation reduced MDH2 activity by almost 75% (Fig. 6I). Collectively, these experiments are consistent with the mutagenesis data, suggesting that acylation inhibits MDH2 activity. Overall, these findings suggest that protein acylation by reactive acyl-CoA species is inhibitory towards MDH2 enzyme activity.
DISCUSSION
Acylation of protein lysine residues is emerging as a widespread and conserved biological regulatory mechanism, implicated in the coordination of cellular metabolism during physiological and pathophysiological conditions (Choudhary et al., 2009; Hirschey et al., 2010; Karamanlidis et al., 2013; Rardin et al., 2013; Tan et al., 2014; Wagner et al., 2012; Weinert et al., 2014; Weinert et al., 2015; Zhao et al., 2010). Despite its emergent biological roles, a mechanistic understanding for protein acylation is missing. By first investigating the unusual reactivity of the citric acid cycle intermediate succinyl-CoA, we identified a class of endogenous primary acyl-CoA metabolites which generate highly reactive cyclic anhydride intermediates at physiological pH and temperature. Importantly, these intermediates rapidly react with proteins to form stable acyl-lysine modifications (Figure 7).
Figure 7.
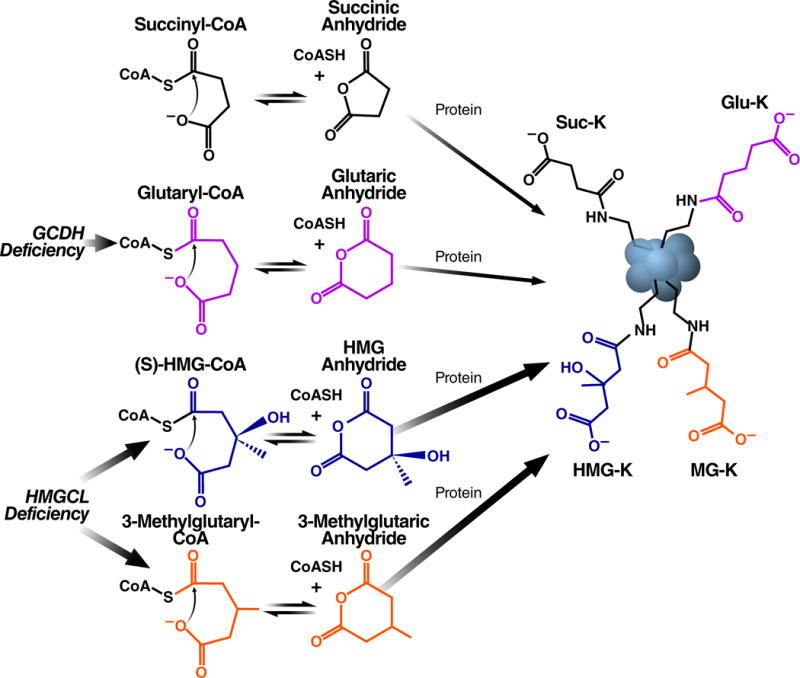
Protein acylation by four- and five-carbon dicarboxylic acyl-CoAs. The terminal carboxylic acids in succinyl-CoA, glutaryl-CoA, HMG-CoA, and 3-methylglutaryl-CoA facilitate non-enzymatic lysine acylation through intramolecular general base catalysis-mediated formation of a highly reactive cyclic anhydride intermediate. In a mouse model of the human disorder HMG-CoA lyase deficiency, HMG-CoA and 3-methylglutaryl-CoA accumulate and, consequently, protein lysine HMGylation and 3-MGylation are elevated. In a mouse model of the human disorder glutaric academia (GA I), glutaryl-CoA accumulates and, consequently, protein lysine glutarylation is elevated.
Previous work suggested that the elevated pH and acyl-CoA concentrations in the mitochondrial matrix might restrict non-enzymatic protein acylation to this cellular compartment (Simic et al., 2015; Wagner and Payne, 2013); however, this conclusion did not consider differential reactivity among chemically diverse acyl-CoAs. In the present study, we identified a subset of acyl-CoAs; namely, four- and five-carbon dicarboxyl-acyl-CoAs, that form highly reactive anhydride intermediates and readily acylate proteins at neutral and acidic pH. These findings suggest that non-enzymatic protein acylation in eukaryotic biology is not limited to mitochondria and likely occurs in other organelles. In support of this notion, protein lysine succinylation and glutarylation are found on histones and glycolytic enzymes even though no enzyme is known to catalyze these modifications (Park et al., 2013; Tan et al., 2014; Xie et al., 2012). Although we cannot exclude the possibility that these acylations are mediated by an acetyltransferase with promiscuous acyl-CoA substrate usage, our findings indicating that a subset of endogenous acyl-CoAs readily form highly reactive anhydrides at physiological pH and temperature strongly suggest that these acylations are predominantly derived from non-enzymatic mechanisms in vivo.
Accounting for metabolite reactivity could challenge the notion that non-enzymatic protein acylation is a kinetically slow consequence of metabolism (Wagner and Payne, 2013). For example, the rapid formation of succinic anhydride from succinyl-CoA could suggest that increases in protein lysine succinylation could occur over relatively short time periods (Figure 2 and S1), such as during the acute stimulation of the succinyl-CoA-generating enzyme alpha-ketoglutarate dehydrogenase (Gibson et al., 2005). Accordingly, it will be important to consider the added dimension of metabolite reactivity in order to understand the significance of protein lysine acylation in biological systems. Overall, these concepts broaden our understanding of protein acylation in biology and indicate that non-enzymatic reactions between primary metabolites and proteins may be more prevalent than was previously appreciated.
Building upon the mechanistic basis for non-enzymatic acylation, we used this understanding to predict and validate a PTM called lysine hydroxymethylglutarylation (HMGylation), which is naturally occurring in mice under basal conditions and significantly elevated in a mouse model of the leucine catabolic disorder HMG-CoA lyase deficiency. Leveraging cross reactivity of our custom antibody, we also provide early evidence for two additional lysine PTMs: 3-methylglutarylation (MGylation) and 3-methylglutaconylation (MGcylation). We found each of these modifications is naturally occurring under basal conditions. Quantitative proteomic analyses in HMGCL-deficient livers identified hundreds of HMGylation sites on proteins in major pathways of intermediary metabolism, which exhibit a striking induction relative to wild-type samples. Importantly, the acyl-proteomes presented here represent the first characterization of these protein modifications in any biological system with custom-made antibodies. Future improvements in the sensitivity and specificity of these antibodies could uncover additional modifications in normal physiology and disease, which will further assist with the comprehensive mapping and functional characterization of these acylations in different tissues and organisms. Understanding the stoichiometry of this class of acyl modifications on their target proteins will also be important to fully realize their unique and overlapping functions normal and disease physiology (Weinert et al., 2015).
To gain deeper insight into the physiological roles of this class of modifications, we compared by quantitative proteomics the “acylomes” of HMGCLKO and GCDHKO mice. Because these models both have altered HMG-CoA and glutaryl-CoA metabolism, respectively, both have elevations in reactive acyl-CoA species, and importantly, each are generated in different pathways, we compared their acylation signatures. Considering the PTMs we detected, most protein sites are uniquely modified by each reactive metabolite (Figure 5 and Tables S3–S4). Within the commonly modified (HMGylated and glutarylated) proteins (Figure 5K), we find little overlap between the sites that were most heavily acylated in each model (Figure S5C), despite comparable reactivity of acyl-CoAs (Figure 3). These findings demonstrate the nature of the pathway that generates a reactive acyl-CoA species heavily influences the acylation signature. Furthermore, our data suggest that different acyl-CoA species have the potential to differentially influence enzyme activity and the overall metabolic state. Interestingly, we also found proteins and pathways that are targets for acylation by both acyl-CoAs. Specifically, we identified the TCA cycle as one pathway that is HMGylated and glutarylated (Figure 6), and has previously been shown to be heavily acetylated and succinylated (Hornbeck et al., 2015). Together, these finding support the idea that while unique protein targets of acylation exist, some pathways are uniquely poised to more broadly sense and/or be controlled by acylation.
One challenge moving forward will be to identify additional functional consequences of lysine acylation. In a first effort to characterize the functional role of acylation, we found that protein HMGylation and glutarylation each reduce enzymatic activity of MDH2, consistent with an inhibitory role for acetylation on this protein. Acylation by HMGylation, glutarylation, MGylation, or MGcylation would all be predicted to induce substantial changes to a protein’s biochemical properties. Similar to malonylation and succinylation, the addition of these acyl moieties to a lysine residue changes the charge at physiological pH from +1 to −1. This charge switch could dramatically affect local hydrogen bonding and electrostatic interactions within a protein’s structure or with other binding partners. Unlike other negatively charged modifications, HMGylation contains a hydroxyl and a methyl group which could also facilitate hydrogen bonding or hydrophobic interactions, thereby conferring distinct forms of regulation or functional alterations to modified protein substrates.
In consideration of the findings presented above and other recent studies, a major question for the expanding field of protein acylation concerns the broader role of acyl-modifications in metabolic regulation. Many different acyl modifications now exist, each of which may have its own unique form of regulation in different tissues under different physiological circumstances. This emerging complexity presents a daunting challenge for future studies focused on understanding the role of particular acyl-modifications, especially considering that changes in protein acylation often occur coordinately on many proteins. Nonetheless, many different acyl-modifications share significant overlap among the protein lysine residues modified, which suggests that modified proteins may encode biophysical information that promotes modification and perhaps self-regulation. Proteins could be “sensing” the metabolic state of the system through acyl-modifications induced by fluctuating pools of intermediary metabolites and responding accordingly. Therefore, protein acylation could represent another form of metabolic regulation that is akin to allostery. Furthermore, the site-specific overlap of many distinct acyl modifications could suggest that it may be more important to consider the cumulative occupancy of all the modifications at a given lysine residue in order to determine the functional outcome. Furthermore, because protein acylation can occur non-enzymatically, it could represent a metabolic lesion that alters the function of proteins and protein complexes (Wagner and Hirschey, 2014; Weinert et al., 2015). In this context, enzymes might have evolved away from having reactive lysines nearby active sites, thereby preventing protein modification, as has been proposed for enzymes in glycolysis (Moellering and Cravatt, 2013). In other cases, protein damage by lysine acylation could be targeted for removal by sirtuins (Anderson et al., 2017).
Beyond the identification of PTMs, our study has implications for understanding how the expanding protein acylation landscape integrates into a cohesive model of metabolic control. The organic chemical logic-based approach to validating HMG-lysine as a functional PTM presented here suggests that other reactive acyl-CoA species would behave similarly and lead to the formation of not yet discovered PTMs. Based on this concept, and the data presented above, we see several parallels between reactive acyl-CoA species (RAS) and reactive oxygen species (ROS), which might serve as a useful model to test moving forward. Specifically, new technological developments in studying ROS have demonstrated both “signaling” and “damage” roles for this reactive species; while acute signaling by ROS is required for proper physiological responses, chronic oxidative stress damages lipids, DNA, and proteins (Sena and Chandel, 2012; Willems et al., 2015). Similarly, RAS might also have both “signaling” and “damage” roles. Increases in acylation, namely by sirtuin ablation, lead to changes in enzyme activity in several mitochondrial pathways and overall are characterized by reduced ability to respond to acute metabolic challenges (Anderson et al., 2017; Hirschey et al., 2010). Additionally, like oxidative stress, chronic hyperacylation can be considered a type of carbon stress (Wagner and Hirschey, 2014). Protein damage from carbon stress would be expected to accelerate the development of age-associated diseases, including cancer, metabolic syndrome, cardiovascular disease, and neurodegeneration (Lopez-Otin et al., 2013), as is observed in sirtuin knock-out models [for a recent review, see (McDonnell et al., 2015)].
Taken together, the findings presented herein identify the chemical mechanisms underlying a class of protein modifications; establish lysine HMGylation, as well as MGylation and MGcylation, as PTMs; and demonstrate a chemical logic-based strategy for identifying PTMs, thereby further expanding the landscape of acyl-modifications. More broadly, this work provides a conceptual model for the interplay between reactive acyl-CoA species, their subsequent protein modifications, and the removal by sirtuins (Anderson et al., 2017), as a coordinated regulatory paradigm controlling metabolism. Understanding which protein modifications have signaling roles, and which protein modifications might be considered damage, will be an important focus of future studies.
STAR METHODS
CONTACT FOR REAGENT AND RESOURCE SHARING
Further information and requests for resources and reagents should be directed to and will be fulfilled by the Lead Contact, Matthew Hirschey (matthew.hirschey@duke.edu).
EXPERIMENTAL MODELS AND SUBJECTS DETAILS
Hmgcl KO mice (HLLKO mice)
Generation of Liver-specific HL-deficient mice were generated as described previously (Gauthier et al., 2013). Briefly, HLLKO mice were obtained by transferring the targeted HL allele to a C57BL/6J background for eight generations, then introducing the Alb-Cre allele and interbreeding. Mice were housed at 21°C with a 12-h light-dark cycle, with the light phase from 6:00 AM to 6:00 PM. They were fed Teklad Mouse Breeder Diet (W) 8626 (Harlan Laboratories, Inc., Madison, WI) containing 20.6% protein and 1.86% leucine (w/w), and 10.4% fat.
At 3–4 weeks of age, mice were genotyped. Cre− HLL/L littermates served as controls for HLLKO mice. Because of high mortality on a normal diet, HLLKO mice and controls were weaned to a modified isocaloric diet containing 6.1% protein (0.55% leucine) and 5.5% fat (TD 90016, Harlan Laboratories, Inc., Madison, WI). Furthermore, glucose was added to the drinking water (10% w/v). All protocols were approved by the CHU Sainte-Justine Animal Care Committee.
Cre+, +/+ (wild-type) and Cre+, fl/fl (HLLKO) mouse liver samples used for western blotting and proteomics experiments were derived from male mice 14–17 weeks of age. Mouse liver mitochondria used for TMT-based proteomics were derived from 10-week old mice.
Gcdh−/− mice (GCDHKO mice)
The GCDHKO mouse strain used for this research project, B6.129S4-Gcdhtm1Dmk/Mmnc, identification number 034368-UNC, was obtained from the Mutant Mouse Regional Resource Center, a NIH funded strain repository (8U42OD010924-13), and was donated to the MMRRC by David M. Koeller, MD, Oregon Health & Science University. The GCDHKO mice had a mixed C57/BL6J and C57/BL6NJ background and breeders heterozygous for the GCDH gene were generated by backcrossing the GCDH KO mice with the wild-type C57/BL6NJ strain from the Jackson Laboratory. The resulting heterozygous mice were bred to obtain the GCDH WT and KO mice used in the study. Prime pair GCDHWT forward (5′-CTTCCGTAACTACTGCCAGGAGCGG-3′) and GCDH WT reverse (5′-AGCTCTCGGGTCAGGAGCCCATAGG-3′) was used to identify a 565 bp WT-GCDH band and pair GCDHKO forward (5′-TTAGGCCTAGTGTGCTGGTCCCGGA-3′) and GCDHKO reverse (5′-TCTGGTGCCGGAAACCAGGCAAAGC-3′) was used to identify a 390 bp KO-GCDH band. About 2–4 animals per cage were housed together with a 12 light-dark cycle and received ad libitum PicoLab rodent diet 20 (#5053, LabDiet, St. Louis, MO) and water. All animal procedures were performed in accordance with the Association for the Assessment and Accreditation of Laboratory Animal Care (AAALAC) international guidelines and approves by the Duke University Institutional Animal Care & Use Committee. Twelve age-matched 6.1–6.4 week old male mice (6 WT, 6 GCDHKO) weighing between 22–28 grams were used in this study.
METHOD DETAILS
Chromatographic Separations for Mass Spectrometry
All proteomic analyses were performed using a nano-Acquity UPLC system (Waters) coupled to the indicated mass spectrometer via a nanoelectrospray ionization source. Samples were first trapped on a Symmetry C18 20 mm × 180 μm trapping column (5 μL/min at 99.9/0.1 v/v water/acetonitrile), after which the analytical separation was performed using a 1.7 μm Acquity BEH130 C18 75 um × 250 mm column (Waters) using the indicated gradient with 0.1% formic acid at a flow rate of 400 nanoliters/minute (nL/min) with a column temperature of 55°C.
Preparation of Acylated Bovine Serum Albumin and Analyses by Mass Spectrometry
In vitro acylated BSA protein samples in 50 mM HEPES/150 mM NaCl storage solution were delivered frozen to the Duke Proteomics and Metabolomics Shared Resource in 1.5 mL Eppendorf tubes. The samples were thawed on ice and protein concentration was measured by total protein assay (mini Bradford, Bio-Rad, Inc.). 5 μg from each was taken out and normalized to the lowest concentration with 50 mM ammonium bicarbonate, pH 8. A volume of 0.2% RapiGest (Waters #186001861) equivalent to the total of each sample was added to each to have 0.1% RapiGest final. Samples were then reduced in 10 mM dithiothreitol (VWR, VW1506-02), alkylated in 20 mM iodoacetamide (Calbiochem 407710), and digested with 200 ng of sequencing grade modified trypsin (Promega V5111) (standard in-solution digestion protocol at http://www.genome.duke.edu/cores/proteomics/sample-preparation/). After digestion overnight, samples were acidified to 1% trifluoroacetic acid/2% acetonitrile and heated for 2 hrs at 60°C to hydrolyze RapiGest. The samples were then cleaned up using C18 tips to remove any salts prior to LC/MS analysis. Eluents were dried down and peptides were reconstituted in 200 μL of 1% TFA/2% ACN, and then pipetted into total recovery LC vials (Waters).
Each sample was analyzed using the UPLC system described above coupled to a Synapt G2 HDMS mass spectrometer (Waters), by injecting approximately 50 ng of total digested protein and separating the peptides over a gradient of 5 to 40% acetonitrile in 60 minutes. Data for each sample was collected once by data-dependent acquisition (DDA) in sensitivity mode and collecting MS/MS spectra for the top three ions with a charge greater than 1.
Raw LC-MS/MS data were processed in Mascot distiller v2.3.2.0 (Matrix Science, Inc.) and submitted to the Mascot v2.4.1 search engine. Data were searched against the SwissProt database with mammalia taxonomy selected. Variable modifications include deamidation (NQ), oxidation (M), succinylation (K), acetylation (K), butyrylation (K), glutarylation (K), and hydroxymethylglutarylation (K, 144.0422587 Da). Fixed modification of carbamidomethyl (C) was selected. Data were searched with a 10 ppm precursor mass and 0.04 Da product ion tolerance. The maximum number of missed cleavages was set at 4 and enzyme specificity was trypsin. Results from these searches were uploaded to Scaffold (Proteome Software, Inc.) and have been made public at the following link: Duke: https://discovery.genome.duke.edu/express/resources/3627/3627_succinylK_acetylK_repeat_042514.sf3.
Preparation of mouse liver tissue for peptide immunoprecipitation
Flash frozen liver tissue was crushed into a powder using a mortar and pestle chilled with liquid nitrogen and stored at −80 °C until sample preparation. Approximately fifteen mg of tissue powder per sample was transferred to a 2 mL round-bottom sample tube and Urea lysis buffer (8 M urea in 50 mM Tris, (pH 8.0), 40 mM NaCl, 2 mM MgCl2, + 1× Roche ETDA-free protease inhibitor cocktail tablet (Sigma-Aldrich 04693159001, Roche), 10 mM Nicotinamide (Sigma-Aldrich #72340), 10 μM TSA (Cell Signaling Technologies #9950) was added at exactly 200 μL/10mg tissue. Tissue in lysis buffer was lysed with a TissueLyzer for 2 minutes at 30 Hertz twice, followed by three freeze-thaw cycles. After the final thaw, samples were sonicated 3 × 5 seconds each on ice. Samples were centrifuged at 10,000 × g for 10 min at 4 °C and the supernatant was saved. Protein concentration was quantified by BCA assay and each sample frozen at −80 °C. Protein lysates were thawed and adjusted to 2.5 mg/mL with lysis buffer. An initial qualitative experiment (for both genotypes) used 2 mg of protein and a repeat qualitative experiment used 4.35 mg of protein (for both genotypes). Samples were reduced with 5 mM DTT at 37 °C for 30 min, cooled to RT, alkylated with 15 mM iodoacetamide (Sigma-Aldrich #I1149) for 30 min in the dark and unreacted iodoacetamide quenched by the addition of DTT up to 15 mM. The repeat experiment with 4.35 mg of protein included an initial digestion with LysC (Wako Chemicals, 121-05063) at 333:1 (w/w, protein:enzyme). Following dilution to 1.5 M urea with 50 mM Tris (pH 8.0), 5 mM CaCl2, the samples were digested with sequencing grade modified trypsin (Promega V5111) at 50:1 (w/w) overnight at 37°C. The samples were acidified to 0.5% TFA and centrifuged at 4000 × g for 10 min at 4°C to pellet insoluble material. The supernatant containing soluble peptides was desalted on a 50 mg tC18 SEP-PAK SPE column (Waters #WAT054960) and eluted once with 500 μL 25% acetonitrile/0.1% TFA and twice with 500 μL 50% acetonitrile/0.1% TFA. The 1.5 mL eluate was frozen on dry ice, lyophilized, and stored at −80 °C until used for peptide immunoprecipitation.
One hundred μg of concentrated rabbit pan-anti-HMG-modified lysine (K) antibody (custom made, Yenzym Antibodies, LLC) was coupled to 20 μL of Protein A/G agarose (ThermoFisher #20422) in PBS (pH 7.4) in a total volume of 500 μL with gentle rocking overnight at 4°C. The next day, antibody-coupled agarose was pelleted via centrifugation at 2000 × g for 30 seconds. The supernatant was discarded and pellet washed three times in 500 μL PBS. The lyophilized peptides were solubilized in 1 mL of IP buffer (50 mM Tris-Cl (pH 7.4), 50 mM NaCl, 10 mM sodium phosphate) and incubated with the HMG-K antibody coupled agarose in a 1.5 mL tube on a rotator overnight at 4°C. Each sample was assessed initially using 2 mg of input material and a second time with 4.35 mg of input material as described above. For quantitative TMT-labeled samples, 6 mg of combined input material (1 mg per sample × 6 TMT labeled digested samples) was immunoprecipitated in a single tube. The next day, the antibody-peptide complexes were pelleted via centrifugation at 2000 × g for 30 seconds and washed 5 times in 500 μL of IP buffer. The peptides were eluted in 55 μL of 0.1% TFA for 10 minutes followed by a wash in 50 μL of 0.1% TFA and the supernatants (2000 × g, 30 sec) from each elution were combined. The eluate was acidified to 0.5% TFA (and brought to a 1 mL volume), desalted on a 50 mg tC18 SEP-PAK SPE column (Waters #WAT054960) and eluted as described above. The 1.5 mL eluate was frozen on dry ice and lyophilized. The dried peptides were re-suspended in 12 μL 0.1% formic acid, frozen, and submitted to the Duke Proteomics and Metabolomics Shared Resource for analysis by nLC-MS/MS described below.
Non-quantitative Hydroxymethylglutaryl-Proteome Mapping by Mass Spectrometry
Each sample assessed for endogenous HMGylation was analyzed using the UPLC system described above coupled to a Q Exactive Plus (QE+) Hybrid Quadrupole-Orbitrap mass spectrometer (Thermo Fisher Scientific), by injecting 4 μL of the immunoprecipitated sample and separating the peptides over a gradient of 3 to 30% acetonitrile. Each IP was analyzed in duplicate (using 90 minute gradients for the 2 mg IP and 210 minutes for the 4.35 mg IP). MS1 (precursor) analysis was performed at 70,000 resolution, with an AGC target of 1×10⁶ ions and a maximum injection time of 60 ms. Tandem mass spectra (MS/MS) were collected by DDA on the top 10 most abundant precursor ions (with a charge greater than 1) per MS1 scan, with dynamic exclusion enabled for a window of 20 seconds. Precursor ions were filtered with a 2.0 m/z isolation window and fragmented with a normalized collision energy (NCE) of 27. MS2 scans were performed at 17,500 resolution, with an AGC target of 5×10⁴ ions and a maximum injection time of 60 ms.
Raw LC-MS/MS data were processed in Proteome Discoverer v2.1 with Service Pack 1 (PD2.1 SP1, Thermo Fisher Scientific), using both the Sequest HT and MS Amanda search engines. Considering both HMGCL KO and WT samples separately, raw files from the 1st (2 mg input) and 2nd (4.35 mg input) anti-HMG-lysine IPs were searched together, as they were from the same pulverized liver samples. Data were searched against the UniProt mouse complete proteome database of reviewed (Swiss-Prot) and unreviewed (TrEMBL) proteins, which consisted of 51,414 sequences on the date of download (06/23/2016). Variable modifications include oxidation (M) and different acyl modifications—acetylation (K), succinylation (K), butyrylation (K), malonylation (K), glutarylation (K), hydroxymethylglutarylation (K, 144.0422587 Da), 3-methylglutarylation (K, 128.0473441 Da), and 3-methylglutaconylation (K, 126.0316941 Da) —searched one at a time based on the experiment. Fixed modification of carbamidomethyl (C) was selected. Data were searched with a 10 ppm precursor mass and 0.02 Da product ion tolerance. The maximum number of missed cleavages was set at 3 and enzyme specificity was trypsin. Peptide spectral matches (PSMs) were filtered to a 1% false discovery rate (FDR) for each search engine separately using the Percolator node of PD2.1 and site localization probabilities were determined for all modifications using the ptmRS algorithm. PSMs were grouped to unique peptides while maintaining a 1% FDR at the peptide level and using a 95% localization threshold for PTMs. Peptides were grouped to proteins using the rules of strict parsimony.
Quantitative Tandem Mass Tag (TMT)-based proteomics
Mitochondrial protein pellets from livers of 10 week old Hmgcl KO (n=3) and control mice (n=3) were re-suspended in ice-cold 8M Urea Lysis Buffer (as above, but without TSA and using around 35 mg wet weight for each mitochondrial pellet). Samples were disrupted by a combination of pipetting and vortexing, and subsequent sonication with a probe sonicator in three 5 second bursts (power setting of 3), incubating on ice in-between each burst. Samples were centrifuged at 10,000 × g for 10 min at 4°C and the supernatant was retained. Protein concentration was determined by BCA, and equal amount of protein (1500 μg, adjusted to 2.5 mg/mL with Urea Lysis Buffer) from each sample was reduced and alkylated as described above. Following dilution to 1.5 M urea with 50 mM Tris (pH 8.0), 5 mM CaCl2, the samples were digested with trypsin (50:1 w/w, protein:enzyme) overnight at 37°C. The samples were acidified, and subjected to SPE, and lyophilized as described above. Each sample was re-suspended in 300 μL of 200 mM triethylammonium bicarbonate (TEAB), mixed with a unique 6-plex Tandem Mass Tag (TMT) reagent (2.4 mg re-suspended in 150 μL100% acetonitrile), and shaken for 4 hours at room temperature (ThermoFisher Scientific Cat#90061). After samples were quenched with 2.4 μL 50% hydroxylamine and shaken for 15 additional minutes at room temperature, all six samples were combined, frozen, and lyophilized overnight. The mixture was re-suspended in 3 mL 0.5% TFA and subjected to SPE again as described above, but with a 200 mg tC18 SEP-PAK SPE column (Waters, 186004618) (solvents scaled for column volume). The eluate was vortexed and split into one aliquot containing ~ 5% of the total peptide mixture (450 μg) and a second aliquot containing ~ 95% (8.45 mg). Both aliquots were frozen and lyophilized overnight. The 450 μ g aliquot of the “input” material was saved at −80°C for quantification of unmodified peptides. The 8.45 mg aliquot was used for enrichment of post-translational modifications (PTMs) as described below. Similar methods were used for glutaryl-lysine proteomics.
All samples were subjected to nanoLC-MS/MS analysis using the UPLC system and QE+ mass spectrometer described above. Six mg of the input fraction (8.45 mg aliquot) was re-suspended in 1.0 mL of 50 mM Tris-Cl (pH 7.4 @ 4°C), 50 mM NaCl, 10 mM sodium phosphate and pH adjusted to 7.4 with NaOH and subjected to immunoprecipitation (IP) with anti-HMG-lysine antiserum as described earlier in Peptide Immunoprecipitation. The input material described above (5% of the large-scale mixture, ~ 450 μg of TMT-labeled peptides) was re-suspended in 450 μL of 20 mM ammonium formate at pH 10 and 1.5 μL was separated into 5 fractions (300 ng/fraction) using online 5-step high-pH reversed-phase fractionation optimized for TMT 6plex labeled samples and each fraction was analyzed by LC-MS/MS (90 min gradients) as described below. The HMG enriched sample was re-suspended in 12 μL of 0.1% formic acid and analyzed with technical replicate runs, with 4.5 μL of sample injected. The 5 input material fractions were analyzed in singlicate, with 3 μL injections. For each injection, the analytical separation was performed over a 240 minute gradient of 3 to 30%. MS1 (precursor ions) was performed at 70,000 resolution, with an AGC target of 1×10⁶ ions and a maximum injection time of 60 ms. MS2 spectra (product ions) were collected by DDA of the top 20 most abundant precursor ions (with a charge greater than 1) per MS1 scan, with dynamic exclusion enabled for a window of 90 seconds for the HMG sample (30 for glutaryl). Precursor ions were filtered with a 0.7 m/z isolation window for the HMG sample (1.2 for glutaryl) and fragmented with a normalized collision energy of 30. MS2 scans were performed at 17,500 resolution, with an AGC target of 1×10⁵ ions and a maximum injection time of 60 ms. Similar methods were used for glutaryl-proteomics.
PD2.1 SP1 was used for raw data analysis as described above with slight modifications—for TMT-labeled samples, default search parameters included oxidation (15.995 Da on M) as a variable modification and carbamidomethyl (57.021 Da on C) TMT6plex (229.163 Da on peptide N-term and K) as fixed modifications, and 2 missed cleavages (trypsin specificity). To assess labeling efficiency as a quality control measure, the input fraction was re-searched with N-terminal TMT6plex as a variable modification, confirming N-terminal labeling of 95% of all PSMs. HMGyl runs added HMGylation (144.04226 Da on K) and changed TMT to variable modifications on K (remaining fixed on peptide N-term) and increased maximum missed trypsin cleavage sites to 4. Considering each data type (HMGyl, input) separately, PSMs from each search algorithm were filtered to a 1% FDR and PTM site localization probabilities were determined as above. PSMs were grouped to unique peptides while maintaining a 1% FDR at the peptide level and using a 95% localization threshold for PTMs. Peptides from all fractions (HMGyl, input) were grouped to proteins together using the rules of strict parsimony and proteins were filtered to 1% FDR using the Protein FDR Validator node of PD2.1. Reporter ion intensities for all PSMs having co-isolation interference below 0.5 (50% of the ion current in the isolation window) and S/N>1 for all reporter ions were summed together at the peptide and protein level, but keeping quantification for each data type (HMGyl, input) separate. Peptides shared between protein groups were excluded from protein quantitation calculations. Similar methods were used for glutaryl-proteomics.
Preparation of mouse liver tissue for Western blotting
Flash frozen liver tissue was thawed on ice and homogenized in RIPA buffer (50 mM Tris-Cl (pH 7.4), 150mM NaCl, 1 mM EGTA, 1% NP-40, 0.5% sodium deoxycholate, 0.1% SDS) supplemented with a Roche protease inhibitor tablet (Sigma Aldrich 04693159001, ROCHE) using a motor-drive Potter-Elvehjem tissue grinder. Samples were centrifuged at 14,000 × g for 10 min at 4°C and the supernatant saved and frozen at −80°C until later analysis. Protein concentration was determined via the BCA method and the samples were diluted in RIPA buffer. Forty micrograms of protein sample were combined with 5× loading buffer and resolved by SDS-PAGE, transferred to nitrocellulose, blocked for 1.3 hrs in 1% w/v fish gelatin (Sigma-Alrich G7041) in phosphate-buffered saline containing 0.02% w/v sodium azide followed by Western blotting with specific antibodies as described.
In vitro incubation of protein with acyl-CoAs
Acyl-CoAs were purchased from Sigma as sodium or lithium salts (see Key Resources Table). Acyl-CoA solutions were prepared in 50 mM HEPES, 150 mM NaCl, and adjusted to pH 8.0 at 37°C. For acyl-CoA+ BSA, ovalbumin, or GDH experiments, 2 μg/μl solutions of proteins were prepared in 50 mM HEPES, 150 mM NaCl and adjusted to either pH 4.0, 5.0, 6.0, 7.0, or 8.0 at 37°C. Thirty microliters of each protein solution was added to 30 μl of an acyl-CoA solution at appropriate concentration adjusted to the same pH for final conditions of 60 μl, the desired concentration of acyl-CoA, and 1μg/μl protein in 50 mM HEPES, 150mM NaCl. Reactions were incubated for 6 hours at 37°C at 400 rpm in an Eppendorf Thermomixer unless otherwise indicated. Reaction tubes were briefly centrifuged during the incubation to minimize condensation. Following the incubations, loading buffer was added to 5 μl of the reaction and the samples were separated by SDS-PAGE, stained with Coomassie brilliant blue or transferred to nitrocellulose membrane, blocked, and probed with a polyclonal acyl-lysine antibody (see below). Protein concentration was determined using the BCA method. The pH was adjusted with an Oakton 700 series pH meter calibrated to Oakton buffer solution standards.
Key Resource Table.
Your MS Word document “Key Resources.docx” cannot be opened and processed. Please see the common list of problems, and suggested resolutions below.
Common Problems When Creating a PDF from Microsoft Word Documents
When you open your document in MS Word, an alert box may appear with a message. This message may relate to margins or document size. You will need to find the piece of your Word document that is causing the problem. Selectively remove various pieces of the file, saving the modified file with a temporary file name. Then try to open modified file. Repeat this process until the alert box no longer appears when you open the document.
Embedded Macros
Your submission should not contain macros. If they do, an alert box may appear when you open your document (this alert box prevents EM from automatically converting your Word document into the PDF that Editors and Reviewers will use). You must adjust your Word document to remove these macros.
Corrupted Tables
Your document may contain a table that cannot be rendered correctly. This will be indicated by a warning alert box. Correct the content of the table that causes the problem, so that the alert box no longer appears.
Word 2002/Word XP files
At the present time, EM supports Word files in Word 2000 and earlier formats. If you are using a more recent version of MS Word, try saving your Word document in a format compatible with Word 2000, and resubmit to EM.
Other Problems
If you are able to get your Word document to open with no alert boxes appearing, and you have submitted it in Word 2000 (or earlier) format, and you still see an error indication in your PDF file (where your Word document should be appearing). please contact the journal via the ‘Contact Us’ button on the Navigation Bar.’
You will need to reformat your Word document, and then re-submit it.
Measurement of Coenzyme A formation from acyl-CoAs
For short-term (15 min) measurement of CoASH formation, acyl-CoAs were solubilized to 1mM in 100mM HEPES (pH 8.0), 150 mM NaCl and 30 μl were pipetted into 100 μl of 100mM HEPES (pH 8.0), 150 mM NaCl freshly prepared with 1mM 5,5′-dithiobis-(2-nitrobenzoic acid(DTNB; Ellman’s Reagent, Sigma-Aldrich #D8130)). The mixture was incubated at 25 °C for 3 minutes before measuring absorbance at 412 nm at time 0 and then every 3 minutes for 15 minutes. For long-term (6hr) measurement of CoASH formation, the acyl-CoAs were solubilized as described earlier and 1 mM solutions in 150 μl total volumes were incubated at 37°C and 400rpm on an Eppendorf thermomixer. At 0, 1, 3, and 6-hour time-points, 32 μl of each sample was removed and immediately frozen until later analysis. At the time of the assay, the samples were thawed and 30 μl were immediately mixed with freshly prepared 100 mM HEPES (pH 8.0), 150 mM NaCl, and 1 mM DTNB and incubated for 3 minutes at 25°C before measuring absorbance at 412 nm in a 96-well plate. Both short- and long-term experiments were normalized to a cysteine standard curve.
Antibodies and Western blotting
Proteins were transferred onto nitrocellulose membrane and blocked for 1.3 hours in blocking buffer containing 1% w/v fish gelatin (Sigma-Aldrich G7041) in PBS. Blocked membranes were incubated with primary antibodies at 1:1000 dilutions in 1:1 mixture of 1% fish gelatin/PBS and PBS+0.05% Tween 20 (PBS-T) overnight at 4°C with gentle rocking. The next day the membranes were washed 3 × 5 minutes in PBS-T and incubated for 1 hour with polyclonal, fluorophore-conjugated goat-anti-rabbit or goat-anti-mouse secondary antibodies (LI-COR) and signal was visualized in the appropriate channel using a LI-COR Odyssey Imager. Antibodies used were a polyclonal acetyl-lysine and monoclonal glutaryl-lysine antibodies (Cell Signaling, non-commercial), polyclonal succinyl-lysine, butyryl-lysine, and malonyl-lysine antibodies (PTM Biolabs, Inc.), and custom-made polyclonal glutaryl-lysine, succinyl-lysine, hydroxylmethylglutaryl-lysine (custom made from Yenzym Antibodies) and anti-myc (Santa Cruz Biotechnology). Please see Key Resources Table for additional vendors and product numbers.
Generation of pan-anti-hydroxymethylglutaryl-lysine antiserum
Fatty acid free Bovine serum albumin (2 mg/mL) in 0.1 M sodium bicarbonate (pH 8.3) was stirred with the slow addition of 20-fold molar excess powdered 3-hydroxy-3-methylglutaric anhydride (Santa Cruz Biotechnology # sc-206648) while maintaining the pH near 8.0 at room temperature. The BSA/anhydride solution was mixed for 15 minutes after the final addition of anhydride powder. Hydroxylamine (50% solution, Sigma) was added to 1M final concentration and allowed to incubate for 1 hour at room temperature. The solution was brought to pH 7.2 with HCl and buffer exchanged in an Amicon 10K molecular weight cut-off filter (Millipore #UFC901024) via centrifugation at 5000 × g for 10 min, followed by resuspension of the concentrate in 13 mL of PBS (pH 7.4). The buffer exchange was repeated and the concentrate resuspended in 20 mL PBS to a final protein concentration of 1–1.2 mg/mL. This HMG-BSA preparation was used as the antigen for rabbit polyclonal antibody generation performed by Yenzym Antibodies, LLC. The antiserum containing anti-HMG-K antibodies was purified by antigen-specific immunoaffinity purification followed by negative selection against the unmodified antigen (BSA) performed by Yenzym. Antiserum and purified antibody were shipped on ice and stored at −20°C upon arrival and thawed and stored at 4°C as needed for western blotting and proteomics.
Malate dehydrogenase 2 activity assays
Human recombinant mitochondrial malate dehydrogenase was purchased from Sigma-Aldrich (#SRP6104). Briefly, the commercial preparation was incubated at 8 μg/mL in 50 mM phosphate buffer (pH 8.0) with 1 mM coenzyme A or HMG-CoA for 12 hours at 37°C and 400 rpm in an Eppendorf thermomixer. Incubations were centrifuged every 2 hours to minimize condensation and frozen at −20°C afterwards. Prior to the activity assay, the MDH2 incubations were thawed on ice and diluted to 0.2 μg/mL in 50 mM phosphate buffer (pH 8.0). Fifty μL MDH2 was combined with 50 μL of 400 μM NADH (Sigma-Aldrich #N8129) and 400 μM oxaloacetate (Sigma-Aldrich #O4126) for a final volume of 100 μL, 0.1 μg/mL MDH2, 200 μM NADH, and 200 μM oxaloacetate. Activity was measured by the decrease in absorbance at 340 nm over 5 minutes. For experiments using HMG anhydride or glutaric anhydride, MDH2 was incubated at 4 μg/mL in 50 mM phosphate buffer (pH 8.0) with or without 10 mM hydroxymethylglutaric anhydride (Santa Cruz) for 5 min at room temperature and 400 rpm in an Eppendorf thermomixer. Following the treatment, MDH2 was diluted 1:20 in phosphate buffer and activity was measured as described above.
The pcDNA3.1-MDH2-myc-6His mammalian construct was a generous gift from the laboratory of Dr. John Denu (University of Wisconsin-Madison). The pcDNA3.1-MDH2-myc-6His and mutant expression constructs were generated through standard cloning and site-directed mutagenesis protocols and were sequence-verified using the Eton Bioscience Inc. DNA sequencing service. Two thousand nanograms of each construct was transfected into HEK293T cells (ATCC #CRL-3216, female) at 90% confluency in 6-well plates using Lipofectamine 2000 according the manufacturer’s instructions. Cells were grown in DMEM (Sigma Life Science, Cat# D5796) supplemented with 10% fetal bovine serum (Gibco, sterile, Performance Plus, Ref 16000-044). Twenty-four hours later, cells were washed twice in PBS and scraped in 200 μL cold PBS containing 1× Roche protease inhibitor tablet and sonicated 2 × 5 seconds on ice. The protein concentration of each sample was determined via BCA assay. Samples were then diluted to 0.25 μg/μL with cold PBS prior to MDH2 activity assays. To begin the activity assays, 90 μL of a solution containing 50 mM PBS, 400 μM NADH, 200 μM oxaloacetate was added to 5 μL of each protein sample. Activity was monitored by the decrease in absorbance at 340 nm every 10 seconds over 5 minutes with 1 second of shaking before each read. The slope of the linear portion of each curve was used to calculate the activity rate of each sample. MDH2-myc activity rates were normalized to MDH2-myc protein abundance by determining the anti-myc Western blot signal from each sample via a standard curve generated from a serial dilution of MDH2-myc.
Synthesis of glutaryl-glycine standard
A mixture of glycine (3.0 g, 40 mmol), glutaric anhydride (4.6 g, 40 mmol) and acetic acid (40 mL) was heated to 60 °C (oil bath temp) for 5h. The reaction mixture was concentrated to dryness. The resulting thick, clear viscous residue was triturated with EtOAc (2 × 100 mL). The supernatants were removed by decantation and the residue dried under high vacuum giving N-glutaryl-glycine as a white solid (5 g, 66%).
Proton nuclear magnetic resonance of acyl-glycine formation
A 20-mM glycine solution was made in a phosphate buffered saline-deuterium oxide (PBS-D2O) (99.9 atom % D, Sigma #151882) solution and adjusted to pH 7, 6, and 5. A 2 mM solution of acetyl-CoA or succinyl-CoA was solubilized in PBS-D2O and adjusted to pH 7, 6, or 5 on ice. For reactions, 325 μL of 20 mM glycine in PBS-D2O at pH 5, 6, 7 were combined with 325 μL of 2 mM acetyl-CoA or succinyl-CoA in PBS-D2O at the same pH for final solutions of 10 mM glycine and 1 mM acetyl- or succinyl-CoA at pH 5, 6, and 7 in 650 μL total volume. Reactions were incubated for 1 hour at 37°C and 400 rpm on an Eppendorf thermomixer and immediately frozen until NMR analysis. For analysis of butyryl-, glutaryl-, and hydroxymethylglutaryl-glycine, reactions were prepared as above but with 3 mM of the corresponding acyl-CoAs and incubated for 9 hours at 37 °C and 400 rpm. Reactions were thawed immediately before analysis. Six hundred microliters of each reaction were analyzed in Norell Standard Series 5 mm NMR tubes (Sigma). For peak assignments, succinate, glutarate, hydroxymethylglutarate, glycine, acetylglycine, succinyl-glycine, glutaryl-glycine, and acetyl-, succinyl-, butyryl-, glutaryl-, and hydroxymethylglutaryl-CoA standards were analyzed as detailed in Figs S2–S3. NMR Data Collection: The data was collected on an Agilent DD2 500MHz NMR at the Duke Biomolecular NMR Facility. A simple 1D presaturation sequence was used for all experiments. Additional experiment-specific details are available in the supplemental figure legends.
Metabolite profiling
Frozen liver samples were crushed into a powder using a mortar and pestle cooled on liquid nitrogen. Tissue powder was dissolved in 50% acetonitrile, 0.3% formic acid at 50 mg/mL and homogenized for 2 minutes at 30 Hertz twice on a TissueLyzer. The homogenate was then centrifuged for 2 minutes at 10,000 × g and the supernatants saved for acyl-carnitine analysis, as described previously (Koves et al., 2005). Aliquoted supernatants were dried, and then esterified with hot, acidic methanol. Analysis was done using tandem flow injection MS with a Quattro Micro instrument (Waters Corporation, Milford, MA). Quantification of the “targeted” intermediary metabolites was facilitated by addition of mixtures of known quantities of stable-isotope internal standards. Given the use of internal standards permitting absolute quantification of the metabolites in micromolar concentrations. Although statistically significant effects were found, it should be noted that measurements for C5:1, C5, C6, C5-OH/C3-DC, C8:1, and C8:1-OH/C6:1-DC are near the lower limit of detectability (0.01–0.02 μM). Separating isobaric acyl-carnitine from their isomers was achieved by derivatization of acyl-carnitines to butyl esters followed by LC-MS, using n-butanol in place of methanol, as described previously (Kraus et al., 2015). Urinary organic acids were extracted and measured in collaboration with a clinical genetics lab, as described previously (Gauthier et al., 2013). Briefly, urine was collected from mice in metabolic cages (Lab Products Inc., DE, USA). After dilution of urine with water to a standard creatinine concentration (0.133 mmol/L) and addition of 100 μL of 2-ketocaproic acid (5 mM), an internal standard, 3-mL aliquots were incubated with hydroxylamine-HCL (50 μL) at 60° C for 30 min. After addition of 100 μL of pentadecanoic acid (5 mM), an internal standard and adjustment to pH 2 with 6 M HCl, saturating amounts of NaCl were added (2g). Analytes were extracted three times by vigorous mixing with 3 mL of ethyl acetate for 5 min, centrifugation (800 × g, 1 min), combining the organic layers from each extraction in a clean tube. Anhydrous Na2SO4, 0.25 g was added. The mixture was vigorously vortexed for 5 min, centrifuged (800 g, 1 min) and the organic layer was transferred to a new tube. 100 μL of tetracosane (2.5 mM), an internal standard, were added. After evaporation to dryness under a gentle nitrogen stream at 60 °C,100 μL of N,OBis(trimethylsilyl) trifluoroacetamide were added. The sample was vortexed then incubated at 80 °C for 30 min. A 1 μL aliquot was used for GC-MS analysis in the CHU Sainte-Justine clinical biochemical genetics laboratory. The sample was resolved by gas chromatography (7890B, Agilent Technologies) on a HP-5MS 19091S-433 column (Agilent Technologies). Mass spectra were obtained using quadrupole filter spectrometry in the electron impact ionization mode (5975 B Inert XL MSD, Agilent Technologies) and were analyzed using MSD ChemStation E.02.02.1431 Software.
Hydroxymethylglutaryl-lysine site analysis with motif-x
The HMGylated peptide dataset (see supplemental Tables) with ambiguous peptide site localizations (those with probability<95%) excluded and with all HMG modified lysines converted to lowercase (“k”) was uploaded into the motif-X online tool (http://motif-x.med.harvard.edu/motif-x.html) as the foreground. The foreground format was selected as MS/MS and extended from the IPI mouse proteome. The central character was selected as “k” with a width of 13, occurrences reduced to 10 from the default of 20, and significance level set to 0.0001. Mouse MitoCarta (Calvo et al., 2016) was uploaded as the background and the background central character selected as lysine (“K”).
Comparing common sites of acylation
From the 681 HMG- and 249 Glu-peptides identified, quantitative information was available for 544 HMG- and 229 Glu-peptides based on our quantitative filtering criteria selected in PD2.1. Of these 446 HMG-peptides passed the threshold for a P-value ≤ 0.05 and log2 fold change greater than 1 and 220 Glu-peptides passed the threshold for a log2 fold change value greater than 1 (Glu-peptide samples were pooled from multiple animals and statistics could not be used as a cut-off). Manual curation was performed on the individual lists of peptides to obtain 426 lysine-residues that were HMGylated and 215 that were glutarylated. Comparing these HMG- and glu-lysine sites resulted in an overlap of 96 sites that were both HMGylated and glutarylated. To compare the degree of modification within these common acylation sites, each site was ranked for both the degree of HMG- and Glu-modifications based on their respective log2 (fold change) value in the descending order (highest fold change ranked 1). Finally, rank correlation of the Top 25 HMG-sites to Glu-sites and vice versa was graphed as shown.
Molecular modeling simulations
All modeling simulations were conducted using Biovia Discovery Studio 4.5 (Biovia, Inc., San Diego, CA). Crystal structure coordinates for MDH2 were downloaded from the Protein Data Bank (www.pdb.org; PDB ID: 2DFD). The HMGylated structure was generated by modifying selected lysine residues to S-HMG-Lys in each monomer of the homodimer crystal structure within Discovery Studio. Native and modified protein structures were typed with the CHARMM forcefield (Brooks et al., 2009) and energy minimized with the smart minimizer protocol using the Generalized-Born with simple switching implicit solvent model (Feig et al., 2004) to an RMS convergence of 0.001 kcal/mol.
Images
Models and Figures were generated using GraphPad Prism 6, Chembiodraw Ultra 14.0, Adobe Illustrator, Adobe Photoshop, Lightwave 3D 2015.3, and Microsoft PowerPoint.
QUANTIFICATION AND STATISTICAL ANALYSIS
General Statistical Analysis
Unless otherwise indicated, figure data represent the mean ± standard deviation and significance was evaluated with a two-tailed Mann-Whitney U test. A result was considered significant if P ≤ 0.05. Statistics were performed using GraphPad Prism software.
Statistical analysis for tandem mass tag proteomic experiment
Protein and peptide groups tabs in the PD2.1 results were exported as .txt. files, opened in Microsoft EXCEL, and analyzed as described previously (Grimsrud et al., 2012). First, peptide group reporter intensities from the input material were summed together for each TMT channel, each channel’s sum was divided by the average of all channels’ sum, resulting in channel-specific loading control normalization factors to correct for any deviation from equal protein/peptide input into the six-sample comparison. Reporter intensities for peptide groups from the HMG fractions and for proteins from the input fraction were divided by the loading control normalization factors for each respective TMT channel. Analyzing the HMG peptides and protein datasets separately, all loading control-normalized TMT reporter intensities were converted to log2 space, and the average value from the six conditions was subtracted from each sample-specific measurement to normalize the relative measurements to the mean. For the WT and HMGCL KO comparison (n=3), condition average, standard deviation, p-value (two-tailed student’s t-test, assuming equal variance) and adjusted P-value (Padjusted, Benjamini-Hochberg FDR correction) were calculated. For protein-level quantification, only Master Proteins, or the most statistically significant protein representing a group of parsimonious proteins, identified at 1% protein-level FDR were used for quantitative comparison. PTM level measurements (HMG) were calculated both alone (Relative Abundance) and with (Relative Occupancy) normalization to any change in the corresponding Master Protein, calculated by subtracting Log2 Master Protein values from PTM-containing peptide quantitation values on a sample-specific basis. See Table S3 for quantitative HMG-proteomics data (n=3). See Table S4 for quantitative glutaryl-proteomics data, resulting from similar analysis of pooled samples (n=1).
Final HMGylated protein and site numbers were determined by filtering for Master Protein accessions in Table S3 on the “Protein Group Metadata” tab by selecting “IsMasterProtein” from the drop-down list in column D. The number of entries defined by “IsMasterProtein” containing at least one site of HMGylation represented the reported number of proteins, while the sum of the HMGylation sites on each protein reported in column I represented the reported number of HMGylation sites. Proteins other than MasterProteins highlight other possible proteins (usually isoforms encoded by the same gene) to which the identified HMGylated peptides map in silico based on the rules of parsimony. Similar analysis was performed using Table S4 for counting the number of glutarylated sites and proteins.
DATA AND SOFTWARE AVAILABILITY
Proteomic datasets are available as supplemental tables (Table S2–S4). Raw LC-MS/MS data have been deposited to the ProteomeXchange Consortium via the PRIDE partner repository with the dataset identifier PXD005895.
Proteome Discoverer 2.1
A Proteome Discoverer 2.1 license was purchased from ThermoFisher Scientific.
Supplementary Material
Table S1, related to Figure 4. Selected urinary organic acids from WT and HMGCL KO mice.
Table S2, related to Figure 4. Non-quantitative proteomic survey of HMGylation, MGylation, and MGcylation in livers from HMGCL KO and WT mice. Supplemental Excel file containing protein-level and peptide-level proteomic data on three acyl-lysine modifications compared from HMGCL KO and WT mouse liver samples after pan-HMG-lysine antibody peptide immunoprecipitation. Blue sheets 1–4 are HMGylated protein and peptide data in WT and HMGCLKO liver. Green sheets 5–8 are MGylated (methylglutarylated) protein and peptide data in WT and HMGCLKO liver. Yellow sheets 9–12 are MGcylated (methylglutaconylated) protein and peptide data in WT and HMGCLKO liver.
- Tab 1) Key. Includes a detailed summary of the information fields included in the columns of the subsequent three tabs. The “comments” column describes (in grey shading) cases where certain rows or columns are hidden initially, but users can right click and select “unhide” to view the information.
- Tab 2) HMGylated peptide quant. Annotation of all HMGylated peptides identified at 1% FDR, and relative quantitation statistics.
- Tab 3) Protein quant. Annotation of all “Master” proteins identified at 1% FDR and relative quantitation statistics.
- Tab 4) Protein group metadata. Additional protein-level annotation for all possible proteins to which the identified peptides map (not just Master proteins identified at 1% FDR), including summary of all sites of modification identified in this study.
- Tab 1) Key. Includes a detailed summary of the information fields included in the columns of the subsequent three tabs. The “comments” column describes (in grey shading) cases where certain rows or columns are hidden initially, but users can right click and select “unhide” to view the information.
- Tab 2) Glutarylated peptide quant. Annotation of all glutarylated peptides identified at 1% FDR, and relative quantitation.
- Tab 3) Protein quant. Annotation of all “Master” proteins identified at 1% FDR and relative quantitation.
- Tab 4) Protein group metadata. Additional protein-level annotation for all possible proteins to which the identified peptides map (not just Master proteins identified at 1% FDR), including summary of all sites of modification identified in this study.
- Note: Data from the remaining four channels of the TMT six-plex are not shown since they included other dietary/fasted conditions of GCDH WT and KO mice not discussed in this manuscript.
Acknowledgments
We thank members of the Hirschey laboratory for discussion and comments. We thank Chris Newgard, PhD and Deb Muoio, PhD for thoughtful review of the manuscript; John Carroll for assistance with Figures; the Duke University School of Medicine for the use of the Proteomics and Metabolomics Shared Resource, which provided multiple services; David Gooden, PhD for synthesizing acyl-glycine standards; James Draper for quality control assessment of proteomics data analysis; Pierre Allard of the clinical Biochemical Genetics Laboratory of CHU Sainte-Justine, for supervising the urinary organic acid analysis; Cell Signaling Technology (Danvers, MA) for providing succinyl-, glutaryl-, and malonyl- lysine antibodies, valuable discussions and technical support. We also acknowledge funding support from the American Heart Association grant 12IRG9010008, The Edward Mallinckrodt, Jr. Foundation, The Ellison Medical Foundation, the National Institutes of Health and the NIAAA grant R01AA022146, the National Institutes of Health and the NIA grant R01AG045351, and The Duke Pepper Older Americans Independence Center (OAIC) Program in Aging Research supported by the National Institute of Aging (P30AG028716-01). Research reported in this publication was supported by the National Institute of Diabetes and Digestive and Kidney Diseases of the National Institutes of Health under award number 2T32DK007012. Computational simulations were conducted at the University of Colorado Computational Chemistry and Biology Core Facility, which is funded in part by NIH/NCATS Colorado CTSI Grant UL1TR001082. HMGCL KO mice were bred and maintained with support from the Canadian Institutes for Health Research grant 178978 to G.M. The GCDHKO mouse strain used for this research project, B6.129S4-Gcdhtm1Dmk/Mmnc, identification number 034368-UNC, was obtained from the Mutant Mouse Regional Resource Center, a NIH funded strain repository (8U42OD010924-13), and was donated to the MMRRC by David M. Koeller, MD, Oregon Health & Science University. The content is solely the responsibility of the authors and does not necessarily represent the official views of the National Institutes of Health or other funding sources.
Footnotes
Publisher's Disclaimer: This is a PDF file of an unedited manuscript that has been accepted for publication. As a service to our customers we are providing this early version of the manuscript. The manuscript will undergo copyediting, typesetting, and review of the resulting proof before it is published in its final citable form. Please note that during the production process errors may be discovered which could affect the content, and all legal disclaimers that apply to the journal pertain.
AUTHOR CONTRIBUTIONS
Conceptualization, G.R.W. and M.D.H.; Investigation, G.R.W., D.P.B., T.M.O., J.W.T., L.G.D., D.S.B., H.Y., O.R.I., R.D.S., P.A.G.; Writing - Original Draft, G.R.W., M.D.H.; Writing - Review & Editing, All authors; Supervision, G.A.M., M.D.H.; Project Administration, M.D.H.; Funding Acquisition, M.D.H.
COMPETING FINANCIAL INTERESTS
The authors declare no competing financial interests.
References
- Anderson KA, Green MF, Huynh FK, Wagner GR, Hirschey MD. SnapShot: Mammalian Sirtuins. Cell. 2014;159:956–956 e951. doi: 10.1016/j.cell.2014.10.045. [DOI] [PMC free article] [PubMed] [Google Scholar]
- Anderson KA, Huynh FK, Fisher-Wellman K, Stuart JD, Peterson BS, Douros JD, Wagner GR, Thompson JW, Madsen AS, Green MF, et al. SIRT4 Is a Lysine Deacylase that Controls Leucine Metabolism and Insulin Secretion. 2017 doi: 10.1016/j.cmet.2017.03.003. Submitted. [DOI] [PMC free article] [PubMed] [Google Scholar]
- Bender ML. Mechanisms of Catalysis of Nucleophilic Reactions of Carboxylic Acid Derivatives. Chem Rev. 1960;60:53–113. [Google Scholar]
- Brooks BR, Brooks CL, 3rd, Mackerell AD, Jr, Nilsson L, Petrella RJ, Roux B, Won Y, Archontis G, Bartels C, Boresch S, et al. CHARMM: the biomolecular simulation program. J Comput Chem. 2009;30:1545–1614. doi: 10.1002/jcc.21287. [DOI] [PMC free article] [PubMed] [Google Scholar]
- Buckel W. Acetic anhydride: an intermediate analogue in the acyl-exchange reaction of citramalate lyase. Eur J Biochem. 1976;64:263–267. doi: 10.1111/j.1432-1033.1976.tb10296.x. [DOI] [PubMed] [Google Scholar]
- Calvo SE, Clauser KR, Mootha VK. MitoCarta2.0: an updated inventory of mammalian mitochondrial proteins. Nucleic Acids Res. 2016;44:D1251–1257. doi: 10.1093/nar/gkv1003. [DOI] [PMC free article] [PubMed] [Google Scholar]
- Choudhary C, Kumar C, Gnad F, Nielsen ML, Rehman M, Walther TC, Olsen JV, Mann M. Lysine acetylation targets protein complexes and co-regulates major cellular functions. Science. 2009;325:834–840. doi: 10.1126/science.1175371. [DOI] [PubMed] [Google Scholar]
- Du J, Zhou Y, Su X, Yu JJ, Khan S, Jiang H, Kim J, Woo J, Kim JH, Choi BH, et al. Sirt5 is a NAD-dependent protein lysine demalonylase and desuccinylase. Science. 2011;334:806–809. doi: 10.1126/science.1207861. [DOI] [PMC free article] [PubMed] [Google Scholar]
- Feig M, Onufriev A, Lee MS, Im W, Case DA, Brooks CL., 3rd Performance comparison of generalized born and Poisson methods in the calculation of electrostatic solvation energies for protein structures. J Comput Chem. 2004;25:265–284. doi: 10.1002/jcc.10378. [DOI] [PubMed] [Google Scholar]
- Feldman JL, Baeza J, Denu JM. Activation of the protein deacetylase SIRT6 by long-chain fatty acids and widespread deacylation by mammalian sirtuins. J Biol Chem. 2013;288:31350–31356. doi: 10.1074/jbc.C113.511261. [DOI] [PMC free article] [PubMed] [Google Scholar]
- Gauthier N, Wu JW, Wang SP, Allard P, Mamer OA, Sweetman L, Moser AB, Kratz L, Alvarez F, Robitaille Y, et al. A liver-specific defect of Acyl-CoA degradation produces hyperammonemia, hypoglycemia and a distinct hepatic Acyl-CoA pattern. PLoS One. 2013;8:e60581. doi: 10.1371/journal.pone.0060581. [DOI] [PMC free article] [PubMed] [Google Scholar]
- Gibson GE, Blass JP, Beal MF, Bunik V. The alpha-ketoglutarate-dehydrogenase complex: a mediator between mitochondria and oxidative stress in neurodegeneration. Mol Neurobiol. 2005;31:43–63. doi: 10.1385/MN:31:1-3:043. [DOI] [PubMed] [Google Scholar]
- Grimsrud PA, Carson JJ, Hebert AS, Hubler SL, Niemi NM, Bailey DJ, Jochem A, Stapleton DS, Keller MP, Westphall MS, et al. A quantitative map of the liver mitochondrial phosphoproteome reveals posttranslational control of ketogenesis. Cell Metabolism. 2012;16:672–683. doi: 10.1016/j.cmet.2012.10.004. [DOI] [PMC free article] [PubMed] [Google Scholar]
- Hebert AS, Dittenhafer-Reed KE, Yu W, Bailey DJ, Selen ES, Boersma MD, Carson JJ, Tonelli M, Balloon AJ, Higbee AJ, et al. Calorie Restriction and SIRT3 Trigger Global Reprogramming of the Mitochondrial Protein Acetylome. Mol Cell. 2013;49:186–199. doi: 10.1016/j.molcel.2012.10.024. [DOI] [PMC free article] [PubMed] [Google Scholar]
- Hirschey MD, Shimazu T, Goetzman E, Jing E, Schwer B, Lombard DB, Grueter CA, Harris C, Biddinger S, Ilkayeva OR, et al. SIRT3 regulates mitochondrial fatty-acid oxidation by reversible enzyme deacetylation. Nature. 2010;464:121–125. doi: 10.1038/nature08778. [DOI] [PMC free article] [PubMed] [Google Scholar]
- Hornbeck PV, Zhang B, Murray B, Kornhauser JM, Latham V, Skrzypek E. PhosphoSitePlus, 2014: mutations, PTMs and recalibrations. Nucleic Acids Res. 2015;43:D512–520. doi: 10.1093/nar/gku1267. [DOI] [PMC free article] [PubMed] [Google Scholar]
- Jiang H, Khan S, Wang Y, Charron G, He B, Sebastian C, Du J, Kim R, Ge E, Mostoslavsky R, et al. SIRT6 regulates TNF-alpha secretion through hydrolysis of long-chain fatty acyl lysine. Nature. 2013;496:110–113. doi: 10.1038/nature12038. [DOI] [PMC free article] [PubMed] [Google Scholar]
- Karamanlidis G, Lee CF, Garcia-Menendez L, Kolwicz SC, Jr, Suthammarak W, Gong G, Sedensky MM, Morgan PG, Wang W, Tian R. Mitochondrial complex I deficiency increases protein acetylation and accelerates heart failure. Cell Metab. 2013;18:239–250. doi: 10.1016/j.cmet.2013.07.002. [DOI] [PMC free article] [PubMed] [Google Scholar]
- Koves TR, Li P, An J, Akimoto T, Slentz D, Ilkayeva O, Dohm GL, Yan Z, Newgard CB, Muoio DM. Peroxisome proliferator-activated receptor-gamma co-activator 1alpha-mediated metabolic remodeling of skeletal myocytes mimics exercise training and reverses lipid-induced mitochondrial inefficiency. J Biol Chem. 2005;280:33588–33598. doi: 10.1074/jbc.M507621200. [DOI] [PubMed] [Google Scholar]
- Kraus WE, Muoio DM, Stevens R, Craig D, Bain JR, Grass E, Haynes C, Kwee L, Qin X, Slentz DH, et al. Metabolomic Quantitative Trait Loci (mQTL) Mapping Implicates the Ubiquitin Proteasome System in Cardiovascular Disease Pathogenesis. PLoS Genet. 2015;11:e1005553. doi: 10.1371/journal.pgen.1005553. [DOI] [PMC free article] [PubMed] [Google Scholar]
- Laurieri N, Dairou J, Egleton JE, Stanley LA, Russell AJ, Dupret JM, Sim E, Rodrigues-Lima F. From arylamine N-acetyltransferase to folate-dependent acetyl CoA hydrolase: impact of folic acid on the activity of (HUMAN)NAT1 and its homologue (MOUSE)NAT2. PLoS ONE. 2014;9:e96370. doi: 10.1371/journal.pone.0096370. [DOI] [PMC free article] [PubMed] [Google Scholar]
- Lopez-Otin C, Blasco MA, Partridge L, Serrano M, Kroemer G. The hallmarks of aging. Cell. 2013;153:1194–1217. doi: 10.1016/j.cell.2013.05.039. [DOI] [PMC free article] [PubMed] [Google Scholar]
- Madsen AS, Andersen C, Daoud M, Anderson KA, Laursen JS, Chakladar S, Huynh FK, Colaco AR, Backos DS, Fristrup P, et al. Investigating the Sensitivity of NAD+-dependent Sirtuin Deacylation Activities to NADH. J Biol Chem. 2016;291:7128–7141. doi: 10.1074/jbc.M115.668699. [DOI] [PMC free article] [PubMed] [Google Scholar]
- McDonnell E, Peterson BS, Bomze HM, Hirschey MD. SIRT3 regulates progression and development of diseases of aging. Trends Endocrinol Metab. 2015;26:486–492. doi: 10.1016/j.tem.2015.06.001. [DOI] [PMC free article] [PubMed] [Google Scholar]
- Mitchell GA, Wang SP, Ashmarina L, Robert MF, Bouchard G, Laurin N, Kassovska-Bratinova S, Boukaftane Y. Inborn errors of ketogenesis. Biochem Soc Trans. 1998;26:136–140. doi: 10.1042/bst0260136. [DOI] [PubMed] [Google Scholar]
- Moellering RE, Cravatt BF. Functional Lysine Modification by an Intrinsically Reactive Primary Glycolytic Metabolite. Science. 2013;341:549–553. doi: 10.1126/science.1238327. [DOI] [PMC free article] [PubMed] [Google Scholar]
- Nakagawa T, Lomb DJ, Haigis MC, Guarente L. SIRT5 Deacetylates carbamoyl phosphate synthetase 1 and regulates the urea cycle. Cell. 2009;137:560–570. doi: 10.1016/j.cell.2009.02.026. [DOI] [PMC free article] [PubMed] [Google Scholar]
- Paik WK, Pearson D, Lee HW, Kim S. Nonenzymatic acetylation of histones with acetyl-CoA. Biochimica et Biophysica Acta. 1970;213:513–522. doi: 10.1016/0005-2787(70)90058-4. [DOI] [PubMed] [Google Scholar]
- Park J, Chen Y, Tishkoff DX, Peng C, Tan M, Dai L, Xie Z, Zhang Y, Zwaans BM, Skinner ME, et al. SIRT5-mediated lysine desuccinylation impacts diverse metabolic pathways. Mol Cell. 2013;50:919–930. doi: 10.1016/j.molcel.2013.06.001. [DOI] [PMC free article] [PubMed] [Google Scholar]
- Peng C, Lu Z, Xie Z, Cheng Z, Chen Y, Tan M, Luo H, Zhang Y, He W, Yang K, et al. The first identification of lysine malonylation substrates and its regulatory enzyme. Mol Cell Proteomics. 2011;10:M111 012658. doi: 10.1074/mcp.M111.012658. [DOI] [PMC free article] [PubMed] [Google Scholar]
- Rardin MJ, He W, Nishida Y, Newman JC, Carrico C, Danielson SR, Guo A, Gut P, Sahu AK, Li B, et al. SIRT5 regulates the mitochondrial lysine succinylome and metabolic networks. Cell Metab. 2013;18:920–933. doi: 10.1016/j.cmet.2013.11.013. [DOI] [PMC free article] [PubMed] [Google Scholar]
- Roe CR, Millington DS, Maltby DA. Identification of 3-methylglutarylcarnitine. A new diagnostic metabolite of 3-hydroxy-3-methylglutaryl-coenzyme A lyase deficiency. J Clin Invest. 1986;77:1391–1394. doi: 10.1172/JCI112446. [DOI] [PMC free article] [PubMed] [Google Scholar]
- Sena LA, Chandel NS. Physiological roles of mitochondrial reactive oxygen species. Mol Cell. 2012;48:158–167. doi: 10.1016/j.molcel.2012.09.025. [DOI] [PMC free article] [PubMed] [Google Scholar]
- Simic Z, Weiwad M, Schierhorn A, Steegborn C, Schutkowski M. The varepsilon-Amino Group of Protein Lysine Residues Is Highly Susceptible to Nonenzymatic Acylation by Several Physiological Acyl-CoA Thioesters. Chembiochem. 2015;16:2337–2347. doi: 10.1002/cbic.201500364. [DOI] [PubMed] [Google Scholar]
- Simon EJ, Shemin D. The Preparation of S-Succinyl Coenzyme-A. J Am Chem Soc. 1953;75:2520–2520. [Google Scholar]
- Tan M, Peng C, Anderson KA, Chhoy P, Xie Z, Dai L, Park J, Chen Y, Huang H, Zhang Y, et al. Lysine glutarylation is a protein posttranslational modification regulated by SIRT5. Cell Metab. 2014;19:605–617. doi: 10.1016/j.cmet.2014.03.014. [DOI] [PMC free article] [PubMed] [Google Scholar]
- Tanner KG, Trievel RC, Kuo MH, Howard RM, Berger SL, Allis CD, Marmorstein R, Denu JM. Catalytic mechanism and function of invariant glutamic acid 173 from the histone acetyltransferase GCN5 transcriptional coactivator. Journal of Biological Chemistry. 1999;274:18157–18160. doi: 10.1074/jbc.274.26.18157. [DOI] [PubMed] [Google Scholar]
- Wagner GR, Hirschey MD. Nonenzymatic Protein Acylation as a Carbon Stress Regulated by Sirtuin Deacylases. Mol Cell. 2014;54:5–16. doi: 10.1016/j.molcel.2014.03.027. [DOI] [PMC free article] [PubMed] [Google Scholar]
- Wagner GR, Payne RM. Widespread and enzyme-independent Nepsilon-acetylation and Nepsilon-succinylation of proteins in the chemical conditions of the mitochondrial matrix. J Biol Chem. 2013;288:29036–29045. doi: 10.1074/jbc.M113.486753. [DOI] [PMC free article] [PubMed] [Google Scholar]
- Wagner GR, Pride PM, Babbey CM, Payne RM. Friedreich’s ataxia reveals a mechanism for coordinate regulation of oxidative metabolism via feedback inhibition of the SIRT3 deacetylase. Hum Mol Genet. 2012;21:2688–2697. doi: 10.1093/hmg/dds095. [DOI] [PMC free article] [PubMed] [Google Scholar]
- Weinert BT, Iesmantavicius V, Moustafa T, Scholz C, Wagner SA, Magnes C, Zechner R, Choudhary C. Acetylation dynamics and stoichiometry in Saccharomyces cerevisiae. Molecular systems biology. 2014;10:716. doi: 10.1002/msb.134766. [DOI] [PMC free article] [PubMed] [Google Scholar]
- Weinert BT, Iesmantavicius V, Wagner SA, Scholz C, Gummesson B, Beli P, Nystrom T, Choudhary C. Acetyl-phosphate is a critical determinant of lysine acetylation in E. coli. Mol Cell. 2013;51:265–272. doi: 10.1016/j.molcel.2013.06.003. [DOI] [PubMed] [Google Scholar]
- Weinert BT, Moustafa T, Iesmantavicius V, Zechner R, Choudhary C. Analysis of acetylation stoichiometry suggests that SIRT3 repairs nonenzymatic acetylation lesions. EMBO J. 2015;34:2620–2632. doi: 10.15252/embj.201591271. [DOI] [PMC free article] [PubMed] [Google Scholar]
- Willems PH, Rossignol R, Dieteren CE, Murphy MP, Koopman WJ. Redox Homeostasis and Mitochondrial Dynamics. Cell Metab. 2015;22:207–218. doi: 10.1016/j.cmet.2015.06.006. [DOI] [PubMed] [Google Scholar]
- Xie Z, Dai J, Dai L, Tan M, Cheng Z, Wu Y, Boeke JD, Zhao Y. Lysine succinylation and lysine malonylation in histones. Mol Cell Proteomics. 2012;11:100–107. doi: 10.1074/mcp.M111.015875. [DOI] [PMC free article] [PubMed] [Google Scholar]
- Yu W, Dittenhafer-Reed KE, Denu JM. SIRT3 Protein Deacetylates Isocitrate Dehydrogenase 2 (IDH2) and Regulates Mitochondrial Redox Status. J Biol Chem. 2012;287:14078–14086. doi: 10.1074/jbc.M112.355206. [DOI] [PMC free article] [PubMed] [Google Scholar]
- Zhang Z, Tan M, Xie Z, Dai L, Chen Y, Zhao Y. Identification of lysine succinylation as a new post-translational modification. Nat Chem Biol. 2011;7:58–63. doi: 10.1038/nchembio.495. [DOI] [PMC free article] [PubMed] [Google Scholar]
- Zhao S, Xu W, Jiang W, Yu W, Lin Y, Zhang T, Yao J, Zhou L, Zeng Y, Li H, et al. Regulation of cellular metabolism by protein lysine acetylation. Science. 2010;327:1000–1004. doi: 10.1126/science.1179689. [DOI] [PMC free article] [PubMed] [Google Scholar]
Associated Data
This section collects any data citations, data availability statements, or supplementary materials included in this article.
Supplementary Materials
Table S1, related to Figure 4. Selected urinary organic acids from WT and HMGCL KO mice.
Table S2, related to Figure 4. Non-quantitative proteomic survey of HMGylation, MGylation, and MGcylation in livers from HMGCL KO and WT mice. Supplemental Excel file containing protein-level and peptide-level proteomic data on three acyl-lysine modifications compared from HMGCL KO and WT mouse liver samples after pan-HMG-lysine antibody peptide immunoprecipitation. Blue sheets 1–4 are HMGylated protein and peptide data in WT and HMGCLKO liver. Green sheets 5–8 are MGylated (methylglutarylated) protein and peptide data in WT and HMGCLKO liver. Yellow sheets 9–12 are MGcylated (methylglutaconylated) protein and peptide data in WT and HMGCLKO liver.
- Tab 1) Key. Includes a detailed summary of the information fields included in the columns of the subsequent three tabs. The “comments” column describes (in grey shading) cases where certain rows or columns are hidden initially, but users can right click and select “unhide” to view the information.
- Tab 2) HMGylated peptide quant. Annotation of all HMGylated peptides identified at 1% FDR, and relative quantitation statistics.
- Tab 3) Protein quant. Annotation of all “Master” proteins identified at 1% FDR and relative quantitation statistics.
- Tab 4) Protein group metadata. Additional protein-level annotation for all possible proteins to which the identified peptides map (not just Master proteins identified at 1% FDR), including summary of all sites of modification identified in this study.
- Tab 1) Key. Includes a detailed summary of the information fields included in the columns of the subsequent three tabs. The “comments” column describes (in grey shading) cases where certain rows or columns are hidden initially, but users can right click and select “unhide” to view the information.
- Tab 2) Glutarylated peptide quant. Annotation of all glutarylated peptides identified at 1% FDR, and relative quantitation.
- Tab 3) Protein quant. Annotation of all “Master” proteins identified at 1% FDR and relative quantitation.
- Tab 4) Protein group metadata. Additional protein-level annotation for all possible proteins to which the identified peptides map (not just Master proteins identified at 1% FDR), including summary of all sites of modification identified in this study.
- Note: Data from the remaining four channels of the TMT six-plex are not shown since they included other dietary/fasted conditions of GCDH WT and KO mice not discussed in this manuscript.