Abstract
PDBsum is a database of mainly pictorial summaries of the 3D structures of proteins and nucleic acids in the Protein Data Bank. Its pages aim to provide an at-a-glance view of the contents of every 3D structure, plus detailed structural analyses of each protein chain, DNA–RNA chain and any bound ligands and metals. In the past year, the database has been significantly improved, in terms of both appearance and new content. Moreover, it has moved to its new address at http://www.ebi.ac.uk/thornton-srv/databases/pdbsum.
INTRODUCTION
The PDBsum database was created at University College London in 1995 (1,2). Its aim was to provide an illustrated and informative summary for each of the 3D structures released by the Protein Data Bank (PDB) (3).
As of July 1, 2004, the database has been transferred to the European Bioinformatics Institute having had a complete facelift and many new analyses and links added to it. Its new address is http://www.ebi.ac.uk/thornton-srv/databases/pdbsum. We describe in this paper, some of the improvements that have been made and the new features that have been added.
NEW LAYOUT
The most obvious change that has been made is to the appearance of the web pages. These have been modernized, simplified and structured in a more logical manner and are now generated dynamically. Each structure's home page now provides a thumbnail image(s) of the structure plus, below it, an index listing the molecules it contains, in terms of protein chain(s), DNA–RNA chains, small-molecule ligands, metal ions and number of water molecules. Clicking on the items in the index takes you to the analyses provided for that molecule type (secondary structure diagrams for protein chains, protein–ligand interactions for the ligands, and so on). The index thus provides an at-a-glance summary of the molecules contained in the PDB entry.
Much duplication of redundant information has been removed. Thus, for example, where a structure contains multiple copies of the same protein chain, only a representative chain is described in detail; previously all structures were rather unnecessarily described. This is reflected in the index, which groups together or separates the protein chains accordingly. So you can immediately see that, say, the structure consists of four chains (A, B, C and D) which are all equivalent, or conversely, that the structure consists of two dissimilar protein chains, A and B, etc. Similarly, for ligands, multiple copies of the same ligand, making identical interactions with equivalent protein chains, are now shown only once.
In addition to the thumbnail image and index of contents, the home page of each entry also provides the usual descriptive information (such as title, authors, date of deposition), links to other sequence and structure databases, summary PROCHECK (4) analyses and a button for viewing the structure in RasMol (5).
A novel feature is a link to a server that allows you to automatically generate your own image of the structure via MolScript (6) and Raster3d (7). Another new feature, for most enzyme structures, is a diagram of the reaction catalysed by the enzyme. The diagram shows chemical drawings of the reactants, products and, where relevant, cofactors. The drawings are generated from mol2 files that were downloaded from the KEGG (8) ftp site. Of particular interest are structures where the bound ligand corresponds to, or is similar, to one of the molecules involved in the reaction. These are identified on the diagram with their percentage similarity to the molecule in question. Similarities are calculated by using a simple graph-match between the atom types and connectivities of the structure's ligands and the reaction molecules. Figure 1 shows an example.
Figure 1.

Diagram showing the reaction catalysed by enzymes of class E.C.2.6.1.16—the glucosamine 6-phosphate synthases. The diagram is taken from the PDBsum page for 1gdo, where the bound ligand—an l-glutamate—corresponds to one of the enzyme's products and is highlighted with a blue border in the diagram. Clicking on the highlighted molecule goes to the corresponding ligand page.
PROTEIN PAGES
Each representative protein chain in a given structure has its own page holding a ‘wiring diagram’ of its secondary structure, plus domain organization as given in the CATH fold classification database (9). As before, a detailed analysis of the secondary structure motifs is provided, via PROMOTIF (10), and any valid PROSITE patterns (11) contained within the sequence are mapped to the 3D structure (12) via RasMol.
There are two new features on these pages. The first is the thumbnail image, which shows the chain in question in solid representation, any identical chains as semi-transparent and all other molecules in the structure as transparent. Clicking on the image brings up a picture of the chain itself. For large and complex structures, this can help locate the chain in the structure as a whole.
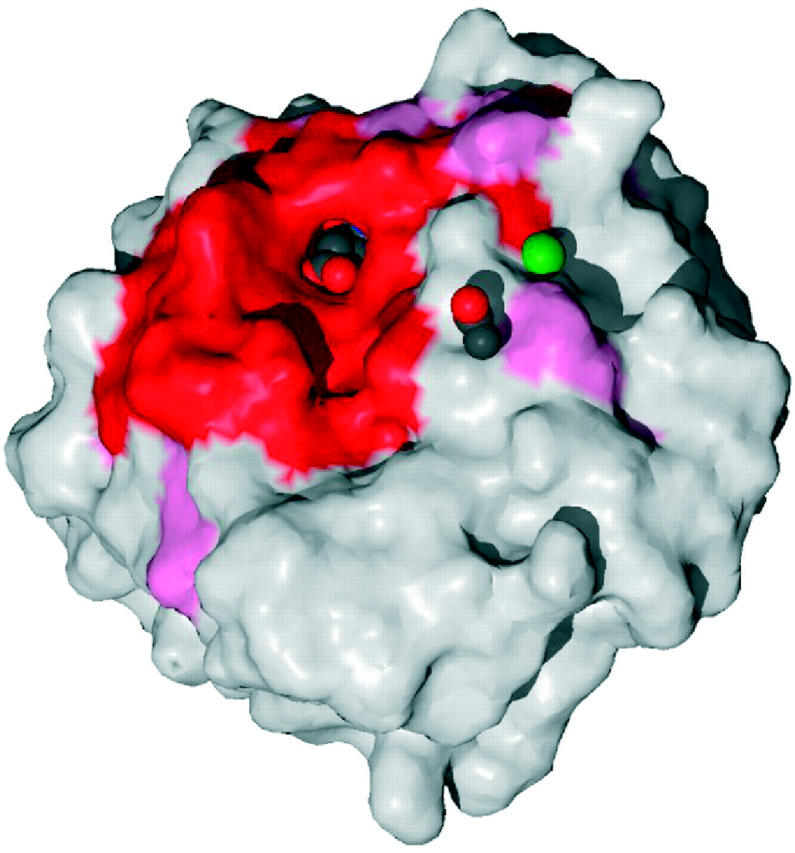
The second novel feature is the inclusion of residue conservation data, where available. It is well known that highly conserved residues are usually crucial to the function of the protein, and their location on the surface of the protein can pinpoint the functionally active region. The conservation of each residue is computed by the ConSurf (13) program, which uses multiple sequence alignments of the protein chain against homologues in the sequence databases. The residues are coloured according to their conservation score on the wiring diagram and a RasMol view of the protein's surface shows the most and least highly conserved regions on the surface (see Figure 2). An alternative view of the 3D structure, again using RasMol, is provided by using the ConSurf colouring scheme.
Figure 2.

Surface of the glucosamine 6-phosphate synthase structure (PDB code 1gdo) coloured by residue conservation: red and pink for the most highly conserved regions, and blue for the most variable. The bound ligand—an l-glutamate—can be seen in spacefill representation within the highly conserved binding pocket. Also bound are an acetate ion and a sodium ion (green sphere).
LIGAND AND METAL ION PAGES
The ligand pages show the various ligand molecules and metal ions bound to the protein or DNA molecules in the structure. Where there are many instances of the same ligand or metal, only a representative example is given; identical molecules making identical interactions with equivalent protein chains are merely listed. Such rationalization is necessary as some structures these days have staggeringly large numbers of bound ligands—see for example PDB code 1qzv, which has no fewer than 334 alpha-chlorophyll A molecules, plus others, bound to a large complex of 32 protein chains corresponding to plant photosystem I.
THE ENZYME STRUCTURES DATABASE (EC → PDB)
The Enzyme Structures Database, http://www.ebi.ac.uk/thornton-srv/databases/enzymes, is a subset of PDBsum, which provides a separate grouping of all the enzymes structures in the PDB, classified by their enzyme classification (EC) numbers (14). The database preserves the hierarchy of the EC numbering scheme, showing the number of PDB structures belonging to the class at each level. At the lowest level, the listed PDB codes link directly to their PDBsum pages. Where any of the listed structures contain ligands that resemble, or correspond to, any of the reaction molecules, this resemblance is given by a percentage similarity. This helps identify structures, belonging to a specific enzyme class, which may be the most informative in terms of where and how the cognate ligand(s) bind.
The EC hierarchy, descriptions, reactions and reaction molecules are obtained from the ENZYME database (15). The molecule definitions are downloaded as mol2 files from the KEGG ftp site, as mentioned above.
PDBsum HIGHLIGHTS
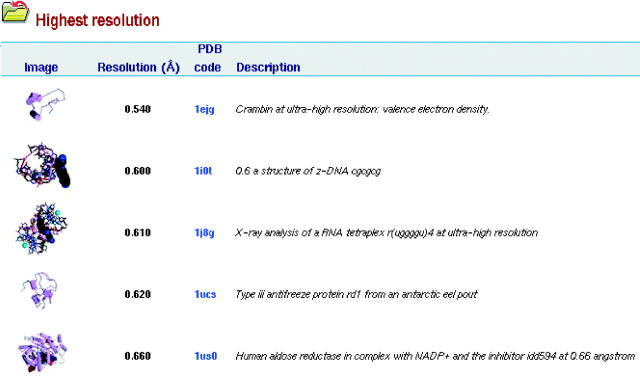
A new feature, accessed from the PDBsum home page, is the Highlights page. This tabulates the most extreme entries in the database in terms of various attributes: oldest depositions, youngest, largest, smallest, longest chain, most ligands, highest resolution, lowest, and so on (see Figure 3). This helps locate some of the more unusual structures that have been solved to date! More highlights are planned as the PDB is full of the weird and the wonderful.
Figure 3.
Example of one of the PDBsum highlights listings, here showing the top five structures in terms of the highest quoted resolution.
Acknowledgments
ACKNOWLEDGEMENTS
We would like to thank the MSD group for making their database available for the extraction of PDB to SWISS-PROT and EC number mappings. We also thank Dr Nir-Ben Tal for making the ConSurf residue conservation data available and Dr Fabian Glaser and Yossi Rosenberg for setting up an ftp mirror for regular retrieval of these data. The development of the new version of PDBsum has been funded by the Wellcome Trust.
REFERENCES
- 1.Laskowski R.A., Hutchinson,E.G., Michie,A.D., Wallace,A.C., Jones,M.L., Thornton,J.M. (1997) PDBsum: a web-based database of summaries and analyses of all PDB structures. Trends Biochem. Sci., 22, 488–490. [DOI] [PubMed] [Google Scholar]
- 2.Laskowski R.A. (2001) PDBsum: summaries and analyses of PDB structures. Nucleic Acids Res., 29, 221–222. [DOI] [PMC free article] [PubMed] [Google Scholar]
- 3.H.M. Berman H.M., Westbrook,J., Feng,Z., Gilliland,G., Bhat,T.N., Weissig,H., Shindyalov,I.N., Bourne,P.E. (2000) The Protein Data Bank. Nucleic Acids Res., 28, 235–242. [DOI] [PMC free article] [PubMed] [Google Scholar]
- 4.Laskowski R.A., MacArthur,M.W., Moss,D.S., Thornton,J.M. (1993) PROCHECK—a program to check the stereochemical quality of protein structures. J. Appl. Crystallogr., 26, 283–291. [Google Scholar]
- 5.Sayle R.A. and Milner-White,E.J. (1995) RASMOL: biomolecular graphics for all. Trends Biochem. Sci., 20, 374–376. [DOI] [PubMed] [Google Scholar]
- 6.Kraulis P.J. (1991) MOLSCRIPT: a program to produce both detailed and schematic plots of protein structures. J. Appl. Crystallogr., 24, 946–950. [Google Scholar]
- 7.Merritt E.A. and Bacon,D.J. (1997) Raster3D: photorealistic molecular graphics. Methods Enzymol., 277, 505–524. [DOI] [PubMed] [Google Scholar]
- 8.Kanehisa M., Goto,S. (2000) KEGG: Kyoto Encyclopedia of Genes and Genomes. Nucleic Acids Res., 28, 27–30. [DOI] [PMC free article] [PubMed] [Google Scholar]
- 9.Pearl F.M.G, Lee,D., Bray,J.E, Sillitoe,I., Todd,A.E., Harrison,A.P., Thornton,J.M. and Orengo,C.A. (2000) Assigning genomic sequences to CATH. Nucleic Acids Res., 28, 277–282. [DOI] [PMC free article] [PubMed] [Google Scholar]
- 10.Hutchinson E.G. and Thornton,J.M. (1996) PROMOTIF — a program to identify and analyze structural motifs in proteins. Prot. Sci., 5, 212–220. [DOI] [PMC free article] [PubMed] [Google Scholar]
- 11.Hulo N., Sigrist,C.J.A., Le Saux,V., Langendijk-Genevaux,P.S., Bordoli,L., Gattiker,A., De Castro,E., Bucher,P. and Bairoch,A. (2004) Recent improvements to the PROSITE database. Nucleic Acids Res., 32, D134–D137. [DOI] [PMC free article] [PubMed] [Google Scholar]
- 12.Kasuya A. and Thornton,J.M. (1999) Three-dimensional structure analysis of PROSITE patterns. J. Mol. Biol., 286, 1673–1691. [DOI] [PubMed] [Google Scholar]
- 13.Glaser F., Pupko,T., Paz,I., Bell,R.E., Bechor-Shental,D., Martz,E. and Ben-Tal,N. (2003) ConSurf: identification of functional regions in proteins by surface-mapping of phylogenetic information. Bioinformatics, 19, 163–164. [DOI] [PubMed] [Google Scholar]
- 14.Bielka H., Dixon,H.B.F., Karlson,P., Liebecq,C., Sharon,N., van Lenten,E.J., Velick,S.F., Vliegenthart,J.F.G. and Webb,E.C. (1992) E.C. enzyme nomenclature 1992: recommendations of the Nomenclature Committee of the International Union Of Biochemistry and Molecular Biology on the nomenclature and classification of enzymes. Nomenclature Committee of the International Union of Biochemistry. Academic Press, Inc., Ltd, London. [Google Scholar]
- 15.Bairoch A. (2000) The ENZYME database in 2000. Nucleic Acids Res., 28, 304–305. [DOI] [PMC free article] [PubMed] [Google Scholar]


