Figure 4.
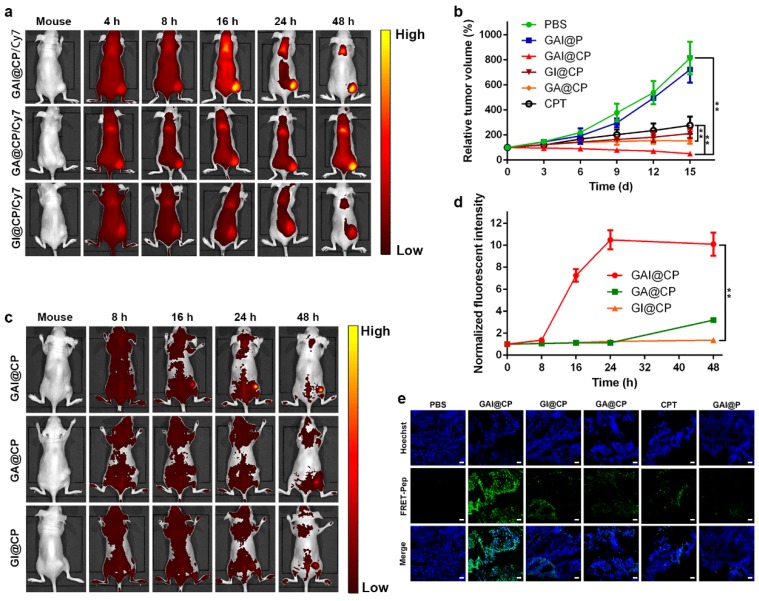
In vivo fluorescence imaging, therapy and therapeutic self-reporting with GAI@CP. (a) Real-time in vivo images by monitoring Cy7 fluorescence of subcutaneous HeLa tumor-bearing mice after intravenous injection of GAI@CP/Cy7, GA@CP/Cy7 and GI@CP/Cy7. (b) Relative tumor volume changes of subcutaneous HeLa tumor-bearing mice after intravenous injection of PBS, GAI@P, GAI@CP, GI@CP, GA@CP and CPT, respectively. The dose of nanoparticle was 2.5 mg kg-1 CPT equiv. Data are means ± SD (n = 12, *P < 0.05, **P < 0.01 using a one-way ANOVA). In vivo therapeutic monitoring of FRET-Pep fluorescence (c) and semi-quantitative analysis of fluorescent intensity at tumor sites (d) on subcutaneous HeLa tumor-bearing mice after intravenous injection of GAI@CP, GA@CP and GI@CP, respectively. (e) Fluorescence images of tumor slice for apoptotic assays after treated with PBS, GAI@CP, GI@CP, GA@CP, CPT and GAI@P over 15 d, respectively. Scale bars: 50 μm.

