

Abstract
Selective cell adhesion is desirable to control cell growth and migration on biomedical implants. Mesenchymal cell migration is regulated through focal adhesions (FAs) and can be modulated by their microenvironment, including changes in surface topography. We use the Number and Molecular Brightness (N&B) imaging analysis to provide a unique perspective on FA assembly and disassembly. This imaging analysis generates a map of real-time fluctuations of protein monomers, dimers, and higher order aggregates of FA proteins, such as paxillin during assembly and disassembly. We show a dynamic view of how nanostructured surfaces (nanoline gratings or nanopillars) regulate single molecular dynamics. In particular, we report that the smallest nanopillars (100 nm spacing) gave rise to a low percentage population of disassembly adhesion cluster size of ~2 paxillin proteins/cluster whereas the larger nanopillars (380 nm spacing) gave rise to a much larger population of larger disassembling cluster of ~3–5 paxillin proteins. Cells were more motile on the smaller nanopillars (spaced 100–130 nm apart) compared to all other surfaces studied. Thus, physical nanotopography influences cell motility, adhesion size, and adhesion assembly and disassembly. We report for the first time, with single molecular detection, how nanotopography influences cell motility and protein reorganization in adhesions.
Keywords: nanotopography, cell migration, focal adhesions, Numbers and Brightness, paxillin
Graphic Abstract
We provide a dynamic perspective of how nanostructured surfaces regulate dynamics of single molecular adhesions.
Introduction
The ability to control cell adhesion formation is desired in biomedical implants to reduce the risk of rejection or overgrowth of scar tissue. There is consequently interest in modifying device surfaces through chemical or physical means.1–4 Chemical coatings can diminish in effectiveness over time, or become covered by the extracellular matrix (ECM). Modifying the physical topography of the surfaces is a highly desirable alternative for longer-lasting control.
The effect of surface presentation on cell behavior has been shown to be critically important. To vary the surface, micro- and nano-contact printing are often used to transfer ECM proteins onto the substrate.5–9 However, this method produces a two-dimensional (2D) surface and does not simulate a three-dimensional (3D) in vivo environment. Studies using quasi-3D nanostructured surfaces provided important clues to the nature of cell adhesion, but the role of FAs — protein complexes that regulate adhesion and migration10–12 — with respect to those structured surfaces was not clarified.3,13,14
We describe herein the utilization of nanoimprint lithography to produce 2.5-D nanostructures on surfaces of poly(methyl methacrylate) (PMMA) with one line pattern (L) and pillar patterns (P), denoted L860, P700, P600, P300, P200 where the numerical values represent the center-to-center spacing or array periodicity. These periodic structures have line or pillar widths = 430, 267, 215, 190, 70 nm, respectively (Figure 1, Table 1).15,16 The sizes of the nanofeatures were chosen based on findings from previous work.13,15,17 Only one nanoline pattern was included in this study because cell behavior on line structures has already been well-studied.3,17–19 Thus, L860 was used as a reference to compare cell behavior results on flat and pillared surfaces.
Figure 1. SEM of nanostructures imprinted on PMMA.

Nanotopographies include one line pattern (L860, line width = 430 nm) as a reference, and 4 pillar patterns (P700, P600, P300, P200; pillar widths = 267 nm, 215 nm, 190 nm, 70 nm, respectively). A spin-coated PMMA film served as the flat control. SEM images were taken at 5 kV with FEI Quanta 3D (scale = 1μm) at 30° tilt.
Table 1.
Dimensions of Nanostructures
| Pattern | Feature Width (nm) | Feature Height (nm) | Array Periodicity (nm) |
|---|---|---|---|
| L860 | 430 | 200 | 860 |
| P700 | 267 | 300 | 692 |
| P600 | 215 | 300 | 595 |
| P300 | 190 | 300 | 320 |
| P200 | 70 | 210 | 170 |
Nanostructures are most appropriate for modulating cell behavior through individual adhesions. For example, cells on nanolines migrate and form adhesions parallel to the features17,18,20,21 while those on nanopillars form smaller adhesions and migrate omnidirectionally.13,22,23 During migration, cell polarization causes new adhesions to form at the leading edge while mature stable adhesions disassemble at the trailing edge.24 Many of these studies examine the role of FAs during cell migration by staining for focal adhesion proteins; however, this method does not capture the dynamics of proteins of the FAs. Thus, examination at the single-protein scale in live cells is important to understand how the formation of adhesions on these patterns will affect cell migration.
Advances in fluorescence correlation spectroscopy (FCS) enable spatiotemporal detection of single molecules. Using the same data set, the molecular brightness of individual molecules can be calculated by photon counting histogram analysis within the diffraction-limited volume (~250 nm).25–27 To obtain a pixel by pixel protein aggregation map of the FA protein paxillin diffusing within the cell, we use an image analysis technique, Number and Molecular Brightness (N&B).28,29
We further compared migration behavior, paxillin aggregation ratios, and adhesion size of NIH 3T3 fibroblasts plated on a flat surface, a nanoline pattern, and nanopillars of varying width and periodicity. We found that cell motility is highly sensitive to particular types of nanotopography. Specifically, nanopillar PMMA surfaces, which possess a six-fold symmetry, guided cells to migrate in specific orientations. In addition, cells on the smallest nanopillars (P200 and P300) exhibited the highest motility but had the lowest population of disassembling clusters of protein (~2 paxillin/cluster). Cells on pillars spaced 380 nm apart (P600) exhibited the largest population of higher order protein aggregates (~ 3–5 paxillin/cluster) and concurrently larger disassembly adhesions. These results provide a deeper understanding of the dynamics of adhesion formation and disassembly during migration. This is the first report on molecular scale dynamics of adhesions influenced by nanostructures, and the correlation of assembly and disassembly of adhesions to cell migration on nanostructured surfaces.
Results and Discussion
Cell Migration on Nanostructured Surfaces
In order to observe cell migration behavior on our nanostructures, we took time-lapse images of cells seeded on the different surfaces at one-minute intervals over a 12-hour period (Supplemental Movies 1–6). The positions of cells on each surface were tracked for the full 12 hours. Cells included in the analysis were ones present from the first frame to the ending time point (frame 700). We excluded cells that migrated out of the frame of view, divided, or died before the 12-hour period from analysis. For all experiments, we coated the PMMA surface with fibronectin, and we assumed that PMMA surfaces behaved as a rigid material.
First, we calculated the average radius of each migration path. This represents the distance from the original position to the furthest point. Radial plots of the cell trajectories on the surfaces show that cells on L860 (Figure 2B) generally migrated along the underlying line structures within an average net radius of 150 μm, while cells on the nanopillars (Figures 2C–F; P700, P600, P300, P200, respectively) migrated in orientations that are guided by the geometric arrangement of the pillars. Cells on flat surfaces (Figure 2A) migrated in random directions within an average net radius of 112 μm. More significantly, cells on P300 and P200 nanopillars traveled within an average net radius of 154 and 153 μm, respectively (p<0.01 for P300 vs. flat surfaces, p<0.05 for P200 vs. flat surfaces).
Figure 2. Migration behavior on nanostructured surfaces.

Migration trajectories of 3T3 cells over 12 hours on (a) flat surface, n=54 cells; (b) L860 lines, n=63; (c) P700 pillars, n=70; (d) P600 pillars, n=72; (e) P300 pillars, n=32; and (f) P200 pillars, n=36. The axes display coordinate values in μm. All surfaces coated with fibronectin (1 μg/ml). Black circle in plots represent the net radius of migration trajectories of cells on each surface. (g) Average migration speed of cells. The values below each pattern represent mean ± standard error of the mean (S.E.M.) Statistical significance was assessed using the Student’s t-test: *: p<0.05 compared to P700; **: p<0.01 compared to other surfaces. (h) Total distance traveled on nanostructured surfaces over 12 hours. Data represents mean ± S.E.M. Statistical significance was assessed using the Student’s t-test. **: p<0.01 compared to L860; #: p<0.01 compared to Flat, P700, and P600.
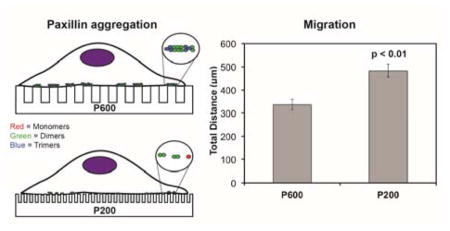
It is interesting to determine if these nanostructures affected cell motility. To this end, we determined the migration speed (Figure 2G) and the total migration distance traveled of each cell on the nanostructured surfaces (Figure 2H). We defined the total migration distance as the sum of the distances traveled at each time point. We found that cells on the P700 and P600 nanopillared surfaces traveled similar total distances (372 and 336 μm, respectively) over 12 hours compared to cells on flat surfaces (387 μm). We found also that cells on flat and P700 surfaces migrated at similar average speeds (0.55 and 0.57 μm/min, respectively), while those on P600 surfaces migrated at a slightly slower average speed (0.48 μm/min). By comparison, cells on P300 and P200 surfaces were the most motile with an average total distance traveled of 472 and 483 μm, respectively. Interesting, cells on the P200 pillars migrated on the surface at a higher average speed than those on the other surfaces, especially the P300 pillars (0.77 vs. 0.59 μm/min; p<0.01). Upon closer examination of the speed data, we found that cells on P300 pillars had more periods of rest compared to cells on the P200 pillars. This suggests that cells on P200 were moving more often than cells on P300 during the recorded migration time (data not shown). Over the 700-minute period, cells on P300 were immobile for on average 82% of the time, while cells on P200 were immobile for on average 71% of the time. This significant difference (p<0.01 by Student’s t-test) may imply that adhesions formed on P200 pillars were less stable than adhesions formed on the P300 pillars, as suggested by Kong et al.13 The instability could be due to the size of the adhesions, which we discuss later. This would explain the discrepancy between average speed versus the total distance traveled by cells on P300 and P200 pillars.
Cells on L860 surfaces traveled the shortest total distance on average (229 μm). The average speed of these cells was also significantly lower than the speed of cells on the other surfaces (0.36 μm/min; p<0.01). In addition, cells were immobile for 89% of the time. These results should be contrasted with findings in other studies that show cells on nanolines (width = 350 nm to 6 μm, spacing = 70 nm to 4 μm) where it is reported that they travel farther than those on flat surfaces.30–32 However, our results are similar to those of Ferrari et al., in which cells on nanolines of similar size as L860 traveled a shorter distance over time compared to cells on flat surfaces.17 This suggests that the size of the line gratings may affect the formation of the adhesions and, as suggested by Ferrari et al., cytoskeletal structures that are needed in the correct orientation optimal for migration. In addition, cells on the L860 patterns initially take time to elongate before motion of the cell body is observed. This may be why we observe less cell motility on the nanolines within the time frame of tracking.
Migration trajectories of cells showed possible directional migration that correlated with the topography. To determine if a topographical correlation does exist, we measured the migration direction on each surface using an algorithm that determined the best-fit angle of each trajectory with respect to a reference line on the surface pattern that we define as the 0 degree direction. The choice of the reference direction is detailed as follows. The range of the measured angles was between −90 to 90 degrees. We defined the migration direction of the cells on the line surface as the absolute difference between the measured cell angle and the nanoline pattern (at either 0 or 90 degrees), as illustrated in Figure 3A. In our calculations, we took migration directions along the same orientation as the structures to be 0 degrees.
Figure 3. Migratory direction of cells on nanostructured surfaces.

(a) Schematic showing reference frame of migration direction on nanolines. (b) Schematic showing reference frame of migration direction on nanopillars. (c) Angular histogram for migration direction on the flat surface indicates random migration. (d) Distribution of migration direction on the L860 lines shows a large proportion of cells migrating between 0° and 15°, indicating migration along the nanolines. (e–h) Plots for nanopillars indicate that all cells migrated at angles between 0° and 30°, indicating preferential migration in directions with the highest density of nanopillars.
On the P700, P600 and P300 pillared surfaces, we defined the trajectory angles of the cells on the pillars as the absolute difference of the measured cell angle and the closest 60-degree increment axis (−60, 0 or 60 degrees), which was defined as the reference direction in Figure 3B. The entire pillared surface is arranged in a hexagonal array, which has a six-fold symmetry; hence, the axes at −60, 0 or 60 degrees have the same symmetry and cells could travel in the proximity of any of these axes if presence of the pillars guided their migrations. In our calculations, migration directions along these axes of symmetry were defined as 0 degrees. Since the 0-degree axis corresponded to the directions with the highest density of pillars, it could correlate with a directional preference for cell migration. Alternatively, if cells were exactly half way between two axes, the difference between the symmetry and migration direction would be 30 degrees. This would indicate that cells on the nanopillars were migrating along the path with the lowest density of pillars. On the P200 pillared surfaces, there was no long-range order, in contrast to the other pillared surfaces. However, there was still short-range order,33 which provided six-fold symmetry locally. This short-range order was confirmed by Fast Fourier Transform of a SEM image of the P200 pillars (unpublished data). We found that the P200 pillars apparently could provide the same guidance for cell migration as the other pillars despite the lack of long-range order.
The angular histograms (Figure 3) show that cell migration was indeed guided by the symmetry of the underlying nanostructures. On a flat surface (Figure 3C), the histogram was spread between 0 and 90 degrees, indicating that there is no preferential direction for migration. On the L860 nanolines (Figure 3D), the majority of cells migrated at directions close to 0 degrees. This indicates that most cells migrated in the same direction as the lines, consistent with previous studies, as is expected.3,34,35 On the P700 and P600 pillars (Figures 3E, F, respectively), half of the cells migrated at directions close to 0 degrees—along one of the hexagonal axes. On the P300 and P200 pillars (Figures 3G, H, respectively), a higher proportion of cells migrated at directions close to 0 degrees—along one of the hexagonal axes—compared to cells on the larger pillars. This indicates that the smaller pillars were more effective at guiding cells to migrate along the paths with the highest density of pillars.
The foregoing demonstrated that the differences in motility on the pillars can be attributed to pillar size and spacing. Previous studies have shown that when integrin proteins are separated more than 73 nm apart, they are not able to dimerize and form the FA complex.23,36,37 In turn, the actin cytoskeleton is also unable to sustain the FAs. Accordingly, we fabricated nanostructures with inter-pillar spacings greater than 73 nm to study the effect of potentially unstable adhesions. In particular, the P700 and P600 pillars had similar diameters and spacings; the difference in spacing between the two surfaces is only 45 nm. Similarly, the P200 and P300 pillars differed in spacing by 50 nm, which could explain why the cells traveled similarly on these respective sets of pillared surfaces.
In addition, three to five integrin heterodimers are necessary in order for the FA complex to form.38 The diameters of the P200 and P300 pillars were 70 nm and 190 nm, respectively, which could cause very small adhesions to form (about 15–30 integrin proteins). In fact, we found that cells on the P300 and P200 pillars have the smallest adhesion area compared to those on the other patterns, which we discuss later in this paper. These small adhesions would more easily disassemble during migration.10 These results suggested that the high motility on P300 and P200 was due to an increase in adhesion assembly and disassembly. This suggests to us that there were changes in protein dynamics caused by the underlying surface morphology that could affect the assembly and disassembly of the adhesions. However, these dynamics could not be observed by simply imaging adhesions. In the next section, we describe how we utilized the N&B analysis to examine the assembly and disassembly aggregation dynamics of the adhesions of cells on the various nanostructures at the molecular level.
Paxillin Aggregation on Nanostructured Surfaces
The process of adhesion assembly and disassembly is dynamic. Adaptor proteins such as paxillin and many others bind to partners with tight affinity rendering conformational changes that trigger other proteins to associate at the focal region. We showed that this process of assembly occurs with monomeric proteins (i.e. paxillin, vinculin and FAK), but not with preassembled adhesion aggregates.28,39–41 In order for migration to occur, these adhesive complexes must dissociate with high temporal dynamics. It is not feasible for the adhesion to disassemble one protein at a time. Instead, we speculate that the cells utilize the protease identified as calpain to cleave focal adhesion proteins such as talin, which tethers integrin to the cytoskeleton structure.42 This cleavage gives rise to conformational instability for the adhesive proteins. Large aggregates begin to dissociate and are quickly returned to their monomeric conformation to be recycled or disposed of.39 This process presents a unique opportunity to study regions of cellular migration by detecting and quantifying the size of these protein dissociation aggregates using Number and Brightness (N&B) analysis, a powerful tool that graphically quantifies the aggregation states of diffusing proteins of adhesions in living cells.
We transfected cells with the paxillin-EGFP vector prior to each experiment, after which we performed brightness analysis to quantify the aggregation states of paxillin at the adhesions. The average intensity of paxillin-EGFP was detected in the confocal images of the adhesions at the trailing edges of cells on the different surfaces. However, the average intensity images would not indicate the composition of paxillin molecules in the fluorescent regions; thus, we calculated the brightness of the fluorescence intensity by detecting the fluctuations of the fluorescent paxillin molecules over time to calculate its molecular brightness and translating this values to its aggregation state.29 A graph was generated to show brightness versus intensity of every pixel in the original image. The molecular brightness of monomeric EGFP (mEGFP) was used as a calibration to calculate the molecular brightness of a monomer (Figure 4). The average intensity of mEGFP in Figure 4A showed a gradient of mEGFP in the cell: a higher concentration at the center of the cell (red) and less at the edges (blue). However, the brightness map of the same cell showed a uniform coloring of the cell (red) since the cell was only expressing monomeric versions of EGFP. Therefore, the brightness was found to be independent of concentration. Once the apparent brightness of mEGFP was found, we used it to calculate the molecular brightness of a dimer by doubling its value (a two-fold increase). The molecular brightness of higher order aggregates was determined in the same manner (three-fold or higher increase). For our results, we combined the population of trimers, tetramers, and 5-mers into one tier. In Figure 5B, red, green, and blue pixels was used to map out the location of monomers, dimers (~2 paxillin proteins/cluster), and higher order aggregates (~3–5 paxillin proteins/cluster), respectively. Pixels of the image were colored according to the corresponding cursors (Figure 5A).
Figure 4. Analysis of monomeric GFP brightness.

(a) Average intensity of monomeric EGFP (mEGFP) in a cell only expressing mEGFP on a flat surface. Scale = 5 μm. (b) Brightness map of the same cell. Red pixels highlight monomer EGFP, while yellow pixels highlight background. The brightness value was used to calculate the brightness of all the aggregate tiers. (c) Brightness of every pixel of image versus intensity generated from N&B analysis.
Figure 5. Paxillin aggregation states of adhesions in cells on nanostructured surfaces.

(a) Average fluorescence intensity of the trailing edges of 3T3 fibroblasts (scale = 5μm) and their corresponding brightness maps. Colors correspond to pixels of monomers (red), dimers (green) and higher order aggregates (blue) of diffusing paxillin. (b) Plot of the brightness of every pixel in an image versus its intensity generated from the N&B analysis. This exemplary plot is of cells on P600 pillars. (c) Ratio of dimers to monomers (D:M; green) and higher order aggregates to monomers (H:M; blue) in cells on nanostructured surfaces. Cells on P600 pillars (n=16 cells) exhibited the largest D:M and H:M ratios, indicating that the adhesions in those cells have a larger population of higher order aggregates. Cells on the other pillars (P700: n = 11; P300: n = 15; P200: n = 10) had smaller ratios compared to those on flat (n=12) and L860 lines (n-16). Data represents mean ± S.E.M. Statistical significance was assessed using the Student’s t-test. *: p<0.05 for D:M ratios; **: p<0.01 for D:M ratios; +: p<0.05 for H:M ratios; ++: p<0.01 for H:M ratios. For P200: **: p<0.01 for D:M ratios compared to all other surfaces; +: p<0.05 for H:M ratios compared to flat and P700; ++: p<0.01 for H:M ratios compared to P600, P300, L860.
Based on the definition of molecular brightness, immobile protein aggregates would have an apparent molecular brightness equal to 1. For example, the average intensity image of the cell on flat surfaces showed that there are many adhesions present. These adhesions were stable, i.e., they do not assemble or disassemble very quickly (within ~3-minutes) and thus, we assign to them a brightness of 1, indicated in red on the brightness map. We quantified the number of pixels highlighted by each cursor in the brightness versus intensity plot to give the ratio of dimers to monomers (D:M) or higher order aggregates to monomers (H:M). During these measurements, the observed cells appeared to retract; thus, we could quantify the disassembling adhesions with high accuracy. Based on previous data that paxillin molecules in disassembling adhesions cluster as aggregates,28 we expected highly motile cells to have a larger population of aggregates due to increased adhesion disassembly.
With the N&B analysis, we distinguished between the molecular differences in the adhesions of cells that exhibit similar motility behavior. We show the D:M and H:M ratios in cells on all surfaces in Figure 5C. We found that D:M and H:M ratios in cells on flat and L860 lines were similar to one another. The D:M and H:M ratios for cells on the four nanopillar patterns showed the highest ratio in cells on P600 pillars (0.12 D:M ratio, 0.02 H:M ratio), indicating that the adhesions in those cells had a larger population of higher order aggregates. However, cells on this surface were not the most motile. In fact, cells were the most motile on the P200 pillars, but contrary to our initial hypothesis, we found that the adhesions in these cells consisted mostly of monomers. We note that the size of the adhesions also contributes to the rate of adhesion disassembly during cell migration.39 Since the adhesions in cells on P600 nanopillars had the greatest percentage of dimers and higher order aggregates, these cells would have large adhesions. In turn, there are more aggregates to detach for full disassembly of the large adhesions, resulting in decreased cell motility on those pillars, as observed in Figure 2H.
Kim and Wirtz have shown that there is an optimal adhesion area that yields a peak migration distance, and if these are very large (>2.5 μm2), then migration distance will also decrease due to the stability of the adhesion.10 Smaller, less stable nascent adhesions are more predominant in motile cells, while stable, mature adhesions are found in cells that adhere well to a surface.43 We hypothesized that adhesions formed on nanopillars probably will be smaller than adhesions formed on flat surfaces, and that these smaller adhesions should disassemble at an increased rate. To investigate this, we measured the size of the disassembling adhesions examined with the N&B analysis (Figure 6A) using the freehand selection tool in ImageJ to trace the individual areas of the adhesions (Figure 6B). We specifically measured the area of each adhesion containing clusters of paxillin dimers or higher order aggregates localized at the retracting edges of cells.
Figure 6. Area of disassembling adhesions on nanostructured surfaces.
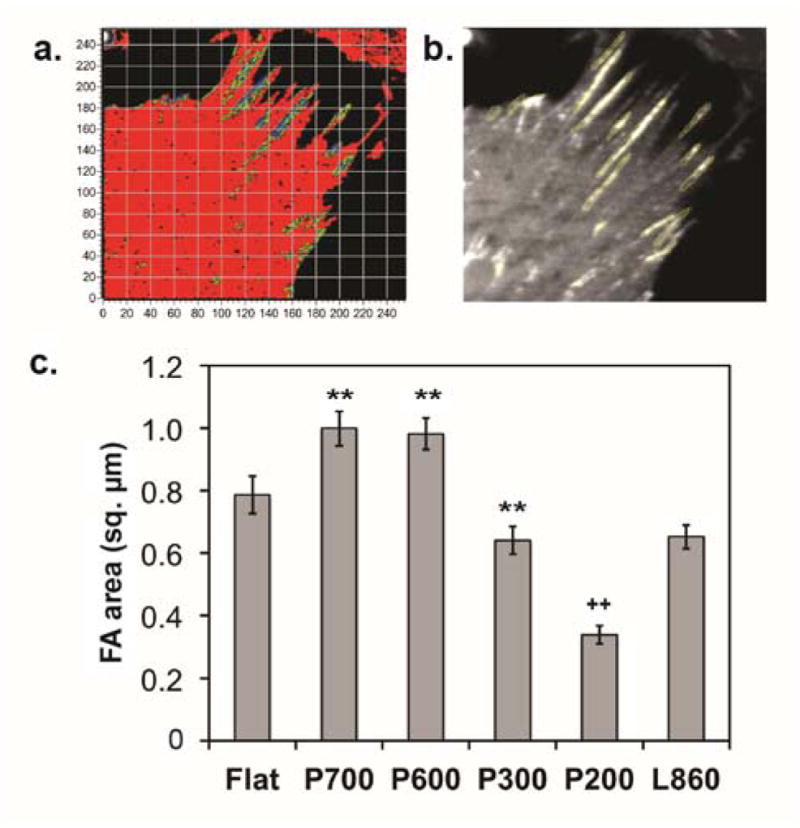
(a) Brightness map of trailing edge of a cell on P700 pillars. Adhesions involved in disassembly contain greater populations of dimers and higher order aggregates of paxillin. (b) Adhesion area of these adhesions was measured by using the free selection tool in ImageJ. Flat: n=152 adhesions, P700: n=258, P600: n=408, P300: n=71, P200: n=192, L860: n=299. (c) The largest adhesions were found in cells on the P700 and P600 pillared surfaces compared to flat and L860 lines. The smallest adhesions were in cells on the P200 pillars. The values below each pattern represent the mean. Error bars represent S.E.M. Statistical significance is assessed using the Student’s t-test. **: p<0.01 for P700, P600 compared to flat and L860, and for P300 compare to P700, P600; ++: p<0.01 for P200 compare to all patterns.
We found that on average, adhesions of cells on P700 and P600 surfaces (~1.0 μm2 for both) had the largest area compared to the other surfaces (Figure 6C). In contrast, cells on P200 surfaces had, on average, the smallest adhesion area (~0.34 μm2; p<0.01 compared to all surfaces). Cells on the P200 also exhibited the highest motility and had smaller ratios of H:M. Cells on L860 lines exhibited smaller adhesions (~0.65 μm2) than those in cells on the P700 and P600, yet they traveled the least total distance on the nanolines (Figure 2H). This discrepancy could be explained by differences in feature size or the time for the cell to orientate with the underlying structures.
These observations, taken together, suggest that cell migration on pillared surfaces depended on the ability to form mature adhesions, which requires time. Cells on larger nanopillars (P600) had a greater population of dimers and higher order aggregates while cells on smaller nanopillars (P300, P200) had fewer aggregates. This suggests that adhesions on P200 were more dynamic, which correlates to high cell motility on the P200 surfaces. Additionally, given the fact that adhesion size can modulate migration, it is also possible that the clusters of proteins that dissemble are correlated with adhesion size, thereby regulating their migration accordingly. In the case of the P200 surfaces, we found that there were fewer integrin protein clusters, forming very small adhesions, which allowed easier adhesion disassembly. We also found that cells on nanolines elongated and migrated parallel to the structures, which led to adhesion formation along the nanolines. The results indicate that the differences in the adhesion dynamics governing migration led to changes in the adhesions themselves, which are known to play an important role.
Conclusion
We have shown that physical nanotopography can modulate adhesion assembly and disassembly and migration of cells on polymer surfaces by changing the dimensions and geometry of nanostructures to similar dimensions of the adhesions, and that changes in adhesion dynamics influenced by the nanostructures affected cell migration. We found that cells on smaller nanopillars spaced 100–130 nm apart (P200 and P300, respectively) were more motile compared to cells on larger nanopillars, the nanoline grating reference, and the flat surface. At the molecular level, we found that cells on nanopillars spaced 380 nm apart (P600) had the largest population of higher order paxillin aggregates, and this population decreased with decreasing pillar size. This correlated well with the size of the adhesions; cells on larger nanopillars had the largest adhesions while those on the P200 pillars had the smallest adhesions. Moreover, we found that the cells migrated largely along the axes of symmetry of the hexagonal lattice of the nanopillars, which have the highest density of nanopillars of each pattern. We conclude that adhesion formation is essential for migration; yet, higher order paxillin aggregates provides the greatest temporal stability. The total distance traveled and paxillin aggregation population results suggest that the cells were able to adapt to the changes in topography up to a minimum threshold by modulating adhesion assembly and disassembly. Finally, by manipulating cell behavior at the molecular level solely through topographical cues, we can selectively control cell adhesion on the surfaces of biomedical devices and control their functionality.
Materials and Methods
Cell lines and reagents
NIH 3T3 fibroblasts (ATCC, CRL-1658) were cultured in high-glucose Dulbecco’s modified Eagle’s Medium (Life Technologies, Rockville, MD) containing 10% (v/v) fetal bovine serum (FBS, Life Technologies, Rockville, MD), 1% (v/v) nonessential amino acids, and 1% penicillin-streptomycin (Life Technologies, Rockville, MD) and maintained at 5% CO2 and 37°C. Cells were washed with 1X Dulbecco’s Phosphate Buffer Saline (Life Technologies, Rockville, MD) and detached with 1X Trypsin in EDTA (Life Technologies, Rockville, MD) and plated on various surfaces coated with 1 μg/ml fibronectin (Sigma, Aldrich, Milwaukee, WI) for experiments. For migration experiments, 100,000 cells were seeded on the nanostructured surfaces. For paxillin experiments, cells were seeded into a 6-well culture plate overnight and transfected with 1 μg monomer EGFP or paxillin-EGFP DNA plasmids (both were generous gifts from Rick Horwitz, University of Virginia) with Lipofectamine 2000 (Life Technologies, Rockville, MD) following the manufacturer’s protocol. Transfected cells were then transferred to the nanostructured surfaces and incubated for 1–2 hours at 37°C in 5% CO2 before conducting imaging experiments.
Fabrication of Nanostructures
Nanostructures were fabricated on thin films of poly(methyl methacrylate) (PMMA) on glass coverslips (#1.5, 22 x 22 mm) that were pretreated with UV-ozone for 5 minutes and then coated with 3-aminopropyltriethoxysilane (APTES) in deionized water (1 volume %) to facilitate PMMA adhesion to the glass. PMMA (M.W. = 120 kDa, Sigma-Aldrich, Milwaukee, WI) was dissolved in toluene (5 weight %) and spin-coated on glass coverslips at 600 rpm for 45 seconds. Films were heated on a hot plate at 100°C for 5 minutes to remove residual solvent. Nanostructures were fabricated by nanoimprint lithography following protocols previously described.15 Nanoimprinted structures included one line pattern, designated as “L860” (periodicity = 860 nm, depth = 200 nm, duty cycle = 50%) as a reference, and four types of pillars, designated as “P700,” “P600,” “P300,” and “P200,” shown in order of decreasing periodicity. Nanostructures were characterized by scanning electron microscopy (SEM) (FEI Quanta 3D, 5 kV) and atomic force microscopy (NT-MDT Integra).
Sample Preparation
Custom-made sample dishes were prepared for experiments. A 15-mm cork borer was heated over an open flame to 100°C and then immediately pressed into the center of a 35-mm culture dish (Corning, Midland, MI). The edges of the hole were sanded down until smooth. The nanostructured PMMA-on-glass coverslips were mounted to the bottom of the dishes with clear silicone adhesive (Corning, Midland, MI) so that the nanostructured region was placed in the center of the opening. The mounted samples were dried overnight before use. At the time of cell culture, the samples were UV-sterilized for 5 minutes. Nanostructured surfaces were coated with 1 μg/mL of fibronectin (Sigma-Aldrich, St. Louis, MO) for 1 hour at 37°C before cell seeding.
Imaging
A Zeiss LSM 710 Axio-Observer inverted microscope was used for migration experiments and the paxillin aggregation measurements for flat, L860, P700, P600 and P300 surfaces. Time-lapse imaging migration experiments were performed using an EC Plan-Neofluar 20X/0.5 M27 air objective with the Zeiss LSM 710. Images are 512 by 512 pixels at 8-bit depth. The pixel dwell time was set to 1.58 μs with one-minute intervals for 12 hours using the transmission pathway. Cells were kept under incubation at 37 °C and 5% CO2 for the entire duration of the experiment.
For aggregation experiments, cells were imaged using a C-Apochromat 40X/1.2NA Korr M27 water immersion objective. Cells were excited with a 488-nm argon laser. An excitation dichroic was used to send the laser beam to the sample. The emission pathway consisted of a diffraction grating to disperse the emitted light and two prisms were used to select the emission band for each photomultiplier tube (PMT). 500–550nm was used to collect the EGFP signal. Image acquisition was performed with a 12.5 μs per pixel dwell time as a continuous time series of 100 frames (size = 256x256 pixels). Images were taken at 12-bit depth. Cells were kept under incubation chamber set to 37 °C and 5% CO2 while imaging.
Paxillin aggregation for cells on P200 was measured using the Olympus FluoView FV1000 and a 60X/1.2 NA water immersion objective (Olympus, PA). Cells were excited with a 488-nm argon laser. The emission was collected with a BA505–605 bandpass filter. Images (size = 256x256 pixels) were collected at 10 μs per pixel dwell time for 100 consecutive frames.
Cell Migration Analysis
Images collected for the migration experiments were analyzed using the Manual Tracking plugin in Fiji (ImageJ) software.44 The positions of the cells were tracked for each surface in each experiment by following the nucleus of the cells. Cells included in tracking were those present in the first time point so that all cells were exposed to the same initial condition. Tracking of the cells was cut off at 700 frames (approximately 12 hours) since this was the longest time that a majority of the cells remained in the imaging frame without dividing or undergoing apoptosis. Migration experiments were performed on three separate occasions per surface. The migration path of each cell was plotted in MATLAB using coordinates collected from Manual Tracking. The first coordinates of each path were set at the origin, and the remaining coordinates were adjusted using the first coordinates as the reference. The radius of trajectory was calculated by taking the distance between the last coordinates and the origin. The immobility of cells was determined by counting the number of zero velocities over the recorded migration period. The angle of each cell migration trajectory was measured using the SimFCS program, developed at the Laboratory for Fluorescence Dynamics (http://www.lfd.uci.edu), by determining the angle of the best-fit line of the each trajectory from 0 degrees. The distribution of angles for each surface pattern was displayed on angle histogram plots using Matlab.
Paxillin Aggregation Analysis
N&B analysis was performed to assess paxillin aggregation using the SimFCS program. Cells expressing paxillin-GFP were seeded on each fibronectin-coated surface with or without the nanostructures and incubated for 2 hours under specified culture conditions before imaging the adhesions. Imaging soon after cell attachment ensures that the cells are in an active state and accurate N&B measurements are captured. For the N&B analysis, images of adhesions of at least ten cells were de-trended using a moving Gaussian average. The molecular brightness of cells transfected with monomeric GFP was first assessed to obtain the brightness of paxillin monomers. This value was then used to calculate the brightness of paxillin dimers and higher order aggregates by multiplying by a factor of 2 for dimers, and 3 or greater for higher order aggregates. Details of the mathematics and analysis process have been previously described.29
A brief description of the N&B analysis is given here. 100 frames were collected over time so that each pixel in the image contains intensity fluctuations of the proteins as a function of time. The average intensity (first moment) of each pixel <k> were calculated along with its variance σ2 (second moment). The first and second moments were calculated with Equations 1 and 2, respectively, where K is the total number of frames collected, ki is the intensity of pixel i collected over time.
| (1) |
| (2) |
During the analysis, variance, a combination of the occupation number ( ) and additional contributions from the detector such as shot noise or count statistics ( ), were calculated. These two parameters are a function of the true molecular brightness, ε, and the average number of molecules illuminated within the focal volume, n, as shown in Equations 3–5.
| (3) |
| (4) |
| (5) |
The apparent brightness (B) for each pixel was defined as the ratio of the variance and average intensity. This was also used to calculate the apparent number of particles (N) as a fraction of the total intensity. Both Equations 6 and 7 below show the mathematical formula for B and N. By rewriting Equations 6 and 7, the values of n and ε were easily calculated, as shown in Equations 8 and 9.
| (6) |
| (7) |
| (8) |
| (9) |
For images with immobile fractions, the above expressions did not hold since there would not be any temporal fluctuations. Thus, the apparent molecular brightness would equal 1 (B=1). The ratio of these two terms was used to isolate the immobile fraction of cell images, denoted as B=σ2/<k>. If the pixel had immobile and mobile components, B would be between 1 and the value obtained from the mobile fraction.
Adhesion Size Measurement
The adhesions containing dimers and higher order aggregates are found by comparing the confocal images with the corresponding brightness map. The area of those adhesions was acquired using the freehand selection tool in ImageJ to trace the individual adhesions from the confocal microscopy images used in N&B analysis. The areas of these adhesions were determined using the ImageJ measure function.
Statistical Analysis
Statistical significance was determined for all migration and paxillin aggregation data using the Student’s t-test (two-sample, unequal variance) in Excel.
Supplementary Material
Insight, innovation, integration.
The integration of nanotopography to surfaces of medical implants has been of growing interest due to their ability to modulate cell adhesion and migration. Current methods used to characterize such cell behaviors lack the spatial and temporal capabilities to develop a clear understanding of the dynamics of adhesion and migration at the molecular level. Using fluorescence microscopy, nanofabrication, and the Numbers and Molecular Brightness image analysis, we collected real-time information of paxillin, a focal adhesion (FA) protein, in live cells on various nanostructured surfaces of different size and spacing. We found that nanotopography influences cell motility, adhesion size, and adhesion assembly and disassembly. These findings provide insight into choosing the optimal array of nanostructures to apply to medical implant surfaces to modulate cell adhesion.
Acknowledgments
The authors sincerely thank Dr. Enrico Gratton, Director of the Laboratory of Fluorescence Dynamics, for his advice for the cell migration data analysis; Susan C. Wu, M.S. for assistance with nanostructure fabrication; Tracie Tran, Naomi Thomson, David Li, Cecilia Kim, and Noel Navarro for assistance with data collection for migration and adhesion size; and Mary Nora Dickson and Andrew Trinh for their feedback.
This work was supported by the National Institutes of Health grant P41-RRO3155 and the Samueli Career Development Chair (M.A.D.). E.J.M. received fellowship support from the NSF BEST-IGERT grant DGE-1144901. E.I.L. and A.F.Y. were supported by the National Center for Research Resources and the National Center for Advancing Translational Sciences, National Institutes of Health, through Grant No. UL1 TR000153. The content is solely the responsibility of the authors and does not necessarily represent the official views of the NIH. The FEI Quanta 3D scanning electron microscope is funded in part by the National Science Foundation Center for Chemistry at the Space-Time Limit (CHE-082913). The Jenoptik nanoimprinter is funded in part by an NSF MRI grant.
Footnotes
Author Contributions
E.I.L. fabricated nanostructured surfaces for all experiments. E.J.M. conducted cell transfections for N&B experiments. Sample preparations for migration experiments were done by E.J.M. and E.I.L. E.I.L. and E.J.M. planned and conducted cell migration experiments. E.I.L. analyzed cell migration trajectories. E.J.M. conducted N&B analysis for aggregation experiments, provided images of adhesions, and calculated the total migration distance for migration experiments. E.I.L., E.J.M., A.F.Y., and M.A.D. contributed to interpretation for all data and manuscript preparation. E.I.L. and E.J.M. contributed equally to this work.
Conflict of Interest
The authors declare that no competing financial interest exists.
Supporting information is available: Time-lapse movies of cells on flat, L860, P700, P600, P300, and P200 surfaces with migration trajectory tracked.
References
- 1.Jeon H, Koo S, Reese WM, Loskill P, Grigoropoulos CP, Healy KE. Nat Mater. 2015 doi: 10.1038/nmat4342. [DOI] [PMC free article] [PubMed] [Google Scholar]
- 2.Anselme K, Davidson P, Popa aM, Giazzon M, Liley M, Ploux L. Acta Biomater. 2010;6:3824–46. doi: 10.1016/j.actbio.2010.04.001. [DOI] [PubMed] [Google Scholar]
- 3.Teixeira AI, Abrams Ga, Bertics PJ, Murphy CJ, Nealey PF. J Cell Sci. 2003;116:1881–92. doi: 10.1242/jcs.00383. [DOI] [PMC free article] [PubMed] [Google Scholar]
- 4.Bettinger CJ, Langer R, Borenstein JT. Angew Chem Int Ed Engl. 2009;48:5406–15. doi: 10.1002/anie.200805179. [DOI] [PMC free article] [PubMed] [Google Scholar]
- 5.Chen CS, Mrksich M, Huang S, Whitesides GM, Ingber DE. Science (80-) 1997;276:1425–1428. doi: 10.1126/science.276.5317.1425. [DOI] [PubMed] [Google Scholar]
- 6.Alom Ruiz S, Chen CS. Soft Matter. 2007;3:168. doi: 10.1039/b613349e. [DOI] [PubMed] [Google Scholar]
- 7.von Philipsborn AC, Lang S, Bernard A, Loeschinger J, David C, Lehnert D, Bastmeyer M, Bonhoeffer F. Nat Protoc. 2006;1:1322–1328. doi: 10.1038/nprot.2006.251. [DOI] [PubMed] [Google Scholar]
- 8.Chien FC, Kuo CW, Yang ZH, Chueh DY, Chen P. Small. 2011;7:2906–13. doi: 10.1002/smll.201100753. [DOI] [PubMed] [Google Scholar]
- 9.Sriraghavan V, Desai Ra, Kwon Y, Mrksich M, Chen CS. Langmuir. 2010;26:17733–17738. doi: 10.1021/la102955m. [DOI] [PubMed] [Google Scholar]
- 10.Kim DH, Wirtz D. FASEB J. 2013;27:1351–1361. doi: 10.1096/fj.12-220160. [DOI] [PMC free article] [PubMed] [Google Scholar]
- 11.Petit V, Thiery JP. Biol Cell. 2000;92:477–94. doi: 10.1016/s0248-4900(00)01101-1. [DOI] [PubMed] [Google Scholar]
- 12.Kanchanawong P, Shtengel G, Pasapera AM, Ramko EB, Davidson MW, Hess HF, Waterman CM. Nature. 2010;468:580–4. doi: 10.1038/nature09621. [DOI] [PMC free article] [PubMed] [Google Scholar]
- 13.Kong YP, Tu CH, Donovan PJ, Yee AF. Acta Biomater. 2013;9:6369–80. doi: 10.1016/j.actbio.2013.01.036. [DOI] [PubMed] [Google Scholar]
- 14.Nguyen AT, Sathe SR, Yim EKF. J Phys Condens Matter. 2016;28:1–16. doi: 10.1088/0953-8984/28/18/183001. [DOI] [PubMed] [Google Scholar]
- 15.Dickson MN, Liang EI, Rodriguez La, Vollereaux N, Yee AF. Biointerphases. 2015;10:21010. doi: 10.1116/1.4922157. [DOI] [PMC free article] [PubMed] [Google Scholar]
- 16.Zhang G, Zhang J, Xie G, Liu Z, Shao H. Small. 2006;2:1440–1443. doi: 10.1002/smll.200600255. [DOI] [PubMed] [Google Scholar]
- 17.Ferrari A, Cecchini M, Degl Innocenti R, Beltram F. IEEE Trans Biomed Eng. 2009;56:2692–2696. doi: 10.1109/TBME.2009.2027424. [DOI] [PubMed] [Google Scholar]
- 18.Shi L, Li JR, Shih YP, Lo SH, Liu G. Nano Res. 2012;5:565–575. [Google Scholar]
- 19.Yim EKF, Pang SW, Leong KW. Exp Cell Res. 2007;313:1820–1829. doi: 10.1016/j.yexcr.2007.02.031. [DOI] [PMC free article] [PubMed] [Google Scholar]
- 20.Kulangara K, Leong KW. Soft Matter. 2009;5:4072. doi: 10.1039/B921206J. [DOI] [PMC free article] [PubMed] [Google Scholar]
- 21.Yim EKF, Darling EM, Kulangara K, Guilak F, Leong KW. Biomaterials. 2010;31:1299–306. doi: 10.1016/j.biomaterials.2009.10.037. [DOI] [PMC free article] [PubMed] [Google Scholar]
- 22.Coyer SR, Singh A, Dumbauld DW, Calderwood Da, Craig SW, Delamarche E, García AJ. J Cell Sci. 2012;125:5110–23. doi: 10.1242/jcs.108035. [DOI] [PMC free article] [PubMed] [Google Scholar]
- 23.Cavalcanti-Adam EA, Volberg T, Micoulet A, Kessler H, Geiger B, Spatz JP. Biophys J. 2007;92:2964–74. doi: 10.1529/biophysj.106.089730. [DOI] [PMC free article] [PubMed] [Google Scholar]
- 24.Lauffenburger DA, Horwitz AF. Cell. 1996;84:359–369. doi: 10.1016/s0092-8674(00)81280-5. [DOI] [PubMed] [Google Scholar]
- 25.Berland KM, So PT, Gratton E. Biophys J. 1995;68:694–701. doi: 10.1016/S0006-3495(95)80230-4. [DOI] [PMC free article] [PubMed] [Google Scholar]
- 26.Müller JD, Chen Y, Gratton E. Biophys J. 2000;78:474–486. doi: 10.1016/S0006-3495(00)76610-0. [DOI] [PMC free article] [PubMed] [Google Scholar]
- 27.Hillesheim LN, Müller JD. Biophys J. 2003;85:1948–1958. doi: 10.1016/S0006-3495(03)74622-0. [DOI] [PMC free article] [PubMed] [Google Scholar]
- 28.Digman MA, Brown CM, Horwitz AR, Mantulin WW, Gratton E. Biophys J. 2008;94:2819–31. doi: 10.1529/biophysj.107.104984. [DOI] [PMC free article] [PubMed] [Google Scholar]
- 29.Digman MA, Dalal R, Horwitz AF, Gratton E. Biophys J. 2008;94:2320–32. doi: 10.1529/biophysj.107.114645. [DOI] [PMC free article] [PubMed] [Google Scholar]
- 30.Rashidi H, Yang J, Shakeshe KM. Biomater Sci. 2014;2:1318–1331. doi: 10.1039/c3bm60330j. [DOI] [PubMed] [Google Scholar]
- 31.Kulangara K, Yang Y, Yang J, Leong KW. Biomaterials. 2012;33:4998–5003. doi: 10.1016/j.biomaterials.2012.03.053. [DOI] [PMC free article] [PubMed] [Google Scholar]
- 32.Tang QY, Qian WX, Xu YH, Gopalakrishnan S, Wang JQ, Lam YW, Pang SW. J Biomed Mater Res Part A. 2014;103A:2383–2393. doi: 10.1002/jbm.a.35378. [DOI] [PubMed] [Google Scholar]
- 33.Przybilla F, Genet C, Ebbesen TW. Opt Express. 2012;20:4697. doi: 10.1364/OE.20.004697. [DOI] [PubMed] [Google Scholar]
- 34.Yim EKF, Reano RM, Pang SW, Yee AF, Chen CS, Leong KW. Biomaterials. 2005;26:5405–13. doi: 10.1016/j.biomaterials.2005.01.058. [DOI] [PMC free article] [PubMed] [Google Scholar]
- 35.Pot SA, Liliensiek SJ, Myrna KE, Bentley E, Jester JV, Nealey PF, Murphy CJ. Investig Opthalmology Vis Sci. 2010;51:1373. doi: 10.1167/iovs.09-4074. [DOI] [PMC free article] [PubMed] [Google Scholar]
- 36.Li JR, Shi L, Deng Z, Lo SH, Liu G. Biochemistry. 2012;51:5876–93. doi: 10.1021/bi200880p. [DOI] [PMC free article] [PubMed] [Google Scholar]
- 37.Huang J, Gräter SV, Corbellini F, Rinck S, Bock E, Kemkemer R, Kessler H, Ding J, Spatz JP. Nano Lett. 2009;9:1111–1116. doi: 10.1021/nl803548b. [DOI] [PMC free article] [PubMed] [Google Scholar]
- 38.Coussen F, Choquet D, Sheetz MP, Erickson HP. J Cell Sci. 2002;115:2581–2590. doi: 10.1242/jcs.115.12.2581. [DOI] [PubMed] [Google Scholar]
- 39.Digman MA, Wiseman PW, Choi C, Horwitz AR, Gratton E. Proc Natl Acad Sci U S A. 2009;106:2170–5. doi: 10.1073/pnas.0806036106. [DOI] [PMC free article] [PubMed] [Google Scholar]
- 40.Digman MA, Wiseman PW, Horwitz AR, Gratton E. Biophys J. 2009;96:707–716. doi: 10.1016/j.bpj.2008.09.051. [DOI] [PMC free article] [PubMed] [Google Scholar]
- 41.Digman MA, Gratton E. Microsc Res Tech. 2009;72:323–332. doi: 10.1002/jemt.20655. [DOI] [PMC free article] [PubMed] [Google Scholar]
- 42.Bate N, Gingras AR, Bachir A, Horwitz R, Ye F, Patel B, Goult BT, Critchley DR. PLoS One. 2012;7 doi: 10.1371/journal.pone.0034461. [DOI] [PMC free article] [PubMed] [Google Scholar]
- 43.Gardel ML, Schneider IC, Aratyn-Schaus Y, Waterman CM. Annu Rev Cell Dev Biol. 2010;26:315–33. doi: 10.1146/annurev.cellbio.011209.122036. [DOI] [PMC free article] [PubMed] [Google Scholar]
- 44.Schindelin J, Arganda-Carreras I, Frise E, Kaynig V, Longair M, Pietzsch T, Preibisch S, Rueden C, Saalfeld S, Schmid B, Tinevez JY, White DJ, Hartenstein V, Eliceiri K, Tomancak P, Cardona A. Nat Methods. 2012;9:676–682. doi: 10.1038/nmeth.2019. [DOI] [PMC free article] [PubMed] [Google Scholar]
Associated Data
This section collects any data citations, data availability statements, or supplementary materials included in this article.