

Abstract
This paper uses Census and child welfare report data from Missouri (1999, 2000 & 2001) to determine if Whites and Blacks are reported for child maltreatment at similar or different rates while controlling for poverty and racial homogeneity. We do not find evidence for high levels of racial disproportionality once poverty is controlled. Poverty is generally associated with higher rates of reporting for both races. We found some evidence of differential sensitivity, with the relationship between poverty and report rate being somewhat stronger for Whites than for Blacks.
1. Introduction
There has been a great deal of recent concern about the high numbers of children of color, particularly Black children, in the child welfare system (Ards, Myers, Chung, Malkis, & Hagerty, 2003; Chibnall et al., 2003; Fluke, Yuan, Hedderson, & Curtis, 2003). This issue is sometimes termed “disproportionality”, reflecting the higher rate of minoritiesamong reported children as compared to their representation in the general population (Ards et al., 2003). The purpose of this paper is to assess Black/White disproportionality from an ecological perspective with a full population (statewide) sample. The scope of this paper is expressly restricted to accepted reports. We present no data regarding subsets of accepted reports, such as substantiated cases or cases accepted into foster care. We feel this restriction in scope is necessary to avoid conflating the issues of reporting and systemic response to those reports. Given the racial composition of the state of Missouri, we were unable to assess racial reporting dynamics among Hispanic, Asian, Native American or other populations, as there are insufficient numbers of these groups to support the methods employed.
1.1. Background
The primary complicating factor in understanding racial differences in child maltreatment reporting is poverty. In 2003, 33.6% of African American children in the United States lived below the poverty level, while 9.3% of White children were below the poverty level (U.S. Census Bureau, 2004). Many studies have documented a strong relationship between poverty and report rates. For a recent review of work in this area at the ecological level, see Freisthler, Merritt, and LaScala (2006). The most recent work has included racial disaggregation, and has included multiple indicators of neighborhood economic stress, simultaneously considering such factors as alcohol outlets, residential density, unemployment, vacant housing units, ratio of adults to children, etc…(Freisthler, Bruce, & Needell, 2007; Freisthler, Gruenewald, Remer, Lery, & Needell, 2007). Some recent work suggests that the effect of poverty may be stronger for Whites than for Blacks (Korbin, Coulton, Chard, Platt-Houston, & Su, 2007).
Individual-level studies have also addressed this issue. Perhaps most visibly, the National Incidence Studies of Child Abuse and Neglect-3 (NIS-3) showed a strong relationship between low income and child maltreatment. For instance, children from families with annual incomes below $15,000 (1993 dollars) were more than twenty times more likely to experience certain kinds of maltreatment than children from families with annual incomes above $30,000 (Sedlak & Broadhurst, 1996a). The NIS-3 included data from two sources including cases reported to Child Protective Services (CPS) and accepted for investigation. These data are similar to our study data. In addition, the NIS-3 includes data garnered from community sentinels, a source not reflected in our data. The NIS data do not show evidence of direct racial bias, but have been questioned by some researchers, partly around the issue of possible aggregation bias (Ards, Chung, & Myers, 1998). While national data featuring racial disaggregation is available at the level of children who have been judged to be “victims” (substantiated, indicated or alternative response children — DHHS, 2005, Tables 3–10, 3–14) report-level data (screened-in cases) are not racially disaggregated in current federal summaries (DHHS, 2005, Chapter 2).
1.2. Theories accounting for racial disproportionality
The issue of racial disproportionality in child welfare system involvement is one where theoretical explanations are plentiful. We will review several of these below.
1.2.1. Poverty
There is broad empirical and theoretical consensus in the scientific literature that poverty is associated with far higher rates of both actual and reported maltreatment (Bartholet, 1999; Berger, 2004; Chibnall et al., 2003; Courtney, Barth, Berrick, Brooks, Needell et al., 1996; Drake, Jonson-Reid, Way, & Chung, 2003; Drake & Zuravin, 1998; Pelton, 1978). The large overrepresentation of Black children among the poor provides one possible explanation for the disproportionality of Black children in child maltreatment reports. Studies have found a high concordance between individual and homogeneous neighborhood indicators of poverty, meaning that most low-income families also reside in similarly low-income areas (Krieger, 1992). Thus Black families may be more likely to experience other ecological risk factors that are associated with both low-income neighborhoods and maltreatment (Freisthler, Gruenewald, et al., 2007).
1.2.2. Aggregation bias
Some authors (Ards et al., 2003) suggest that disproportionality may be due to the fact that “Whites' underexposure to the welfare system shields the group from the scrutiny that comes from high reporting and substantiations and thus leaves the overall White representation below the Black representation in official statistics” (Ards et al., 2003, p.119). These authors use the term “aggregation bias” to represent a dynamic where Blacks appear to be reported at higher rates than Whites, but this higher rate of reporting is a function of the aggregation of Blacks in poverty, and their subsequent increased visibility. There has been a somewhat separate discussion of so-called “visibility bias”, which we present next.
1.2.3. Visibility bias
Researchers have not yet simultaneously and definitively disentangled effects of poverty, potential visibility bias and potential racial bias in the empirical literature (Ards et al., 2003; Drake & Zuravin, 1998). Also termed “exposure bias”, visibility bias is the idea that some groups may be more visible to reporters and thus may be more likely to be reported. One system which is frequently identified as a possible conduit for such identification is the income maintenance system (i.e., Temporary Assistance for Needy Families), the idea being that people on welfare have more eyes on them and thus are more likely to be reported. To our knowledge, no data supporting the presence of substantial visibility bias with regard to race exist. Reviews of the empirical literature have addressed the issue of visibility bias associated with class (Drake & Zuravin, 1998; Pelton, 1978) and have concluded that no strong evidence for visibility bias based on class exists. Fortunately, the visibility bias hypothesis is readily testable. If visibility causes a group (e.g. poor Blacks) to be more likely to be reported by the system (professional and/or mandated reporters), then such groups should show very high proportions of their reports being from mandated sources (see Drake & Jonson-Reid, 2007 for review of national policy and available data on mandated reporting).
1.2.4. Straightforward racism
One possibility is that reporters are biased against (more likely to report) people based purely on their race (Chibnall et al., 2003; Morton, 1999; Roberts, 2002). The small literature on this subject has been described as inconsistent (Hines, Lemon, Wyatt, & Merdinger, 2004). In their review of NIS-3 data, Ards et al. (2003) find that direct “racial bias in reporting does not appear to be at the root of racial disparities in observed maltreatment” (p.116). Turbett and O'Toole (1980) showed physicians vignettes and found some statistically significant (but low magnitude) increased likelihood that Blacks would be reported compared to Whites. Zellman (1992), using similar methods, failed to find such an association. More recently, Chibnall et al. (2003) interviewed child welfare workers across several states, asking their views as to why minorities are disproportionately found in the child welfare system. While poverty was the most frequently cited reason given, some participants felt that differential reporting of Blacks and Whites may exist. As a concrete example, one respondent suggested that hospitals might differentially target Black women for drug testing when they give birth, resulting in a higher number of Black women testing positive as compared to White women, and hence, higher report rates. In a rare quantitative exploration of this same issue, Chasnoff Landress, and Barrett (1990) failed to find that Black women were drug tested disproportionately, but did find that once positive toxin screens were noted, Black women were more likely to be reported to CPS.
1.2.5. Being out of place
McDaniel and Slack (2005) recently tested the hypothesis that the visibility of Blacks might be higher in those communities in which few Blacks live. This hypothesis was based on prior findings (Garland, Ellis-MacLeod, Landsverk, Ganger, & Johnson 1998; Jenkins & Diamond, 1985) suggesting that Blacks living in neighborhoods in which they comprise a local minority are more likely to have children placed in foster care. McDaniel and Slack (2005) were unable to find such an association in their study, but believe that “this may be due to our predominantly low-income sample and the small number of Black families with few African American neighbors” (p. 189). This has been identified as an area requiring further research (Hines et al., 2004).
1.2.6. Differential sensitivity to poverty
While not an established theoretical position per se, a newly emerging empirical finding is that among the very poor, Whites may be more likely to be reported than Blacks. Among wealthier individuals, the opposite may be true. One straightforward example of this effect can be found in the work of Ards et al. (2003). This study used NIS-3 data and found that among those receiving welfare, Blacks were only 83.7% as likely to be reported as Whites, but that among non-welfare cases, Blacks report rates were 125.2% of the White level. McDaniel and Slack (2005) found that Blacks were less than half as likely as other races to be reported in their poor (TANF-based) sample, although this relatively large effect failed to reach statistical significance (p=0.155). A plausible theoretical explanation for this can be found in the idea of differential assortment, which we propose in the discussion section.
1.3. Study hypotheses
Our review of the literature suggests the following hypotheses:
Overreporting of Blacks, no control for poverty: Blacks will be reported at a higher rate than Whites when poverty is not controlled. This hypothesis lays the groundwork for those that follow, and simply verifies that the consistently found overrepresentation of Blacks (e.g. DHHS, 2005) exists in our data. A null finding here would falsify all above theoretical positions relative to our data.
Overreporting of Blacks, with poverty stratification: Blacks and Whites will be reported at different rates when poverty is stratified. Note—the literature (Ards et al., 2003; Drake & Pandey, 1996; Sedlak & Broadhurst, 1996a) suggests that no large difference will be found here. This hypothesis is phrased positively because hypotheses must posit differences, not similarities (Drake & Jonson-Reid, 2008). The theoretical basis and implications of this hypothesis are as follows: Large differences persisting once poverty is controlled for would support the argument that reporting is driven by straightforward racism, and would stand somewhat against those theories stressing the primacy of poverty, or aggregation bias.
Differential Sensitivity (a): Whites in high poverty strata will be reported at higher rates than Blacks in high poverty strata (Ards et al., 2003; McDaniel & Slack, 2005). This hypothesis, and the next, are direct tests of differential sensitivity theory.
Differential Sensitivity (b): Whites in low poverty strata will be reported at lower rates than Blacks in low poverty strata (Ards et al., 2003).
Being “out of place”: Both Blacks and Whites will be reported at higher rates when they are in a numerical minority (McDaniel & Slack, 2005). This is a test of the theory that “being out of place” causes increased reporting. This may be seen by some as related to visibility bias.
Visibility: The percentage of all reports from mandated reporters will be much higher in high poverty strata (Ards et al., 2003). Given the presence of higher levels of TANF receipt in high poverty neighborhoods, higher use of free clinics, food banks and other public services, we can test to see if higher visibility to mandated reporters among residents of these communities manifests in higher proportions of reports from mandated reporters among residents of these communities. This is a fairly direct test of the theory of visibility bias.
2. Methodology
Data for this study include U.S. Census data (2000 Decennial Census, Summary File 3) and all accepted (not screened-out) child maltreatment reports from the Missouri Child Abuse and Neglect database from 1/1/1999 through 12/31/2001. Child welfare system cases can be characterized at several levels. One characterization is the “screened-in” or “accepted” report, which is what we use. These are reports which fit agency criteria, and for which an investigation or assessment is initiated. In Missouri, 80% of all received reports are of this type. We are interested in studying the reporting system, and thus do not include screened-out reports (which do not make it through the screen). Such screened-out reports often include cases that lack sufficient information (including location). The following are typical reasons that a call would not receive some sort of investigation or assessment in Missouri:
the child is 18 or older and not in Children's Division custody;
the child/family cannot be located because of insufficient information;
all subjects given in the call reside and are located out of state and the reporter is not a Missouri mandated reporter; or
there is no child abuse/neglect allegation (Children's Division, 2006).
While we exclude “screened-out” cases we purposively include unsubstantiated cases. Substantiated cases are only a small subset of acted-on reports (i.e., many states do not restrict services to such cases) and there is a significant literature suggesting that there are few practical differences in terms of risk of recurrence and downstream outcomes among the children (Drake & Jonson-Reid, 2007; Hussey et al., 2005). By considering all screened-in cases we avoid conflating potentially different forms of bias as a case moves from a report to a substantiation or service decision.
Year 2000 Census data was used to determine the percentage of Black and White children (living with relatives) who were in poverty (PCT76A and PCT76B) in each tract. The smaller size of tracts, compared to Zipcodes or counties, should provide greater homogeneity within geographic units (Openshaw, 1984). The unit of analysis for this study is the state (Table 1) or the stratum (Tables 2–3). Tracts are not the unit of analysis, but are used to define local areas within which we assess rates of poverty and place geocoded maltreated children. Based on poverty levels, these tracts are then aggregated into one of five strata. Originally, nine strata were used, but similarities in trends between adjacent strata allowed for a five-level stratification system which shows the same effects, maintains larger strata sizes and simplifies data presentation. This step was essential in the case of “Minority White” counts, which, while theoretically interesting, became unac-ceptably small when parsed into nine separate strata. Rates calculated for each stratum therefore reflect the combined child population for all tracts in that stratum and the combined maltreatment reports for all tracts within that stratum.
Table 1. Statewide reports by race.
| Total child population (2000) | Unduplicated children reported (99–01) | Unduplicated reports (99–01) per 1000 children per yeara | |
|---|---|---|---|
| Blacks | 196,217 | 33,500 | 56.91 |
| Whites | 1,121,264 | 89,662 | 26.66 |
Determined by taking all children reported at least once during 1999–2001, dividing by 3, dividing by the child population, then multiplying by 1000.
Table 2. Reported Black children in detail.
| Percentage of Black children in poverty in tract | |||||
|---|---|---|---|---|---|
|
| |||||
| 00–05% | 05–15% | 15–25% | 25–40% | 40%+ | |
| Full Black sample: All Blacks (not broken down by racial homogeneity) | |||||
| Number of tracts in strata | 393 | 51 | 82 | 145 | 265 |
| Number of children in strata | 16,575 | 18,532 | 27,473 | 60,166 | 73,471 |
| Report rate/1000 children/year | 41.3 | 34.3 | 46.1 | 54.3 | 70.4 |
| % Mandated reps. | 56.5% | 56.1% | 54.9% | 50.6% | 48.2% |
| % Neglect only | 45.2% | 43.3% | 48.2% | 49.0% | 52.8% |
| Majority Black: Black children in tracts where Blacks outnumber Whites by at least 2:1 | |||||
| Number of tracts in strata | 5 | 5 | 14 | 47 | 63 |
| Number of children in strata | 1899 | 4591 | 13,486 | 42,230 | 46,732 |
| Report rate/1000 children/year | 33.3 | 29.6 | 46 | 55.3 | 72.7 |
| % Mandated reps. | 61.6% | 47.8% | 54.3% | 50.0% | 46.6% |
| % Neglect only | 34.2% | 41.9% | 49.2% | 48.0% | 52.6% |
| Homogeneous: Black children in tracts where neither race outnumbers the other by 2:1 | |||||
| Number of tracts in strata | 16 | 21 | 20 | 26 | 50 |
| Number of children in strata | 4242 | 10,997 | 10,014 | 10,223 | 18,749 |
| Report rate/1000 children/year | 28.1 | 34 | 46.9 | 51.7 | 66.7 |
| % Mandated reps. | 58.9% | 56.6% | 53.9% | 51.3% | 51.4% |
| % Neglect only | 41.3% | 41.4% | 48.8% | 51.6% | 52.4% |
| Minority Black: Black children in tracts where Whites outnumber Blacks by at least 2:1 | |||||
| Number of tracts in strata | 372 | 25 | 48 | 72 | 152 |
| Number of children in strata | 10,434 | 2944 | 3973 | 7713 | 7990 |
| Report rate/1000 children/year | 48.1 | 42.7 | 44.3 | 52.4 | 65 |
| % Mandated reps. | 55.3% | 63.2% | 59.7% | 52.7% | 51.5% |
| % Neglect only | 47.4% | 50.5% | 42.9% | 51.4% | 55.2% |
Table 3. Reported White children in detail.
| Percentage of White children in poverty in tract | |||||
|---|---|---|---|---|---|
|
| |||||
| 00–05% | 05–15% | 15–25% | 25–40% | 40%+ | |
| Full White sample: All Whites (not broken down by racial homogeneity) | |||||
| Number of tracts in strata | 383 | 411 | 285 | 130 | 44 |
| Number of children in strata | 356,778 | 410,263 | 248,396 | 95,799 | 10,388 |
| Report rate/1000 children/year | 13.5 | 26 | 36.1 | 46 | 85.2 |
| % Mandated reps. | 53.3% | 48.3% | 46.9% | 45.4% | 46.4% |
| % Neglect only | 46.0% | 51.9% | 53.9% | 55.2% | 55.0% |
| Majority White: White children in tracts where Whites outnumber Blacks by at least 2:1 | |||||
| Number of tracts in strata | 295 | 373 | 250 | 107 | 11 |
| Number of children in strata | 334,317 | 393,365 | 236,384 | 87,978 | 5768 |
| Report rate/1000 children/year | 12.7 | 25.5 | 35.2 | 44.4 | 84.1 |
| % Mandated reps. | 53.6% | 48.4% | 47.0% | 45.6% | 43.8% |
| % Neglect only | 46.2% | 51.9% | 54.1% | 54.9% | 52.3% |
| Homogeneous: White children in tracts where neither race outnumbers the other by 2:1 | |||||
| Number of tracts in strata | 42 | 30 | 30 | 16 | 15 |
| Number of children in strata | 18,885 | 15,310 | 11,580 | 6964 | 3495 |
| Report rate/1000 children/year | 19.5 | 35.7 | 53.7 | 57.5 | 79 |
| % Mandated reps. | 50.0% | 48.4% | 44.1% | 44.0% | 49.9% |
| % Neglect only | 44.4% | 51.2% | 52.2% | 55.7% | 52.0% |
| Minority White: White children in tracts where Blacks outnumber Whites by at least 2:1 | |||||
| Number of tracts in strata | 46 | 8 | 5 | 7 | 18 |
| Number of children in strata | 3576 | 1588 | 432 | 857 | 1125 |
| Report rate/1000 children/year | 59.8 | 48.9 | 60.9 | 113.9 | 110.5 |
| % Mandated reps. | 52.3% | 46.4% | 72.2% | 45.4% | 48.8% |
| % Neglect only | 46.0% | 56.2% | 24.1% | 62.5% | 58.2% |
Data were then disaggregated across three categorical dimensions: Race (Black/White), percentage of children of each race (0.00%–4.99%, 5.00% –14.99%, 15.00% –24.99%, 25.00% –39.99% or 40% and over) below poverty level in their tract, and racial homogeneity of children in the tract, including Black majority/White minority (Blacks outnumber Whites by 2:1 or more), Homogeneity (neither Blacks nor Whites outnumber the other by 2:1 or more) or Black Minority/White Majority (Whites outnumber Blacks by 2:1 or more). The 2:1 ratio was chosen in that it was sufficiently low to prevent unacceptably restrictive cell sizes in the majority/minority tracts and because it was sufficiently high to support face validity. It is also consistent with prior research (Jargowsky, 1997). The specific poverty rate cut-offs for strata were established to create as many strata as possible while maintaining adequate cell sizes for both Blacks and Whites. This was particularly a problem when considering Whites as minorities in their tracts (see Table 3). Our upper (40%) cutoff is commonly used in poverty research, allowing comparison to other studies. For each nexus of these three dimensions, report rates per 1000 children are listed, as well as the percentage of reports from mandated reporters and the percentage of all reports which included neglect allegations alone (as opposed to sexual, physical, emotional, other or mixed allegations). Mandated reporter status was derived from the reporter subfiles, which specify the professional role (e.g. “Law Enforcement”) of the reporting party.
Child maltreatment reports included all screened-in reports, and were unduplicated, with only the first report on any given child during the 1999–2001 period being retained. Each report was geocoded and placed within a specific census tract. There were 139,380 Black and White children with unduplicated reports reported in Missouri during the 1999–2001 timeframe. Of these, we were able to geocode 123,162 (88.36%) within Missouri using ArcMap software (see Table 1). Geocoded cases were compared to the full sample to check for differences. Non-geocoded cases were similar with regard to sex (50.34% female for geocoded cases, 50.26% female for all cases) mandated reporter source (48.90% mandated for geocoded cases, 48.34% mandated for all cases) type of report (51.53% neglect alone for geocoded cases, 51.09% neglect alone for all cases) and age (mean age 7.82 years for both groups). Differences did occur in our ability to geocode based on urban vs. rural status. While our overall geocoding rate was 88.36%, our geocoding rate in the main urban areas (St. Louis City, St. Louis County and Jackson County (Kansas City)) was 96.61%. St. Louis City and County are mentioned separately because the city of St. Louis is not a part of St. Louis County. St. Louis was declared a separate “independent city” in 1876. The difficulties geocoding in rural areas are largely due to the large number of ambiguous addresses found there. As a result of our better ability to geocode in urban areas we were able to geocode a higher proportion of Blacks (27.20% of geocoded cases, 25.08% of all cases) as compared to Whites. We checked to see if this racial difference was simply a result of location, and such appears to be the case. In the most urban counties (St Louis City, County, and Jackson Counties) our geocoding rates for Blacks (97.24%) and Whites (95.65%) were both reasonably high. The slightly higher geocoding rates for Blacks could be due to their increased concentration in the more heavily urbanized portions of these counties. Our final dataset included 89,662 White children and 33,500 Black children.
Questions regarding reporting are primarily of interest because accepted reports serve as the first point of contact for children who may eventually become involved with the CPS system. Widening criteria to include reports which are not accepted, or narrowing criteria to include only reports that result in a given level of finding (e.g. substantiation) would not accurately reflect who comes into contact with CPS. Our calculated rate of child maltreatment is ((# of screened-in children reported at least once during 1999 through 2001/tract same-race under-18 years of age population)/3) and can be interpreted as “the mean rate of screened-in unduplicated children of that race reported per tract per year during the 1999–2001 period, per 1000 children of that race”. We were additionally able to separately calculate totals by type of maltreatment (Neglect Alone vs. Physical or Sexual or Emotional or Other or Mixed) alleged in the report. We chose this differentiation based partly on theoretical (Drake & Zuravin, 1998) grounds, with different subtypes of abuse having different theoretical connectivity to poverty (e.g. effects of poverty on maltreatment propensity may be mediated by stress in the case of physical abuse). There is also empirical precedent for the assumption that poverty may interact with type of maltreatment in influencing maltreatment rates (Drake & Pandey, 1996). We were also able to track the percentage of reports from mandated (professional) sources (Drake & Jonson-Reid, 2007). Unfortunately, it is not possible to understand the profession or relationship of the non-mandated reporters.
Tract poverty was calculated separately for Blacks and Whites. For example, a tract with 4% of the White population living in poverty would be included in the “0% to 5%” strata for the presentation of data on Whites, but if the same tract had 9% of Blacks living in poverty, that tract would be included in the “5.01% to 15%” category for the presentation of data on Blacks.
Inferential statistics are not used in this study because the sampling frame is at the population level (Drake & Jonson-Reid, 2008). We do not purport to infer dynamics at the population level, we simply report them. Furthermore, the purpose of this paper is to attempt to understand practically significant (as opposed to statistically significant) dynamics underlying the large observed disproportionality between Blacks and Whites in child abuse reports. We see little benefit from reporting chances of type I errors in such an obviously overpowered sample. In addition, Hypotheses 3, 4 and 5 suggest interactions and can best be explored through comparison of appropriate categorical groupings.
3. Results
Our final dataset included 89,662 White children and 33,500 Black children. This yields an average of 56.91 unduplicated Black children reported per thousand Black children per year during 1999–2001, as compared to a figure of 26.66 for Whites, a differential about 2:1. Hypothesis 1, the assertion that Blacks are overrepresented (without control for income), is supported.
3.1. Report rates
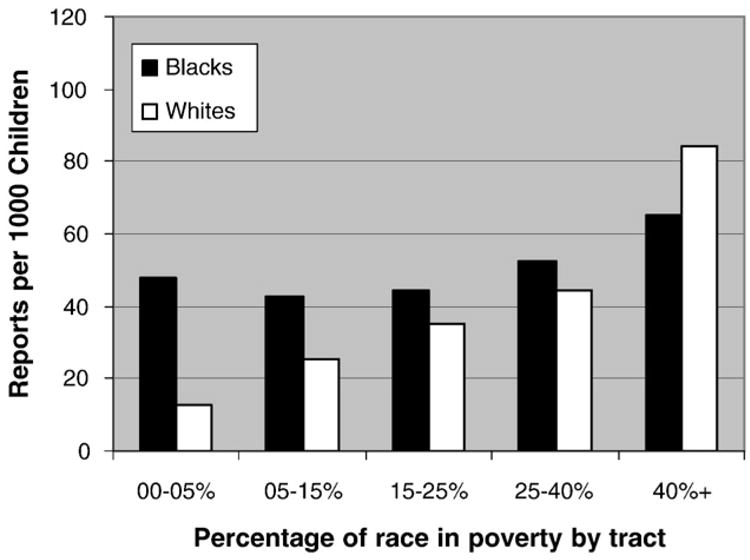
We now turn to a discussion of report rates as shown in Tables 2 and 3. We will structure our presentation of the data in accordance with Hypotheses 2–6. Data relating to Hypothesis 2, that Blacks and Whites are reported at different rates when income is controlled for can be gleaned from the top “Full Black Sample” row on Table 2 and the “Full White Sample” row on Table 3. These same data are presented visually in Fig. 1.
Fig. 1.
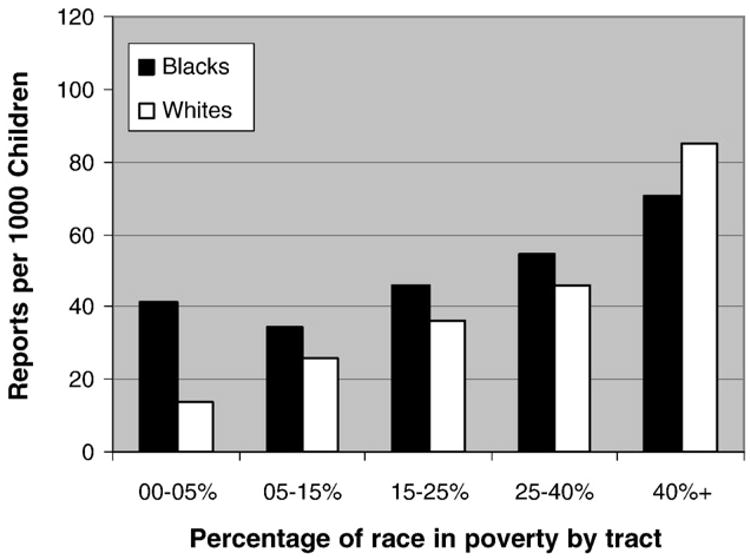
Race, poverty and report rates.
The data show that there may be differential effects of maltreatment reports related to poverty. At the lowest poverty levels (fewer than 5% Black or White children in poverty) Blacks are reported at a far higher rate (about 3 times more often) than Whites (41.3 vs. 13.5 reports per 1000 children). At intermediate levels (5%to 39.99%), Blacks appear to be some what more likely to be reported for maltreatment than Whites. At the highest levels of poverty (40% or more of Black or White children in the tract inpoverty) the situation reverses, with Whites being somewhat more at risk than Blacks (85.2 vs. 70.4). In the presence of such a strong interaction effect, characterization of the overreporting or underreporting of Blacks relative to Whites is dependent on the level of poverty in the tracts where children live. These same data provide limited support for Hypothesis 3 and strong support for Hypothesis 4, relating to differential sensitivity. With regard to Hypothesis 3, at the highest level of poverty (40%+ in poverty) Whites have slightly higher reporting rates than Blacks (85.2 vs. 70.4). At very low poverty levels (less than 5%), Blacks have much higher rates than Whites (41.3% vs. 13.5%).
The picture above becomes even more complicated, however, when we disaggregate the data by racial homogeneity. Figs. 2 and 3 provide separate data for Blacks and Whites disaggregated by racial homogeneity.
Fig. 2.
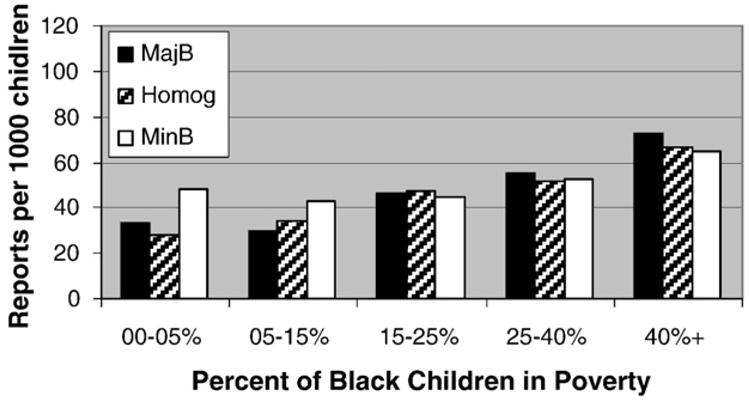
Black report rates by racial homogeneity.
Fig. 3.
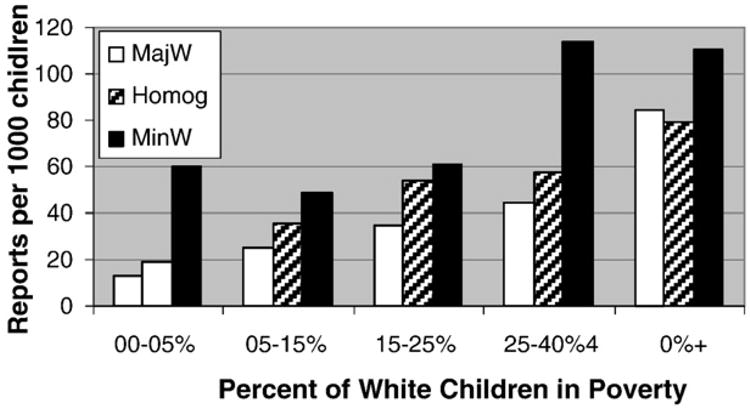
White report rates by racial homogeneity.
Among Blacks (Fig. 2), there is little apparent effect of tract homogeneity except at levels of low poverty. In tracts with fewer than 15% of Black children in poverty, minority Black tracts generate about half again as many reports as majority Black tracts. In terms of explaining racial disproportionality at the population level, however, this difference is more academic than practical, since only 17.89% of all Black children live in tracts with less than 15% poverty (see Table 2). While this effect may be locally important, it cannot account for the preponderance of the disproportionate representation of Blacks in child welfare reporting.
With respect to Whites (Fig. 3), we see a much stronger and more consistent association between report rates and racial homogeneity. Whites in Black majority areas always have higher report rates than Whites in White majority areas. While academically interesting, the practical importance of this dynamic in terms of total population dynamics is again very small. This is because 94.31% of all Whites in our sample live in White majority tracts (see Table 2). While any possible effects being studied may be important to those individuals involved, racial disparities due to the racial homogeneity of the neighborhood simply do not apply to sufficient people to explain large disproportionalities in report rates at the population level.
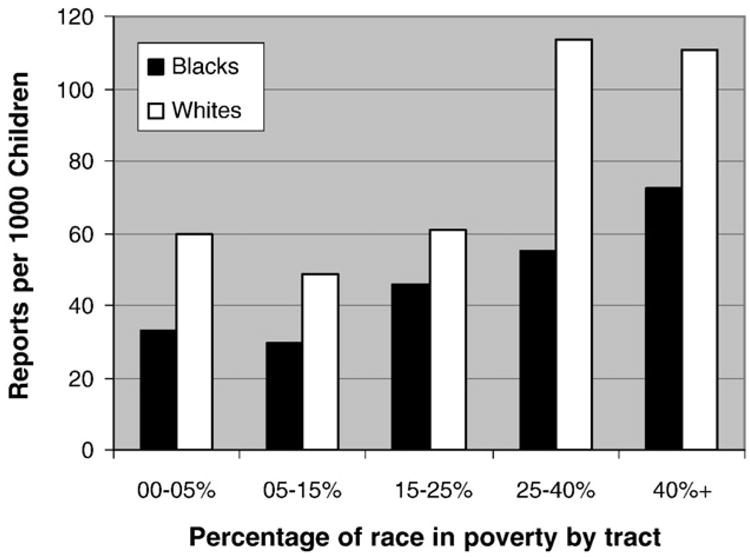
Figs. 4–6 present the same data as Figs. 3 and 4, but compare Blacks and Whites to each other directly. For racially homogenous tracts (see Fig. 4), we see relatively small differences between Black and White reporting rates at all levels except very for low poverty tracts (less than 5%), where Blacks are reported at about a 50% greater rate (28.1 vs. 19.5).
Fig. 4.
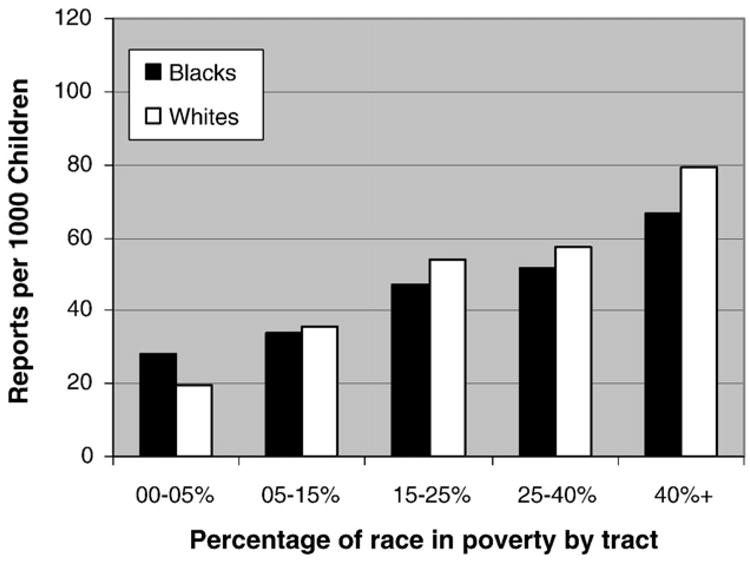
Report rates (homogenous tracts).
Fig. 6.
Report rates (White majority tracts).
For tracts where Blacks are in the majority, White are always represented at higher rates (see Fig. 5). In tracts where Whites are in the majority, we see an almost four-fold report rate for Blacks compared to Whites (48.1 vs. 12.7) in the least poor (b5%) stratum. This differential lessens consistently as poverty levels increase, with Whites being somewhat more likely than Blacks to be reported at the highest poverty stratum.
Fig. 5.
Report rates (Black majority tracts).
3.2. Mandated reporters
Hypothesis 6 suggests that high poverty areas will show much higher proportions of reports from mandated sources. Our data show some slight association, but in the opposite direction. Row five on Table 2 shows the percentage of all Black children reported by mandated reporters at each level of poverty. This percentage declines gradually as the rate of poverty increases, from a high of 56.5% (b5% poverty) to a low of 48.2% (40%+poverty), a differential of 8.3%. For Whites, a similar dynamic occurs (Table 3, row 5) with the percentage of reports from mandated sources ranging between 45.4% and 53.3%. As for Blacks, the percentage of all reports from mandated sources generally declines as poverty increases. Consideration of racial homogeneity (rows 11, 17 and 23 on both tables) does not show any consistent impact of tract homogeneity on mandated report percentages. Those few categories showing substantially larger differences are likely a result of low cell sizes.
3.3. Neglect vs. abuse
As has been shown in prior work (Drake & Pandey, 1996), neglect comprises a somewhat higher proportion of maltreatment reports in poorer tracts. This is true for both Blacks and Whites. For Blacks, neglect (alone) referrals comprise 45.2% of cases in tracts with less than 5% Black poverty, while for Whites, the corresponding number is 46.0%. In the highest poverty tracts, 52.8% of reports relating to Black children are for neglect alone, while 55.0% of reports relating to White children are for neglect alone. There appears to be little variance in type of report by race.
In sum, reports from poorer areas are somewhat less likely to be from mandated sources, and are somewhat more likely to include allegations of neglect alone. These effects, however, occur for both Black and White reported children, and therefore do not help us in explaining racial disproportionality in reporting.
4. Discussion
4.1. Summary of main findings
Hypothesis 1
That Blacks have higher report rates than do Whites absent stratification by poverty is supported.
Consistent with national data (DHHS, 2005), Blacks in Missouri are disproportionately reported compared to Whites at a ratio of about 2:1.
Hypothesis 2
That Blacks and Whites will be reported at different rates when poverty is stratified, cannot be evaluated without consideration of poverty and racial homogeneity.
In short, Blacks are reported at a higher rate than Whites in areas with lower poverty levels, but Whites are reported more often than Blacks when living in higher poverty areas. These findings are possibly due to differences in reporting by racial homogeneity which is discussed more fully in Hypotheses 3 through 5 below.
Hypothesis 3
That Whites in high poverty strata will be reported at higher rates than Blacks in high poverty strata (differential sensitivity) is supported.
This can be seen visually in Figs. 1, 4–6. These findings are consistent with the prior literature (Ards et al., 2003; McDaniel & Slack, 2005)
Hypothesis 4
Whites in low poverty strata will be reported at lower rates than Blacks in low poverty strata (differential sensitivity), is generally supported.
This can be seen visually in Figs. 1, 4, and 6. The caveat in this case is that in our sample, Whites had higher rates of reporting in low poverty areas in which they were the numeric minority (Fig. 5). Again, these findings are consistent with Ards et al. (2003).
Hypothesis 5
That report rates would be higher for either race when that race was in the minority as compared to when they were in the majority, was supported for Whites. It was also supported for Blacks in less poor areas (under 15% of Black children in poverty) but was not supported for Blacks in areas in which 15% or more of Black children were below poverty.
Since 82.11% of Black children live in areas were 15% or more of the Black children live in poverty, any dynamics associated with being in the majority or minority can only explain a small proportion of the total number of Black reports. Similarly, as almost 95% of Whites live in White majority tracts, the increased numbers of Whites reported in Black majority areas will not exert any substantial effect on overall White report rates. Being “out of place” does not, therefore, explain meaningfully large differences in overall reporting rates in Missouri. Said another way, while we did find parts of this hypothesis to be supported, this effect cannot explain large levels of racial dispropor-tionality at the population level.
Hypothesis 6
That the percentage of reports from mandated reporters will be higher in tracts with high poverty is not supported.
Indeed, a mild trend in the opposite direction was found for both Blacks and Whites. Based on our data, the assertion that the disproportionate reporting of the poor is largely due to their increased visibility to mandated reporters is untenable. While this may be surprising to some, it does not contradict any empirical data of which we are aware. To our knowledge, the conventional wisdom that class-based visibility to mandated reporters drives report rates has never been demonstrated empirically (see Drake & Zuravin, 1998 for a full review of this issue).
4.2. Implications
We draw implications from our findings in three areas; policy, theory and research. With regard to policy, it would be unwise to take the 2:1 relative disproportionality of reports of Blacks vs. Whites at face value and make changes in the reporting system to address this seeming disparity or bias. While there are a number of interesting dynamics in our data, there is no evidence of a general racial bias in child maltreatment reports. Our findings in this area are not new, and are best seen as confirming prior work, especially Ards et al. (2003) and Sedlak and Broadhurst (1996a).
Theoretical implications from our data can be found in four areas: poverty, differential sensitivity, being “out of place” and visibility. As stated above, the theoretical association of poverty and child maltreatment was strongly confirmed. With regard to differential sensitivity, we did find evidence confirming other researcher's findings (Ards et al, 2003; McDaniel & Slack, 2005) that Whites may be more likely to be reported in high poverty samples and Blacks may be more likely to be reported in low poverty samples. Overall, White report rates appear more powerfully linked to poverty than do Black report rates. This is in agreement with recent findings by Korbin et al. (2007).
4.3. Differential assortment
It is widely held that structural barriers exist which make it harder for Blacks to succeed economically compared to Whites both historically and in the present. Whites, as a group, are wealthier and tend to have far higher assets (USDOC, 2001). Further, their residential mobility has not been historically restricted (e.g. redlining and other forms of segregation) in the same way the mobility of Blacks has been restricted. It is plausible to assert that on the average, those Whites who do experience extreme economic hardship and live in areas of concentrated poverty have “fallen through more safety nets” if you will, compared to Blacks. We call this idea “differential assortment”. Only about 1% of the White children in Missouri live in tracts where 40% or more of the White children in that tract are below the poverty level. On the other hand, over 37% of Black children live in neighborhoods in which 40% or more of the Black children are in poverty. Those few Whites who continue to live in very poor areas seem likely to have a higher number of risk factors that also increase the risk for child maltreatment (e.g. severe substance abuse or mental health issues, lack of education, inadequate socialization). In contrast, Black families that have the strengths necessary to raise children without neglect or abuse may be less able to move away from high poverty neighborhoods. The result of such a system of differential assortment by race would be consistent with our findings.
The higher report rates of Whites in predominantly Black areas and of Blacks in wealthier predominantly White areas cannot be definitively explained here. It may be due to their being more visible and thus more likely to be noticed and reported. It may also be due to other economic factors which our data did not capture. It is even possible that there issomething unique about individuals who happen to or choose to or are compelled to live as numeric minorities which we do not understand or address. Our findings are consistent with prior theory and findings (Jenkins & Diamond, 1985; Garland et al., 1998; McDaniel & Slack, 2005) and suggest the need for more in-depth analysis in this area. We feel that descriptive qualitative analyses would be useful.
With regard to visibility to mandated reporters causing higher report rates among the poor, our data show no evidence for such a dynamic. In fact, our data show that the poor are proportionately less likely to be reported by mandated reporters in Missouri, no matter which race they are. This brings us directly to Ards et al. (2003) and their concept of aggregation bias. To the extent that aggregation bias asserts that Blacks are more likely to be reported because Blacks are heavily aggregated in poorer communities, then our data lend strong support for this hypothesis. To the degree that the aggregation bias model asserts that this association is mediated by increased visibility to mandated reporters, our data fail to support that association.
4.4. Research implications
We used geographically-based data in an effort to replicate and refine prior analyses, many of which were done using the person as the unit of analysis. Our findings triangulate consistently with prior work (Ards et al., 2003; McDaniel & Slack, 2005; Sedlak & Broadhurst, 1996b) NIS-3, and suggest the utility of employing overlapping methods to verify results. It would appear that theoretical constructs relating to race, poverty and child maltreatment can be profitably explored using very diverse methods and levels of analysis, and that strong convergent validity can be achieved.
4.5. Strengths and limitations
There are several strengths of the data presented in terms of their ability to answer questions regarding racial disproportionality in child maltreatment reports. First of all, they give an actual, not inferred, picture of child maltreatment reporting at the state level for Missouri. Second, limiting consideration of racial effects to the report level and omitting substantiation or services data means that possible child welfare system bias due to an investigative worker's perceptions or multiplicative forms of bias are minimized. Another strength of using a full population sample is that it is only with very large samples that individuals in rare contexts (e.g. Whites as minorities in their tracts) can be studied.
From a knowledge building perspective, another strength of the data presented is that we are exploring racial disparities using data aggregated by geography based on poverty level of the Census tract where the individual lives, rather than at the individual level. This provides a useful means of triangulating on findings from datasets using individual-level units of analysis, such as the NIS-3.
One limitation of the data is that we do not have data relating to the poverty levels of the individual children reported. For the purposes of this paper, the concept of poverty is an ecological construct fixed at the level of the neighborhoods (tracts) in which children live. The study would have to use different data and be constructed quite differently to address poverty at the individual, as opposed to the neighborhood, level. On the other hand, there are sound theoretical reasons (Garbarino & Kostelny, 1992) to explore indicators of neighborhood, as opposed to individual level, poverty and other investigations have found strong relationships between individual measures of poverty and sufficiently small and homogeneous geographic areas (Krieger, 1992).
Another limitation of the current data is that we are forced to use child maltreatment database locations to fix individuals in particular neighborhoods. It is quite possible that some families moved between the date of the child maltreatment report and the 2000 Census. We attempted to minimize this problem by restricting our data to the 1999–2001 timeframe, thus limiting the degree of mobility and neighborhood change which might occur. Other potential and unavoidable distortions may also exist. For example, the presence of a single inexpensive motel in an otherwise wealthy neighborhood might cause the rate of maltreatment in that neighborhood to appear quite different than might be evidenced if it were not present. Another distortion present in our data arises from the presence of non-geocodable cases (comprising less than 12% of all cases), which were disproportionately from rural areas. Missouri does include areas of rural White poverty (e.g. south central) and rural Black poverty (e.g. the “Bootheel”). Improved geocoding of cases in these areas would be desirable.
Missouri screens out cases which do not meet “the legal definitions for abuse/neglect and for care custody and control” (Missouri DSS, 2005, p.3). Such reports are not included in the data used. This is both a strength and a weakness of the data used in the current study. For purposes of understanding state child welfare systems, it would be undesirable to include reports which are not appropriate for state referral and are not acted upon by the state. Conversely, it would be theoretically useful to verify that racial dynamics among screened-out reports are not radically different from those found in screened-in reports. That is not a task we attempt here, but would be and appropriate area for future research.
References
- Ards SD, Chung C, Myers SL. The effects of sample selection bias on racial differences in child abuse reporting. Child Abuse & Neglect. 1998;22(2):103–115. doi: 10.1016/s0145-2134(97)00131-2. [DOI] [PubMed] [Google Scholar]
- Ards SD, Myers SL, Chung C, Malkis A, Hagerty B. Decomposing Black-White differences in child maltreatment. Child Maltreatment. 2003;8:112–121. doi: 10.1177/1077559502250817. [DOI] [PubMed] [Google Scholar]
- Bartholet E. Nobody's children: Abuse and neglect, foster drift, and the adoption alternative. Boston: Beacon Press; 1999. [Google Scholar]
- Berger LM. Income, family structure, and child maltreatment risk. Children and Youth Services Review. 2004;26:725–748. [Google Scholar]
- Chasnoff I, Landress H, Barrett M. The prevalence of illicit drug and alcohol use during pregnancy and discrepancies in mandatory reporting in Pine County, Florida. New England Journal of Medicine. 1990;322:1202–1206. doi: 10.1056/NEJM199004263221706. [DOI] [PubMed] [Google Scholar]
- Chibnall D, Dutch NM, Jones-Harden B, Brown A, Gourdine R, Smith J, et al. Children of color in the child welfare system: Perspectives from the child welfare community. U.S. Department of Health and Human Service; 2003. [Google Scholar]
- Children's Division. Improvements at the Child Abuse and Neglect Hotline. Missouri Department of Social Services. 2006 Retrieved August 1, 2007, from http://www.dss.mo.gov/cd/canimprove.htm.
- Courtney ME, Barth RP, Berrick JD, Brooks D, Needel B, Park L. Race and child welfare services: Past research and future directions. Child Welfare. 1996;75:99–137. [PubMed] [Google Scholar]
- Department of Health and Human Services. Child Maltreatment 2003 US. 2005. [Google Scholar]
- Drake B, Pandey S. Do child abuse rates increase on days on which professional sporting events are held? Journal of Family Violence. 1996;11(3):205–218. [Google Scholar]
- Drake B, Zuravin S. Revisiting the myth of classlessness. American Journal of Orthopsychiatry. 1998;68(2):295–304. doi: 10.1037/h0080338. [DOI] [PubMed] [Google Scholar]
- Drake B, Jonson-Reid M. A response to Melton based on the best available data. Child Abuse and Neglect. 2007;31(4):343–360. doi: 10.1016/j.chiabu.2006.08.009. [DOI] [PubMed] [Google Scholar]
- Drake B, Jonson-Reid M. Social work research methods: From conceptualization to dissemination. Boston: Pearson; 2008. [Google Scholar]
- Drake B, Jonson-Reid M, Way I, Chung S. Substantiation and recidivism. Child Maltreatment. 2003;8(4):248–260. doi: 10.1177/1077559503258930. [DOI] [PubMed] [Google Scholar]
- Fluke JD, Yuan YT, Hedderson J, Curtis PA. Disproportionate representation of race and ethnicity in child maltreatment: Investigation and victimization. Child and Youth Services Review. 2003;25:359–373. [Google Scholar]
- Freisthler B, Merritt D, LaScala EA. Understanding the ecology of child maltreatment: A review of the literature and directions for future research. Child Maltreatment. 2006;11(3):263–280. doi: 10.1177/1077559506289524. [DOI] [PubMed] [Google Scholar]
- Freisthler B, Bruce E, Needell B. Understanding the geospatial relationship of neighborhood characteristics and rates of maltreatment for Black, Hispanic and White children. Social Work. 2007;52(1):7–16. doi: 10.1093/sw/52.1.7. [DOI] [PubMed] [Google Scholar]
- Freisthler B, Gruenewald PJ, Remer LG, Lery B, Needell B. Exploring the spatial dynamics of alcohol outlets and Child Protective Services referrals, substantiations, and foster care entries. Child Maltreatment. 2007;12:114–124. doi: 10.1177/1077559507300107. [DOI] [PubMed] [Google Scholar]
- Garbarino J, Kostelny K. Child maltreatment as a community problem. International Journal of Child Abuse and Neglect. 1992;16(4):455–464. doi: 10.1016/0145-2134(92)90062-v. [DOI] [PubMed] [Google Scholar]
- Garland AF, Ellis-MacLeod E, Landsverk JA, Ganger W, Johnson I. Minority populations in the child welfare system: The visibility hypothesis reexamined. American Journal of Orthopsychiatry. 1998;68(1):142–146. doi: 10.1037/h0080279. [DOI] [PubMed] [Google Scholar]
- Hines A, Lemon K, Wyatt P, Merdinger J. Factors related to the disproportionate involvement of children of color in the child welfare system: A review and emerging themes. Children and Youth Services Review. 2004;26:507–527. [Google Scholar]
- Hussey J, Marshall J, English D, Knight E, Lau A, Dubowitz H, et al. Defining maltreatment according to substantiation: Distinction without a difference? Child Abuse & Neglect. 2005;29:479–492. doi: 10.1016/j.chiabu.2003.12.005. [DOI] [PubMed] [Google Scholar]
- Jargowsky PA. Poverty and place: Ghettos, barrios, and the American city. New York: Russell Sage Foundation; 1997. [Google Scholar]
- Jenkins S, Diamond B. Ethnicity and foster care: Census data as predictors of placement variables. American Journal of Orthopsychiatry. 1985;55:267–276. doi: 10.1111/j.1939-0025.1985.tb03441.x. [DOI] [PubMed] [Google Scholar]
- Korbin J, Coulton J, Chard S, Platt-Houston C, Su M. Impoverishment and child maltreatment in African-American and European American neighborhoods. Development and Psychopathology. 2007;10:215–233. doi: 10.1017/s0954579498001588. [DOI] [PubMed] [Google Scholar]
- Krieger N. Overcoming the absence of socioeconomic data in medical records: Validation and application of a census-based methodology. American Journal of Public Health. 1992;82(5):703–710. doi: 10.2105/ajph.82.5.703. [DOI] [PMC free article] [PubMed] [Google Scholar]
- McDaniel M, Slack K. Major life events and the risk of a child maltreatment investigation. Children and Youth Services Review. 2005;27:171–195. [Google Scholar]
- Missouri Department of Social Services. Child abuse and neglect in Missouri: Report for calendar year 2004. Jefferson City, MO: Missouri Department of Social Services; 2005. [Google Scholar]
- Morton T. Letter to the editor. Child Abuse and Neglect. 1999;23(12):1209. doi: 10.1016/s0145-2134(99)00102-7. [DOI] [PubMed] [Google Scholar]
- Openshaw S. The modifiable areal unit problem. Norwich: Geo Books; 1984. [Google Scholar]
- Pelton L. Child abuse and neglect: The myth of classlessness. American Journal of Orthopsychiatry. 1978;48(4):608–617. doi: 10.1111/j.1939-0025.1978.tb02565.x. [DOI] [PubMed] [Google Scholar]
- Roberts D. Shattered bonds: The color of child welfare. New York, NY: Civets Books; 2002. [Google Scholar]
- Sedlak A, Broadhurst D. Third national incidence study of child abuse and neglect. U.S. Department of Health and Human Service; 1996. [Google Scholar]
- Sedlak A, Broadhurst D. Executive summary of the third National Incidence Study of Child Abuse and Neglect. U.S. Department of Health and Human Service; 1996. [Google Scholar]
- Turbett J, O'Toole R. Paper presented at the Annual Meeting of the American Sociological Association. 1980. Physician's recognition of child abuse. [Google Scholar]
- U.S. Census Bureau. Income, poverty, and health insurance coverage in the United States: 2003, US 2004 [Google Scholar]
- U. S. Department of Commerce. Black population in the US March 2000 population by age, sex, and race and Hispanic origin. 2001 Retrieved 4/3/06. [Google Scholar]
- Zellman G. The impact of case characteristics on child abuse reporting decisions. Child Abuse and Neglect. 1992;16:57–74. doi: 10.1016/0145-2134(92)90008-f. [DOI] [PubMed] [Google Scholar]