Abstract
Background:
The lateral center-edge angle (LCEA) is an important measurement in understanding acetabular morphology and has had multiple interpretations. Misunderstanding of the LCEA and its relationship with acetabular 3-dimensional (3D) morphology may result in misdiagnosis and poor outcomes.
Purpose:
To determine the discrepancy between bone-edge and sourcil-edge LCEA measurements on anteroposterior (AP) radiographs and to determine the 3D anatomic location of the sourcil-edge and bone-edge LCEA measurements.
Study Design:
Cohort study (diagnosis); Level of evidence, 2.
Methods:
The LCEA was measured on radiographs to both the sourcil-edge and bone-edge on AP images of 60 symptomatic hips. On computed tomography (CT), coronal slices producing an LCEA matching the magnitude of each AP LCEA were identified. These coronal slices were mapped to a sagittal image of the acetabulum, which was divided into a standard clockface (3 = anterior, 12 = superior). We identified clockface locations corresponding to the AP sourcil-edge and bone-edge LCEA measurements. Paired t tests identified differences in magnitude and location of the bone and sourcil LCEAs. Limits of agreement were calculated for the differences between measures. Intraclass correlation coefficients (ICCs) assessed inter- and intraobserver repeatability.
Results:
On the AP radiographs, the bone-edge LCEA was a mean 4.7° (95% CI, −4.0° to 13.3°) greater than the sourcil-edge LCEA (P < .001). On CT, the sagittal clockface location of the sourcil-edge LCEA was more anterior compared with the sagittal clockface location of the maximum bone-edge LCEA (1:03 ± 0:42 vs 12:06 ± 0:30, respectively; P < .001). In hips with a difference >5° between sourcil-edge and bone-edge measurements, the coronal CT slice corresponding to the sourcil-edge LCEA was significantly more anterior (1:26 ± 0:35) than the CT slice corresponding to the bone-edge LCEA (11:46 ± 0:29; P < .001). This significant difference was similar in location but less pronounced in hips with a difference ≤5°: the sourcil-edge LCEA occurred at 12:50 ± 0:40, while the bone-edge LCEA occurred at 12:00 ± 0:11 (P < .001). Interobserver repeatability was excellent for all LCEA and clockface location measurements (all ICCs >0.82).
Conclusion:
The sourcil-edge LCEA represents anterosuperior acetabular coverage while the bone-edge LCEA represents superior/lateral coverage. This information can be used in preoperative evaluation of and perioperative planning for hip preservation procedures.
Keywords: lateral center-edge angle, hip dysplasia, femoroacetabular impingement, hip preservation
Hip preservation is evolving as a subspecialty within orthopaedics. With the improved understanding of the pathomorphology of structural hip disease, there has been increasing investigation into radiographic measures of the acetabulum and proximal femur. Wiberg19 originally described the lateral center-edge angle (LCEA) and first reported its importance in the development of osteoarthritis (OA). Further natural history studies have confirmed the increased risk for the dysplastic hip to undergo degenerative change over a patient’s lifetime.1,11,18 Hip dysplasia is generally defined as an LCEA of less than 20°, with borderline dysplasia defined as an LCEA between 20° and 25°.8,19 On the other end of the spectrum, pincer-type femoroacetabular impingement (FAI) is a term used for acetabular overcoverage and has been defined as an LCEA greater than 40°.8,14
Wiberg19 originally described the LCEA as the lateral aspect of the bony support for the femoral head, or the sourcil. Others have interpreted this as the most lateral aspect of the bone of the acetabulum, or the bony edge.9 Hanson et al7 and Anderson et al2 reported that depending on which way the lateral aspect of the acetabulum was measured, there are significant differences in the LCEA that could lead to differences in diagnosis and treatment. Recently, Chadayammuri et al4 reported that computed tomography (CT) measurements of the LCEA were consistently greater than radiographic measures. In their study, the LCEA on CT was measured through the center of the femoral head, or at the 12 o’clock position of the clockface of the hip.4
In this study, we correlated standing anteroposterior (AP) pelvic radiographs to supine CT imaging to understand the morphologic origins of the discrepancies in bone-edge and sourcil-edge LCEA measurements on radiographs of adult patients with anteverted acetabula undergoing hip preservation procedures. The study purposes were (1) to determine the discrepancy between bone-edge and sourcil-edge LCEA measurements on anteroposterior (AP) radiographs and (2) to determine the anatomic location of the sourcil-edge and bone-edge LCEA measurements on the acetabulum using CT imaging. We hypothesized that the sourcil-edge LCEA would correspond to the anterosuperior aspect of the acetabulum, while the bone-edge LCEA would correspond to the superolateral aspect of the acetabulum.
Methods
This is a retrospective review of adult patients (>18 years) undergoing CT imaging who were evaluated for symptomatic hip pain and suspected hip pathomorphology between March 2013 and February 2015. Patients with acetabular retroversion (based on version angles <0° at the 1 o’clock position as measured on CT axial slices)17 were excluded from the study (n = 3). For patients with bilateral symptoms (n = 4), 1 hip was randomly selected. A total of 60 hips from 60 patients (35.0 ± 9.3 years, 42 females) were included in the final analysis. This study was approved by our institutional review board.
Standing AP radiographs and supine CT imaging of all patients were obtained as part of the routine clinical evaluation. Radiographs were obtained as previously described, and proper pelvic rotation was ensured on all images by assuring that the coccyx was in line with the pubic symphysis.5 Digitally reconstructed radiographs (DRRs) representing supine radiographs were generated from the CT data in Amira (version 5.6.0; Visage Imaging). These AP DRRs exactly matched the pelvic positioning (tilt, obliquity, and rotation) of each patient in the CT scanner.
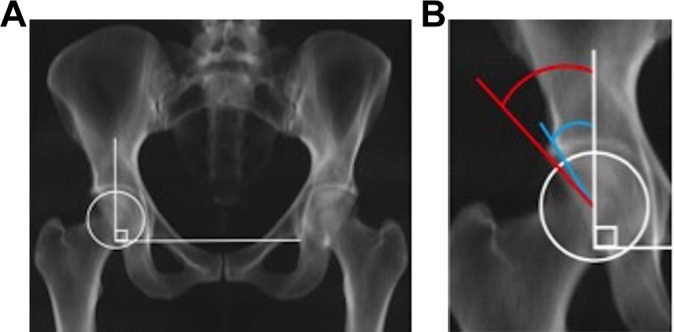
The LCEA was measured on both the standing AP radiographs and the AP DRRs in OsiriX (Pixmeo). A vertical reference line was identified perpendicular to a line connecting the distal borders of the pelvic teardrops and the affected femoral head was fit to a best-fit circle (Figure 1A). The center of the circle served as the vertex of the angle formed by the vertical reference line and the line extending to either the edge of the sclerotic sourcil (“sourcil LCEA”) or the edge of the bone (“bone LCEA”) (Figure 1B). Both LCEA measurements were interpreted as follows: <20° = dysplastic, ≥20° and ≤25° = borderline dysplastic, >25° and ≤40° = normal, and >40° = overcovered.8,14,19
Figure 1.

(A) Anteroposterior view of the pelvis on a digitally reconstructed radiograph from a computed tomography scan. The horizontal line through the acetabular teardrops normalizes the measurement to the pelvis and a perpendicular line is drawn through the center of the femoral head. (B) Magnified view of the femoral head and measurement of the sourcil-edge lateral center-edge angle (blue, 32°) and bone-edge lateral center-edge angle (red, 42°).
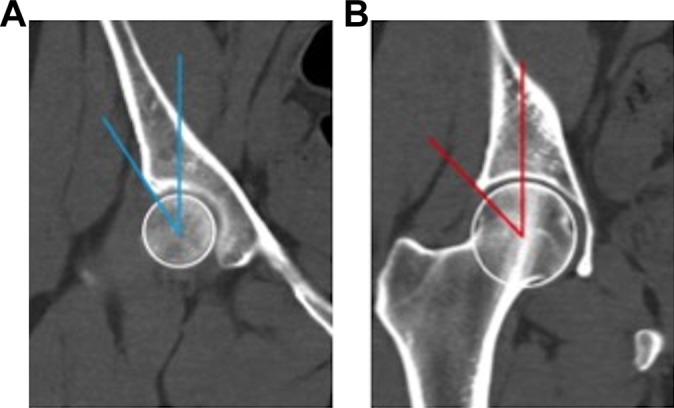
The LCEA was then measured in a similar fashion on each coronal CT slice between a vertical reference line (defined using the teardrop landmarks on the scout CT image) and the lateral border of the acetabular cortical bone in PACS (picture archiving and communication system; IntelliSpace PACS Enterprise; Philips North America) (Figure 2). The maximum bone-edge LCEA and the coronal slice it originated from were recorded (Figure 2A). Since there is no direct measurement analogous to the sourcil-edge LCEA on CT, the coronal slice producing an LCEA measurement with a magnitude closest to the sourcil-edge measurement from the DRR of the same hip was identified (Figure 2B).
Figure 2.

(A) Coronal computed tomography slice at the measurement equal to the sourcil-edge lateral center-edge angle (blue, 32°). (B) Coronal computed tomography slice through the maximum lateral center-edge angle (red, 42°) that correlated to the bone-edge lateral center-edge angle.
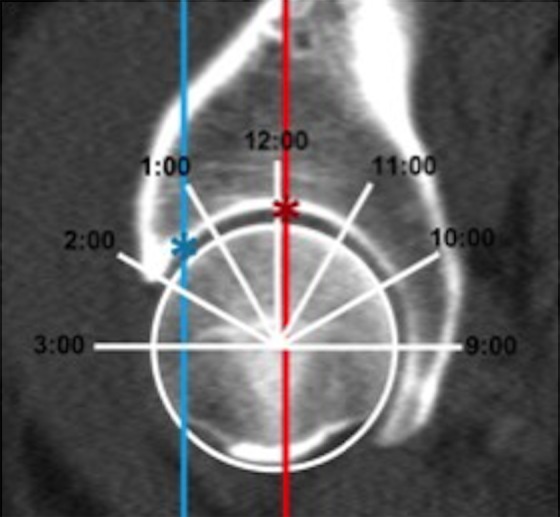
These coronal slices were projected onto a mid-acetabular sagittal image to describe the AP location of the bone and sourcil LCEAs relative to the 3-dimensional (3D) acetabular geometry from CT. A clockface was defined on the sagittal image originating at the center of a best-fit circle to the femoral head. 12:00 represented superior and 3:00 represented anterior in both left and right hips (Figure 3). The intersection of the line representing the selected coronal slice and the articulating surface of the acetabulum was identified. The location of this point relative to the clockface was recorded to define the AP locations of the coronal slices producing the maximum bone LCEA and equivalent sourcil LCEA (Figure 3).
Figure 3.

Sagittal slice on computed tomography scan through the midcoronal axis of the left femoral head with the clockface placed on the femoral head. Superior represents 12:00, anterior (left on the image) represents 3:00, and posterior (right on the image) represents 9:00. Sourcil lateral center-edge angle in hips (n = 21) with >5° of difference between sourcil-edge and bone-edge measurements is depicted in blue, while the bone lateral center-edge angle is depicted in red.
The senior author (T.G.M.), an orthopaedic surgeon with 10 years of experience and fellowship training in sports medicine and hip arthroscopy, completed the radiographic measurements on all patients. The first author, an orthopaedic fellow specifically trained in hip arthroscopy and hip/pelvis radiographic interpretation, independently repeated the measurements in a randomly selected subset of 20 hips to assess interobserver repeatability. The intraclass correlation coefficient was calculated and interpreted as follows: minimal = <0.2, poor = 0.2 to < 0.4, moderate = 0.4 to <0.6, strong = 0.6 to ≤0.8, and excellent = >0.8.12
Paired t tests were used to identify possible differences in magnitude and clockface locations of the bone and sourcil LCEAs. For analysis, 1 o'clock to 6 o’clock was coded to military time (ie, 13:00-18:00) to better represent the proximity of 12 o’clock to 1 o’clock and considered an interval scale variable. Bland-Altman limits of agreement3 were calculated for the differences between (1) bone LCEA and sourcil LCEA on AP DRRs and (2) bone LCEA on AP DRRs and maximum bone LCEA on CT, as well as the difference between measurements on AP radiographs and AP DRRs. All statistical analyses were completed using Stata/IC 14.0 (StataCorp LP).
Results
Differences Between LCEA Measurement Methods
In comparing the standing AP pelvis radiographs with the AP DRRs, there was no difference in measurement of bone LCEA (mean difference, −0.1°; 95% limit of agreement, −2.7° to 2.4°) or sourcil LCEA (mean difference, 0.3°; 95% limit of agreement, −2.2° to 2.7°). On the AP DRRs, the bone LCEA was on average 4.7° (95% limits of agreement, −4.0° to 13.3°) greater than the sourcil LCEA (P < .001). The difference in these angles would result in a different diagnosis category for 26 of 60 (43%) hips (eg, normal to borderline dysplastic or borderline dysplastic to dysplastic) (Table 1). There was minimal difference between the maximum bone LCEA on CT and the bone LCEA on DRR (0.7°; 95% limits of agreement, −2.0° to 3.4°).
TABLE 1.
Acetabular Coverage Classification of Each by Sourcil and Bone LCEAa
| Classification Based on Sourcil LCEA | |||||
|---|---|---|---|---|---|
| Dysplastic | Borderline | Normal | Pincer | Total | |
| Classification based on bone LCEA | |||||
| Dysplastic | 6 | 0 | 0 | 0 | 6 |
| Borderline | 7 | 5 | 0 | 0 | 12 |
| Normal | 1 | 12 | 21 | 0 | 34 |
| Pincer | 0 | 1 | 5 | 2 | 8 |
| Total | 14 | 18 | 26 | 2 | 60 |
aLCEA, lateral center-edge angle.
Correlations Between LCEA Measurements and Acetabular Location on CT Imaging
On CT, sagittal clockface location of the sourcil-edge LCEA was more anterior compared with the sagittal clockface location of the maximum bone LCEA (1:03 ± 0:42 versus 12:06 ± 0:30, respectively; P < .001). In hips with a difference >5° (n = 21) between bone and sourcil LCEA measurements on DRR, the sagittal clockface location of the sourcil LCEA was significantly more anterior (1:26 ± 0:35) than the sagittal clockface location of the bone LCEA (11:46 ± 0:29; P < .001) (Figure 3). This significant difference was similar in location but less pronounced in hips with a difference ≤5° (n = 39): The sourcil LCEA occurred at 12:50 ± 0:40 while the bone LCEA at 12:00 ± 0:11 (P < .001). Interobserver repeatability was excellent for all LCEA and clockface location measurements (all ICCs >0.82; Table 2).
TABLE 2.
Interobserver Repeatability of Study Measurements as Quantified by the ICCa
| Measurement | ICC |
|---|---|
| DRR bone LCEA | 0.96 |
| DRR sourcil LCEA | 0.82 |
| CT maximum bone LCEA | 0.95 |
| Clockface location of bone LCEA | 0.82 |
| Clockface location of sourcil LCEA | 0.83 |
aCT, computed tomography; DRR, digitally reconstructed radiographs; ICC, intraclass correlation coefficient; LCEA, lateral center-edge angle.
Discussion
The most important findings from this study are that sourcil-edge and bone-edge LCEA measurements consistently correspond to specific but different anatomic areas on the anteverted acetabulum. The sourcil-edge LCEA measurement corresponds to the anterosuperior aspect of the acetabulum (approximately the 1 to 1:30 area of the clockface), while the bone-edge LCEA measurement corresponds to the lateral/superior aspect of the acetabulum (approximately the 12:00 area of the clockface). Additionally, when the LCEA is measured on the coronal CT scan at the midsagittal plane of the femoral head, this typically corresponds to the 12:00 area of the clockface, and thus, the bone-edge LCEA on the plain AP radiograph. This anatomic difference can be important when considering or planning surgical acetabuloplasty or periacetabular osteotomy to address overcoverage or dysplasia, respectively.
There are limitations to this study. This is a retrospective review of patients who had radiographs and corresponding CT scans of the hip and has the inherent bias of a retrospective study design. All patients had symptomatic hip pain. This represents a selection bias as only symptomatic hips were included in the study. The sample size is relatively small; however, we found clear significant associations despite the sample size. We excluded patients with retroverted acetabula, and therefore, the findings of this study are only applicable to patients with anteverted acetabula. Further studies are warranted to understand the relationship of these measures in retroverted acetabula. In addition, assessing acetabular morphology is complex and requires multiple radiographic images and measurements for comprehensive evaluation.16 This study focuses on only 1 of these measures (LCEA), which should not be used in isolation as the only measure of acetabular morphology.
Since Wiberg19 described the LCEA, many studies have used this as a measure of acetabular morphology. However, there has been some controversy over measuring it to the edge of the sourcil versus measuring it to the bone edge.2,7,9 In the literature, some articles report the bone edge,6,10 while others report the sourcil edge,2,5,13 with both groups claiming to report the LCEA. Hanson et al7 recently quantified the difference between the 2 measures in a cohort of patients undergoing hip preservation surgery with the bone LCEA being 4° greater than the sourcil LCEA. Similar to previous findings, the LCEA measure at the bone edge was larger than that at the edge of the sourcil.2,7 This difference was greater than 5° in 21 of 60 (35%) patients. In addition, we compared these measurements from supine DRR AP images to standing AP pelvis radiographs to evaluate the effect of pelvic tilt. There was almost no difference between these measures comparing the supine and standing films, similar to recent reports.15 With the increasing use of 3D imaging of the hip, LCEA measurements are greater on CT when measured at the midsagittal plane of the femoral head compared with radiographs.4 Our data suggest that this increased LCEA on CT scans is likely accurate but represents the bone-edge LCEA on the AP pelvis and thus is typically greater than the sourcil-edge LCEA. This relationship correlates with the recent findings of Chadayammuri et al,4 who measured CT LCEA at the midsagittal line of the femoral head (or at 12:00 on the clockface) and reported that the LCEA on CT was greater than on AP radiographs. Conversely, the sourcil LCEA measurement is located more anterior (approximately 1:00-1:30 on the clockface).
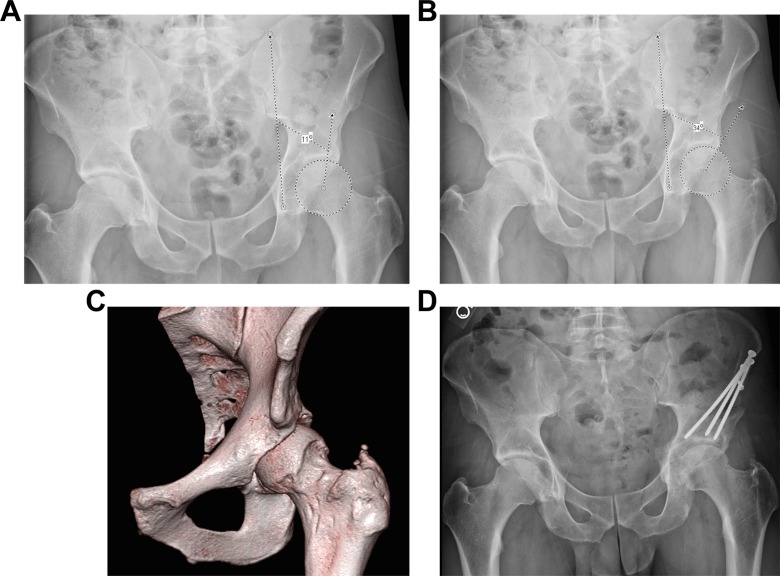
Combined with previous findings, this study helps us understand the discrepancy between LCEA measured on radiographs and CT scans.4 Differences in LCEA measures, whether on radiographs or CT, have implications in the diagnosis and treatment of the young adult hip. A difference of 5° on the LCEA at the lower end of values could result in a clinician deciding to do a periacetabular osteotomy or at the higher end of values could determine whether the patient has a pincer FAI lesion that can be treated with acetabuloplasty. Knowing where these measures correspond to on the clockface of the acetabulum can also help to guide the surgeon intraoperatively to understand the optimal location to perform an acetabuloplasty using fluoroscopy. This decision-making process is particularly germane to patients with significant acetabular anteversion in which there is a large individual difference between the bone LCEA and sourcil LCEA. In these patients, acetabular resection at the anterosuperior zone of the acetabulum may result in iatrogenic dysplasia due to a preoperative misunderstanding of these bony radiographic landmarks in 3 dimensions (Figure 4).
Figure 4.
A 30-year-old male post–acetabuloplasty, labral repair, and femoral osteochondroplasty. (A) Standing anteroposterior (AP) pelvic radiographs demonstrating over-resection of anterosuperior acetabulum with resultant sourcil-edge lateral center-edge angle (LCEA) of 11° with (B) possible misinterpretation of the bone-edge LCEA at 34°. (C) Three-dimensional computed tomography reconstruction demonstrating a large acetabular resection from 12 o'clock to 2 o’clock. (D) AP pelvic radiograph post–periacetabular osteotomy required for treatment of iatrogenic dysplasia.
In the setting of periacetabular osteotomy, the bone-edge LCEA may help guide lateral coverage while the sourcil-edge LCEA may help guide anterolateral coverage, although further study would be needed to understand how these measures correlate with fluoroscopic imaging intraoperatively. Our data suggest that there is little difference between the bone-edge and sourcil-edge measurements on standing AP radiographs and supine CT DRR AP pelvis images. Therefore, supine fluoroscopic images should be useful in guiding corrections in both lateral and anterosuperior position of the acetabular rim that will translate to standing pelvic position. Nevertheless, this theory deserves further study.
In conclusion, the sourcil-edge LCEA represents anterosuperior acetabular coverage, while the bone-edge LCEA represents superior/lateral coverage. While the classic measurement of acetabular coverage is the sourcil-edge LCEA, this study suggests that these measures give complementary information for the hip surgeon in evaluating and treating hip pain in the young adult. This information can be used in preoperative evaluation, perioperative planning, and intraoperative decision-making in hip preservation.
Footnotes
One or more of the authors has declared the following potential conflict of interest or source of funding: T.G.M. is an educational consultant for Arthrex. S.K.A. is an educational consultant for Stryker. C.L.P. has stock/stock options in Muve Medical and CoNextions Medical and is a paid education consultant for and receives research support and royalties from BioMet.
Ethical approval for this study was waived by the University of Utah Institutional Review Board (IRB_00071733).
References
- 1. Agricola R, Heijboer MP, Roze RH, et al. Pincer deformity does not lead to osteoarthritis of the hip whereas acetabular dysplasia does: acetabular coverage and development of osteoarthritis in a nationwide prospective cohort study (CHECK). Osteoarthritis Cartilage. 2013;21:1514–1521. [DOI] [PubMed] [Google Scholar]
- 2. Anderson LA, Gililland J, Pelt C, Linford S, Stoddard GJ, Peters CL. Center edge angle measurement for hip preservation surgery: technique and caveats. Orthopedics. 2011;34:86. [DOI] [PubMed] [Google Scholar]
- 3. Bland JM, Altman DG. Statistical methods for assessing agreement between two methods of clinical measurement. Lancet. 1986;1(8476):307–310. [PubMed] [Google Scholar]
- 4. Chadayammuri V, Garabekyan T, Jesse M-K, et al. Measurement of lateral acetabular coverage: a comparison between CT and plain radiography. J Hip Preserv Surg. 2015;2:392–400. [DOI] [PMC free article] [PubMed] [Google Scholar]
- 5. Clohisy JC, Carlisle JC, Beaulé PE, et al. A systematic approach to the plain radiographic evaluation of the young adult hip. J Bone Joint Surg Am. 2008;90(suppl 4):47–66. [DOI] [PMC free article] [PubMed] [Google Scholar]
- 6. Dolan MM, Heyworth BE, Bedi A, Duke G, Kelly BT. CT reveals a high incidence of osseous abnormalities in hips with labral tears. Clin Orthop Relat Res. 2011;469:831–838. [DOI] [PMC free article] [PubMed] [Google Scholar]
- 7. Hanson JA, Kapron AL, Swenson KM, Maak TG, Peters CL, Aoki SK. Discrepancies in measuring acetabular coverage: revisiting the anterior and lateral center edge angles. J Hip Preserv Surg. 2015;2:280–286. [DOI] [PMC free article] [PubMed] [Google Scholar]
- 8. Lee CB, Kim Y-J. Imaging hip dysplasia in the skeletally mature. Orthop Clin North Am. 2012;43:329–342. [DOI] [PubMed] [Google Scholar]
- 9. Ogata S, Moriya H, Tsuchiya K, Akita T, Kamegaya M, Someya M. Acetabular cover in congenital dislocation of the hip. J Bone Joint Surg Br. 1990;72:190–196. [DOI] [PubMed] [Google Scholar]
- 10. Philippon MJ, Wolff AB, Briggs KK, Zehms CT, Kuppersmith DA. Acetabular rim reduction for the treatment of femoroacetabular impingement correlates with preoperative and postoperative center-edge angle. Arthroscopy. 2010;26:757–761. [DOI] [PubMed] [Google Scholar]
- 11. Reijman M, Hazes JM, Pols HA, Koes BW, Bierma-Zeinstra SM. Acetabular dysplasia predicts incident osteoarthritis of the hip: the Rotterdam study. Arthritis Rheum. 2005;52:787–793. [DOI] [PubMed] [Google Scholar]
- 12. Rosenkrantz AB, Lim RP, Haghighi M, Somberg MB, Babb JS, Taneja SS. Comparison of interreader reproducibility of the prostate imaging reporting and data system and Likert scales for evaluation of multiparametric prostate MRI. AJR Am J Roentgenol. 2013;201:W612–W618. [DOI] [PubMed] [Google Scholar]
- 13. Sankar WN, Brighton BK, Kim Y-J, Millis MB. Acetabular morphology in slipped capital femoral epiphysis. J Pediatr Orthop. 2011;31:254–258. [DOI] [PubMed] [Google Scholar]
- 14. Sankar WN, Matheney T, Zaltz I. Femoroacetabular impingement. Orthop Clin North Am. 2013;44:575–589. [DOI] [PubMed] [Google Scholar]
- 15. Tannast M, Fritsch S, Zheng G, Siebenrock KA, Steppacher SD. Which radiographic hip parameters do not have to be corrected for pelvic rotation and tilt? Clin Orthop Relat Res. 2014;473:1255–1266. [DOI] [PMC free article] [PubMed] [Google Scholar]
- 16. Tannast M, Hanke MS, Zheng G, Steppacher SD, Siebenrock KA. What are the radiographic reference values for acetabular under- and overcoverage? Clin Orthop Relat Res. 2015;473:1234–1246. [DOI] [PMC free article] [PubMed] [Google Scholar]
- 17. Tannenbaum EP, Zhang P, Maratt JD, et al. A computed tomography study of gender differences in acetabular version and morphology: implications for femoroacetabular impingement. Arthroscopy. 2015;31:1247–1254. [DOI] [PubMed] [Google Scholar]
- 18. Thomas GER, Palmer AJR, Batra RN, et al. Subclinical deformities of the hip are significant predictors of radiographic osteoarthritis and joint replacement in women. A 20 year longitudinal cohort study. Osteoarthritis Cartilage. 2014;22:1504–1510. [DOI] [PubMed] [Google Scholar]
- 19. Wiberg G. The anatomy and roentgenographic appearance of a normal hip joint. Acta Chir Scand. 1939;83:7–38. [Google Scholar]


