Abstract
PANTHER is a large collection of protein families that have been subdivided into functionally related subfamilies, using human expertise. These subfamilies model the divergence of specific functions within protein families, allowing more accurate association with function (ontology terms and pathways), as well as inference of amino acids important for functional specificity. Hidden Markov models (HMMs) are built for each family and subfamily for classifying additional protein sequences. The latest version, 5.0, contains 6683 protein families, divided into 31 705 subfamilies, covering ∼90% of mammalian protein-coding genes. PANTHER 5.0 includes a number of significant improvements over previous versions, most notably (i) representation of pathways (primarily signaling pathways) and association with subfamilies and individual protein sequences; (ii) an improved methodology for defining the PANTHER families and subfamilies, and for building the HMMs; (iii) resources for scoring sequences against PANTHER HMMs both over the web and locally; and (iv) a number of new web resources to facilitate analysis of large gene lists, including data generated from high-throughput expression experiments. Efforts are underway to add PANTHER to the InterPro suite of databases, and to make PANTHER consistent with the PIRSF database. PANTHER is now publicly available without restriction at http://panther.appliedbiosystems.com.
INTRODUCTION
The philosophy, as well as the basic methodology, behind the PANTHER database has been described previously (1,2); therefore, we focus here on the recent improvements to the database and to the functionality available on the website. In brief, there are two main parts to PANTHER: PANTHER/LIB, a library of protein families and subfamilies; and PANTHER/X, a set of ontology terms describing protein function. The database's main advantage is in the curator-defined grouping of protein sequences into functional subfamilies, allowing more detailed and accurate association with the ontology terms, and now biological pathways. Each family and subfamily is represented by a phylogenetic tree of ‘training sequences’, and a hidden Markov model (HMM) that represents these sequences as a statistical model. The HMM library can be searched to classify new sequences, or to provide a score to predict the likely functional consequence of a mutation (1). PANTHER is quite comprehensive for the annotation of protein sequences encoded by metazoan genomes: ∼90% of mammalian protein-coding genes, and nearly two-thirds of Drosophila genes, are hit by a PANTHER HMM.
The PANTHER database has recently been expanded to include associations between protein sequences and the biological pathways they participate in. Like the molecular function and biological process ontology terms, these pathways are associated with individual protein sequences, and when possible with PANTHER subfamily HMMs, by expert curators.
We have also improved the methodology used to define protein families and subfamilies. These improvements are mainly in two areas: global clustering of protein sequence space to allow definition of family boundaries, and new algorithms that make use of ontology terms to provide a guide for curators to define both families and subfamilies.
There are also a number of significant improvements to the website. Perhaps most importantly for users, the site is now free of the previous restrictions on its use (3). In addition, HMMs can be downloaded, and/or searched interactively using a protein sequence as a query. Pathways can be interactively browsed and queried. Gene lists (e.g. from mRNA expression data) can be uploaded to the site and analyzed relative to molecular functions, biological processes and pathways.
STATISTICS FOR PANTHER 5.0
PANTHER/LIB (library of protein family and subfamily HMMs), version 5.0 contains 256 413 training sequences, grouped into 6683 families. These families were then divided further into 31 705 subfamilies.
PANTHER HMMs have been used to annotate the protein-coding genes annotated in the human, mouse, rat and Drosophila melanogaster genomes. The fractions of these genes that were given a functional annotation by PANTHER 5.0 are shown in Table 1.
Table 1. Number of genes from each organism classified using PANTHER HMMs.
| Genome | No. of genes | No. of genes with PANTHER HMM hit | No. of genes with MF association | No. of genes with BP association |
|---|---|---|---|---|
| LocusLink human | 16 232 | 14 533 (89.5%) | 10 453 (64.4%) | 10 410 (64.1%) |
| LocusLink mouse | 15 020 | 13 147 (87.5%) | 10 012 (66.7%) | 9933 (66.1%) |
| LocusLink rat | 4516 | 4391 (97.2%) | 3967 (87.8%) | 3969 (87.9%) |
| FlyBase D.melanogaster | 13 654 | 9325 (68.3%) | 6253 (45.8%) | 5719 (41.9%) |
These classifications can be searched on the PANTHER website. For LocusLink, only genes associated with at least one reviewed RefSeq (accession no. beginning with ‘NP’) were considered. Genes encoding proteins that hit a PANTHER HMM can be classified to a family or subfamily, and most but not all of these are associated with meaningful molecular function (MF) or biological process (BP) classifications.
PANTHER WEBSITE FUNCTIONALITY
Several resources are now available at the PANTHER website.
Interactive
Ontology term browser. The PANTHER Prowler (1) is designed for browsing ontology terms to retrieve associated families, subfamilies or individual proteins.
Updated: tree and multiple sequence alignment (MSA) viewer. The PANTHER Tree-Attribute Viewer facilitates exploration of each protein family tree. It has been modified recently to allow a user to view either the sequence annotations as described previously (1), or the family MSA. The MSA view includes a number of features such as highlighting subfamily-specific amino acid conservation.
New: sequence search against PANTHER HMMs. The website now provides interactive scoring of user-submitted sequences against the PANTHER library.
Classification of whole genomes. Users can browse or query stored PANTHER HMM hits for all protein sequences annotated in the whole genomes of human, mouse, rat [from the LocusLink database (4)] and Drosophila melanogaster [from FlyBase (5)].
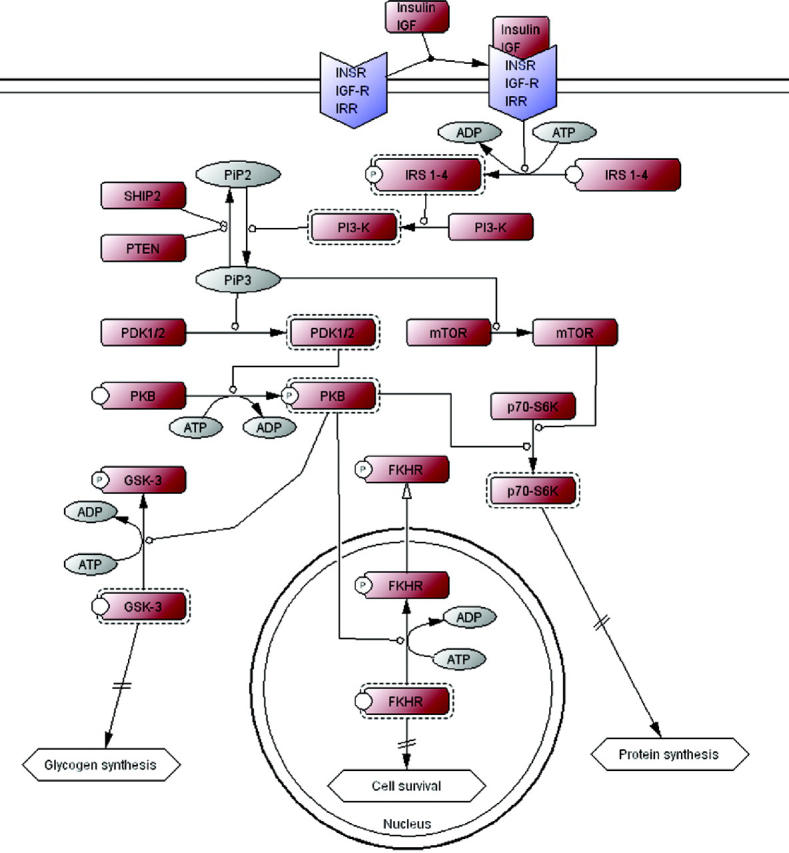
New: pathways. Users can browse or query pathways associated with PANTHER families, subfamilies and training sequences (Figure 1). Pathway diagrams were drawn by expert curators using the CellDesigner software program (6), which supports Systems Biology Markup Language (SBML) standards (7) and uses the process notation of Kitano (8) to represent pathways as a series of reactions. The same curators associated proteins in the diagrams with PANTHER families, subfamilies and training sequences. There are over 60 pathways, primarily signaling pathways, available as of January 2005.
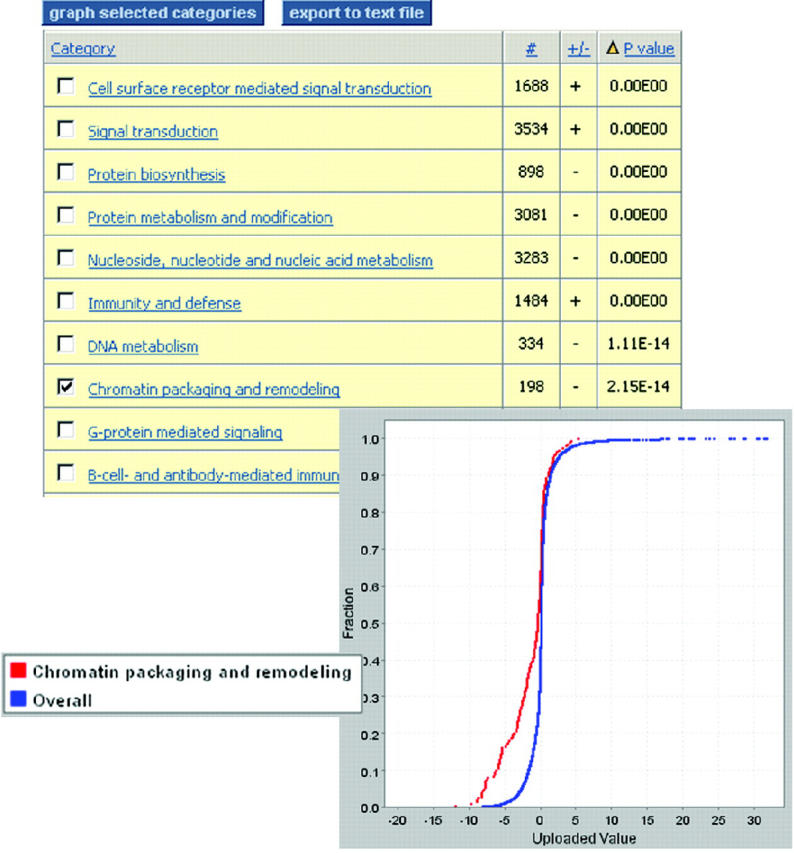
New: gene expression analysis tools. Users can upload gene lists (e.g. from mRNA expression experiments) and view them in the context of the pathways described above. In addition, users can analyze gene lists to look for statistically significant trends with respect to different groupings of genes: families, molecular functions, biological processes and pathways. In addition to the binomial test described previously (9), the Mann–Whitney U-test as described in (10) can be performed on uploaded data to look for statistically significant differences in distributions of uploaded values (Figure 2).
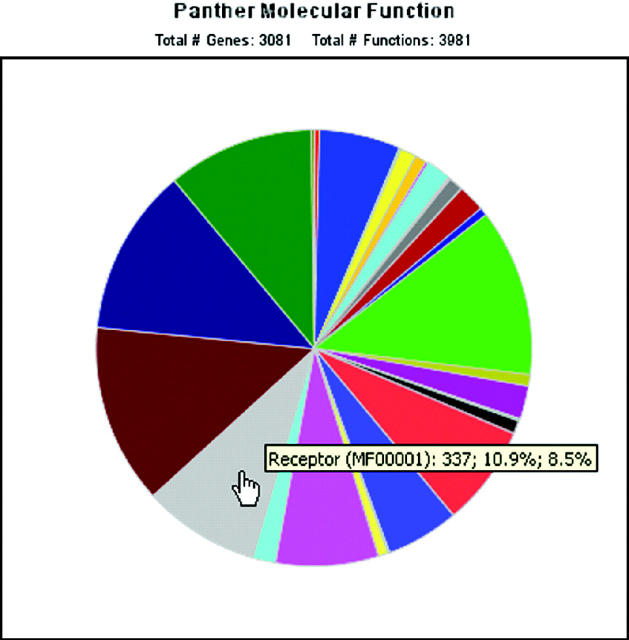
New: pie and bar charts of functions. Graphical representations of the functions of genes or proteins across an entire list can be generated in a single click from any list on the site, either generated at the website or uploaded by a user (Figure 3).
Figure 1.

CellDesigner (6) diagram of the insulin/IGF receptor signaling pathway. Proteins (blue and brown boxes) are mapped onto PANTHER HMMs. Active forms (dashed-line boxes) and phosphorylated forms (small circles around the letter ‘P’) of proteins are clearly indicated in the diagram. Over 60 pathways (mostly signaling pathways) are currently available.
Figure 2.

Statistical analysis of gene expression experiment results for a liver cancer versus normal cell line. Users can upload a list of genes/transcripts, along with an associated value (e.g. fold change, but can be any continuous variable). The list is divided automatically into groups sharing the same function (molecular function, biological process or pathway), and the distribution of values for each group is compared statistically with the overall distribution using the Mann–Whitney U-test to look for coordinated changes across each group (10).
Figure 3.
Pie chart of molecular functions represented in a list of genes. Users can upload protein IDs to the PANTHER website, and pie charts can be drawn from any list.
Downloads
INTEGRATION WITH OTHER WEB RESOURCES
PANTHER has been mapped to existing InterPro (14) entries, and this file is available from http://panther.appliedbiosystems.com/downloads/. PANTHER will be incorporated into the InterPro suite of databases incrementally. PANTHER HMMs have also been mapped to existing PIRSF (15) entries, and a collaboration is currently underway to make PANTHER and PIRSF consistent and cross-referenced.
NEW METHODS FOR PANTHER 5.0
For version 5.0, we implemented a number of improvements to the PANTHER library building procedure as described previously (1). At the end of this process, we evaluated the HMM classifications of a test set of over 10 000 sequences from SWISS-PROT to make sure that the new process did not lower the accuracy of the classifications reported (16). We found that the classification accuracy was nearly identical, and the coverage was slightly improved in 5.0, probably due to the new HMM building process outlined below.
Global UPGMA clustering to define family boundaries
PANTHER version 3.0 (1,2) used seed-based clustering to define protein families. The advantage of this approach was its modularity: new families could be easily added in areas that were inadequately covered in previous versions. However, the seed-based clustering resulted in significant redundancy for a number of large protein families, such as protein kinases and G-protein-coupled receptors, which were covered by a number of families that overlapped to varying degrees.
The current version, PANTHER version 5.0, addresses this issue by implementing a global clustering of proteins. Proteins from PANTHER version 4.0 were clustered using a similarity metric derived from the pairwise BLASTP scores:
![]()
where S(a, b) is the BLASTP raw score for the alignment of sequences a and b using the BLOSUM62 matrix and masked for low-complexity segments. The denominator is the largest self-alignment score, and therefore, the similarity is the fraction of the maximum score possible for an alignment of sequences a and b. In cases where there were multiple high-scoring pairs (HSPs; i.e. partial alignments), S(a, b) was set equal to the sum of the scores for the maximal set of non-overlapping HSPs.
This pairwise similarity was used to define single-linkage clusters (maximal clusters in which each protein is connected to at least one other protein in the cluster by a non-zero similarity score). A dendrogram was built for each single-linkage cluster using the UPGMA algorithm (17). The family labels from the PANTHER version 4.0 library were then used to define the optimal cut of each UPGMA dendrogram into family clusters, to maximize the correspondence to previous versions of PANTHER. In the great majority of cases, the PANTHER version 5.0 family was almost identical to the corresponding family in the previous version of the library. Only about 40 subtrees in the UPGMA dendrograms, primarily those that were represented by overlapping clusters in the previous version, had to be broken further into functionally homogeneous clusters using manual curation. Overall, the family clusters identified from the UPGMA dendrograms covered over 96% of the version 4.0 training sequences. The rest of the sequences were either singletons according to Equation 1 (often due to low-complexity masking), or lay outside the family boundaries defined by PANTHER version 4.0 family labels on the UPGMA dendrograms. Each of these ‘leftover’ sequences (unmasked) was scored against SAM HMMs built for the family clusters, and was brought into the family of the best scoring HMM if the NLL-NULL score was less than −50. Those leftovers not meeting this criterion were added as singleton families if they were from a primate or rodent species; otherwise they were removed from the library.
Simplified HMM building process
The UPGMA-derived family clusters allow us to simplify the HMM-building process detailed previously (1). Rather than building ‘initial’ and ‘extended’ HMMs, for PANTHER 5.0, we built the family HMM directly from the UPGMA family cluster in a single step. Because the HMM training sequences are of varying lengths, we pre-set the SAM buildmodel –modellength option to be 1.1 times the maximum sequence length in the cluster, and also added the option –sw2, to create a local HMM. Similar to previous versions of the library, this temporary HMM was used to create an alignment (using the SAM align2model procedure with the −sw2 option) that could be used to estimate the weights of the sequences in the initial HMM. A weighted model was then constructed followed by a weighted alignment.
In PANTHER 5.0, we used a faster version of TIPS (version 2.0, available from the Downloads section of the PANTHER website) to create the phylogenetic trees (18). As in previous versions, the MSA was used as input to the new TIPS2 algorithm, along with the following parameters. -prior uprior.9.com, -score_matrix BLOSUM 62, -cut_using_distance 0.5, -pair_type 1 and -use_are_as_branch_length 0.
Subfamily division guided by ontology terms
Because the subfamily labels and associated ontology terms were expanded and reviewed by curators for both versions 3.0 and 4.0, and shown to have a high rate of accuracy (16), we developed an algorithm for optimally dividing a tree into subfamilies given subfamily labels on each sequence (18). These divisions were then reviewed once again by expert curators, and adjusted if necessary. This methodology will allow regular updates to PANTHER training sequences with minimal curation effort.
Another significant advantage of this approach is that any arbitrary grouping of sequences can be superimposed on our phylogenetic trees to define subfamilies (and associated HMMs). This approach will allow straightforward incorporation of external annotations such as those produced by single protein family databases, or from large ontology association projects such as GOA (19,20).
REFERENCES
- 1.Thomas P.D., Campbell,M.C., Kejariwal,A., Mi,H., Karlak,B., Daveran,R., Diemer,K., Muruganujan,A. and Narechania,A. (2003) PANTHER: a library of protein families and subfamilies indexed by function. Genome Res., 13, 2129–2141. [DOI] [PMC free article] [PubMed] [Google Scholar]
- 2.Thomas P.D., Kejariwal,A., Campbell,M.C., Mi,H., Diemer,K., Guo,N., Ladunga,I., Ulitsky-Lazareva,B., Muruganujan,A. and Rabkin,S. (2003) PANTHER: a browsable database of gene products organized by biological function, using curated protein family and subfamily classification. Nucleic Acids Res., 31, 334–341. [DOI] [PMC free article] [PubMed] [Google Scholar]
- 3.Thomas P.D., Campbell,M.C., Kejariwal,A., Mi,H., Karlak,B., Daveran,R., Diemer,K., Muruganujan,A. and Narechania,A. (2003) Corrigendum for PANTHER: a library of protein families and subfamilies indexed by function. Nucleic Acids Res., 31, 2024. [DOI] [PMC free article] [PubMed] [Google Scholar]
- 4.Pruitt K.D. and Maglott,D.R. (2001) RefSeq and LocusLink: NCBI gene-centered resources. Nucleic Acids Res., 29, 137–140. [DOI] [PMC free article] [PubMed] [Google Scholar]
- 5.FlyBase Consortium (2002) The FlyBase database of the Drosophila genome projects and community literature. Nucleic Acids Res., 30, 106–108. [DOI] [PMC free article] [PubMed] [Google Scholar]
- 6.Funahashi A., Morohashi,M. and Kitano,H. (2003) CellDesigner: a process diagram editor for gene-regulatory and biochemical networks. Biosilico, 1, 159–162. [Google Scholar]
- 7.Hucka M., Finney,A., Sauro,H.M., Bolouri,H., Doyle,J.C., Kitano,H., Arkin,A.P., Bornstein,B.J., Bray,D., Cornish-Bowden,A. et al. (2003) The Systems Biology Markup Language (SBML): a medium for representation and exchange of biochemical network models. Bioinformatics, 19, 524–531. [DOI] [PubMed] [Google Scholar]
- 8.Kitano H. (2003) A graphical notation for biochemical networks. Biosilico, 1, 169–176. [Google Scholar]
- 9.Cho R.J. and Campbell,M.J. (2000) Transcription, genomes, function. Trends Genet., 16, 409–415. [DOI] [PubMed] [Google Scholar]
- 10.Clark A.G., Glanowski,S., Nielsen,R., Thomas,P.D., Kejariwal,A., Todd,M.J., Tanenbaum,D.M., Civello,D., Lu,F., Murphy,B. et al. (2003) Inferring nonneutral evolution from human–chimp–mouse orthologous trios. Science, 302, 1960–1963. [DOI] [PubMed] [Google Scholar]
- 11.Karplus K., Barrett,C. and Hughey,R. (1998) Hidden Markov models for detecting remote protein homologies. Bioinformatics, 14, 846–856. [DOI] [PubMed] [Google Scholar]
- 12.Eddy S.R. (1996) Hidden Markov models. Curr. Opin. Struct. Biol., 6, 361–365. [DOI] [PubMed] [Google Scholar]
- 13.Zdobnov E.M. and Apweiler,R. (2001) InterProScan—an integration platform for the signature-recognition methods in InterPro. Bioinformatics, 17, 847–848. [DOI] [PubMed] [Google Scholar]
- 14.Mulder N.J., Apweiler,R., Attwood,T.K., Bairoch,A., Barrell,D., Bateman,A., Binns,D., Biswas,M., Bradley,P., Bork,P. et al. (2003) The InterPro Database, 2003 brings increased coverage and new features. Nucleic Acids Res., 31, 315–318. [DOI] [PMC free article] [PubMed] [Google Scholar]
- 15.Wu C.H., Nikolskaya,A., Huang,H., Yeh,L.S., Natale,D.A., Vinayaka,C.R., Hu,Z.Z., Mazumder,R., Kumar,S., Kourtesis,P. et al. (2004) PIRSF: family classification system at the Protein Information Resource. Nucleic Acids Res., 32, 112–114. [DOI] [PMC free article] [PubMed] [Google Scholar]
- 16.Mi H., Vandergriff,J., Campbell,M., Narechania,A., Majoros,W., Lewis,S., Thomas,P.D. and Ashburner,M. (2003) Assessment of genome-wide protein function classification for Drosophila melanogaster. Genome Res., 13, 2118–2128. [DOI] [PMC free article] [PubMed] [Google Scholar]
- 17.Sokal R.R. and Michener,C.D. (1958) A statistical method for evaluation systematic relationships. Univ. Kansas Sci. Bull., 28, 1409–1438. [Google Scholar]
- 18.Lazareva-Ulitsky B. and Thomas,P.D. (2005) On the quality of tree-based protein classification. Bioinformatics, in press. [DOI] [PubMed]
- 19.Gene Ontology Consortium (2000) Gene Ontology: tool for the unification of biology. Nature Genet., 25, 25–29. [DOI] [PMC free article] [PubMed] [Google Scholar]
- 20.Camon E., Magrane,M., Barrell,D., Binns,D., Fleischmann,W., Kersey,P., Mulder,N., Oinn,T., Maslen,J., Cox,A. et al. (2003) The Gene Ontology Annotation (GOA) project: implementation of GO in SWISS-PROT, TrEMBL, and InterPro. Genome Res., 13, 662–672. [DOI] [PMC free article] [PubMed] [Google Scholar]


