

The switching probability of spin-orbit torque devices is controlled by the field-like torque, and switching back can occur.
Keywords: Spintronics, spin-orbit torque, magnetization switching, magneto optical Kerr effect, domain wall
Abstract
Spin-orbit torques (SOTs) allow the electrical control of magnetic states. Current-induced SOT switching of the perpendicular magnetization is of particular technological importance. The SOT consists of damping-like and field-like torques, and understanding the combined effects of these two torque components is required for efficient SOT switching. Previous quasi-static measurements have reported an increased switching probability with the width of current pulses, as predicted considering the damping-like torque alone. We report a decreased switching probability at longer pulse widths, based on time-resolved measurements. Micromagnetic analysis reveals that this anomalous SOT switching results from domain wall reflections at sample edges. The domain wall reflection was found to strongly depend on the field-like torque and its relative sign to the damping-like torque. Our result demonstrates a key role of the field-like torque in deterministic SOT switching and the importance of the sign correlation of the two torque components, which may shed light on the SOT switching mechanism.
INTRODUCTION
Spin-orbit coupling can convert charge currents to spin currents (1–8). The ability to generate spin currents without the help of ferromagnets constitutes a core building block of an emerging research field, spin orbitronics, which uses spin-orbit coupling as a spin-current source in spintronic devices. When the spin current from spin-orbit coupling is absorbed by a ferromagnet, it exerts a spin-orbit torque (SOT) on the ferromagnet. The SOT can switch magnetization (9, 10) and induce fast domain wall motion (11–13) in ferromagnet/heavy metal bilayers. The SOT switching of the perpendicular magnetization is of particular technological relevance because perpendicular magnetic random access memories have a better scalability than in-plane ones.
From the viewpoint of fundamental physics and its applications, it is of critical importance to understand the detailed SOT characteristics and consequent magnetization dynamics. The microscopic origin of SOT remains under debate (9, 10, 14–26), but it is commonly decomposed into two mutually orthogonal vector components, the damping-like torque (DLT) and field-like torque (FLT). SOT-induced magnetization dynamics, including the DLT and FLT terms, is described by the Landau-Lifshitz-Gilbert equation
| (1) |
where γ is the gyromagnetic ratio, is the unit vector along the magnetization, μ0Heff is the effective magnetic field, including the external, anisotropic, magnetostatic, and exchange fields, and α is the damping constant. τd () and τf () describe the magnitudes of DLT and FLT, respectively (in magnetic field units), where J is the current density, Ms is the saturation magnetization, d is the thickness of ferromagnet, c|| and c⊥ are the DLT and FLT efficiencies, respectively, and ŷ is the unit vector perpendicular to both the current direction and the inversion asymmetry direction (that is, thickness direction; see coordinate system in Fig. 1A). From Eq. 1, we found that the two torque components affect magnetization dynamics in distinctly different ways: The DLT directs the magnetization toward the y axis, whereas the FLT induces magnetization precessions around the y axis.
Fig. 1. TR-MOKE experimental setup and dc-induced magnetization switching in Ta/CoFeB/MgO.
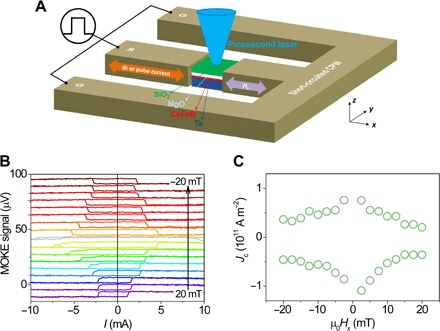
(A) Schematic illustration of TR-MOKE measurements. μ0Hx is the external magnetic field. The dc or pulse current is applied along the x axis. The picosecond laser is shined as a probe beam. The patterned perpendicular anisotropy Ta (6 nm)/CoFeB (0.8 nm)/MgO (2 nm) square is connected to a ground (G)–signal (S)–ground (G) coplanar waveguide. (B) dc-induced magnetization switching with various μ0Hx. The data are shifted vertically for clarity. (C) dc switching current density Jc versus μ0Hx.
Most of the previous SOT-switching studies have considered DLT as a main driving source but ignored the FLT. When considering DLT alone, the switching trajectory in the macrospin approximation is expected to be simple without magnetization precessions (27). This DLT-dominated switching leads to an increased switching probability with the current pulse width, consistent with previous quasi-static measurements (28, 29) and also in accordance with common belief. However, in some ferromagnet/heavy metal bilayers (for example, Ta-based bilayers), the FLT is significant (30–32). For a sizable FLT, it has been theoretically predicted that the magnetization precession induced by the FLT complicates magnetization dynamics, especially for the case wherein the sign of FLT is the opposite to that of DLT (in our sign convention; see Eq. 1) (33–35). In this respect, it is important to experimentally investigate the role of FLT in the SOT switching. Note that previous quasi-static measurements based on Hall bar detection (9, 10, 28, 29) or magneto-optical Kerr effect (MOKE) microscopy (36) would be unable to capture the core effect of FLT because this may induce fast dynamics (that is, magnetization precessions around the y axis). To overcome this limitation, it is essential to perform time-resolved (TR) measurements (37, 38), which provide an important step toward a better understanding of SOT-induced magnetization dynamics.
Here, we report SOT-induced magnetization dynamics in time domain by TR-MOKE measurements for Ta/CoFeB/MgO heterostructures with perpendicular magnetic anisotropy. This Ta-based structure has a large FLT (that is, |τf /τd| ≈ 4) whose sign is the opposite to that of DLT (32), such that it allows a detailed study of the FLT effect on SOT switching. The temporal evolution of the magnetization is detected by the stroboscopic pump-probe technique with an electrical pulse generator (pump) and a picosecond laser (probe) (see section S1), as shown schematically in Fig. 1A. We observe an anomalous SOT-induced switching behavior, in which the switching probability increases at short current pulses but decreases at longer pulses. On the basis of micromagnetic simulations, we interpret this anomalous switching behavior as a consequence of FLT-assisted domain wall reflection at sample edges.
RESULTS
TR measurements of perpendicular magnetization switching by SOT
We first perform a static polar MOKE measurement using an in-plane dc I with an external in-plane magnetic field μ0Hx along the x axis to examine the dc SOT switching characteristics of the Ta (6 nm)/CoFeB (0.8 nm)/MgO (2 nm) sample (device 1). The pattern size of device 1 is 3 μm × 3 μm, which is large enough to detect SOT-induced change in the MOKE signal. Figure 1B shows MOKE signals as a function of dc with various in-plane magnetic fields. As a polar MOKE signal probes the average z component of CoFeB magnetization (〈Mz〉) in a laser spot, where a high (low) signal corresponds to the 〈Mz〉-up (〈Mz〉-down) magnetic state, the hysteretic curves show SOT-induced deterministic magnetization switching. The switching polarity is determined by the direction of the current and Hx (9, 10): The up-to-down switching occurs in a positive (negative) current with a negative (positive) Hx. As shown in Fig. 1C, the dc switching current density Jc decreases with increasing Hx, in agreement with previous reports using Hall bar experiments (9, 20).
We next carry out TR measurements by injecting a current pulse with various pulse widths (that is, tpw ≤ 5 ns, J = 5.2 × 10¹¹ A m−2, and μ0Hx = −168 mT) and by detecting the magnetic state in time domain through TR-MOKE signal (Fig. 2A). The current pulse is turned on at t = 0 (that is, current-on) and turned off at a time indicated by a red triangle in each curve (that is, current-off). The horizontal dashed lines serve as guides for the maximum change in MOKE signal (~7 μV), corresponding to full magnetization switching from the up to the down state.
Fig. 2. TR-MOKE measurements of SOT-induced perpendicular magnetization switching in Ta/CoFeB/MgO.
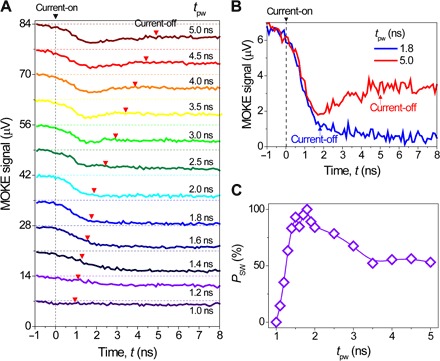
(A) Temporal evolutions of TR-MOKE signals corresponding to the average z component of magnetization (Mz) in an applied current density (J = 5.2 × 10¹¹ A m−2) of various pulse widths (tpw) from 1 to 5 ns for μ0Hx = −168 mT. The data are shifted vertically for clarity. The current pulse starts at t = 0, and the end of the current pulse is indicated as a red triangle in each curve. The horizontal dashed lines serve as guides to the maximum change in MOKE signal (~7 μV), corresponding to the full magnetization switching from the up to the down state. (B) Time-varying MOKE signal for tpw = 1.8 and 5.0 ns. (C) Switching probability (Psw) as a function of tpw, extracted from Fig. 2A.
For short pulses (tpw ≤ 1.6 ns), the MOKE signal change is smaller than 7 μV, indicating that the current pulse is too short to switch the magnetization. For an increase of tpw to 1.8 ns, a complete switching is achieved, as evidenced by a signal change of ~7 μV (by defining the final magnetic state at t = 8 ns). However, when tpw > 2.5 ns, we observe an anomalous temporal change in the TR-MOKE signal: It decreases in the initial time stage (<2 ns) but increases back even before the current pulse is turned off.
To clarify the anomalous SOT switching behavior, we compare two cases, tpw = 1.8 and 5.0 ns, in Fig. 2B. For tpw = 1.8 ns, which corresponds to normal switching, the TR-MOKE signal decreases monotonously when the current is on, indicating that 〈Mz〉 changes monotonously from the up to the down state by SOT. This decreased signal is maintained even after the current is turned off so that the up-to-down switching is completed. On the other hand, for tpw = 5.0 ns, which corresponds to anomalous switching, the signal decreases until t = 2 ns is reached and then increases back. Note that this anomalous increase in the signal is present even before the current is off. It implies that the SOT is responsible not only for the initial decrease in the MOKE signal (that is, switching) but also for the anomalous increase in the signal (that is, switching back). The anomalous switching back phenomena are observed for all cases with tpw > 2.0 ns, as summarized in Fig. 2C, which shows the switching probability (PSW) as a function of tpw, where PSW (%) = [1 – VMOKE (t = 8 ns)/7 μV] × 100.
We next show that the anomalous switching back phenomena become more pronounced as the current amplitude increases. We perform TR-MOKE measurements at various current densities and pulse widths for a structure of Ta (3 nm)/CoFeB (1.2 nm)/MgO (2 nm) with a pattern size of 3 μm × 6 μm (device 2). As an example, Fig. 3A shows TR-MOKE signals normalized by the maximum signal change as a function of time at various current densities for tpw = 30 ns. Focusing on the normalized MOKE signal at t = 45 ns (that is, after the current is turned off), we find that a higher current density causes more switching back. Figure 3B summarizes PSW versus tpw at various current densities. It shows that the switching back phenomena become more noticeable at higher current densities.
Fig. 3. Current-dependence of SOT-induced magnetization switching.
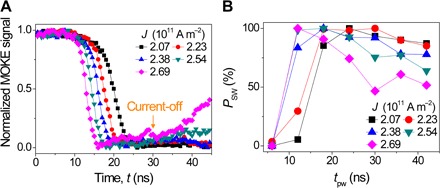
The sample structure is Ta (3 nm)/CoFeB (1.2 nm)/MgO (2 nm)/SiO2 (3 nm). (A) Temporal evolutions of TR-MOKE signals, normalized by the maximum signal change, for various current densities for tpw = 30 ns and μ0Hx = −90 mT. (B) Switching probability (PSW) as a function of tpw at various current densities.
Anomalous SOT switching due to domain wall reflections at edges: Micromagnetic analysis
To understand the anomalous switching back phenomena, we perform micromagnetic simulations at 0 K (Fig. 4; see Materials and Methods). We use parameters of magnetic properties and SOTs [DLT (c|| = −0.07) and FLT (c⊥ = +0.28)], deduced from magnetometer (see section S2) and harmonic Hall measurements for Ta/CoFeB/MgO samples (32). Figure 4A shows temporal evolutions of normalized 〈mz〉 at various current pulse widths for J = 15 × 1011 A m−2 and μ0Hx = −200 mT. The current-off time is depicted as a vertical dashed line for each case. For tpw = 1.5 and 1.6 ns, the current pulse is too short to switch the magnetization, whereas for tpw = 1.7 ns, a full switching is achieved. The switching back is observed for a longer pulse (tpw = 1.8 ns): 〈mz〉 returns back to the initial state (〈mz〉 = +1) after the current is turned off. Figure 4B shows a switching parameter P as a function of tpw, where P is defined as “1” (“0”) for the switching (no-switching) event. We find that the switching back (equivalently no-switching event) is not unique for the case of tpw = 1.8 ns but appears in a somewhat oscillatory manner for tpw > 1.8 ns. Note that the oscillation is not periodic. This nonperiodic oscillatory switching obtained from the zero-temperature calculation (Fig. 4B) can explain the decreased switching probability at longer pulses observed in the room temperature measurement (Fig. 2C) because the thermal effect randomizes the oscillatory switching dynamics. In section S3, we show micromagnetic simulation results for detailed oscillatory switching dynamics.
Fig. 4. Micromagnetic simulation results for SOT switching at 0 K.
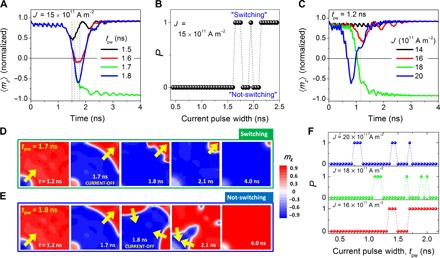
(A) Temporal evolutions of average Mz/Ms (〈mz〉) at various current pulse widths. (B) Switching parameter (P; 0 = no-switching and 1 = switching) as a function of tpw for J = 15 × 1011 A m−2 and μ0Hx = −200 mT. (C) Temporal evolutions of 〈mz〉 at various current densities for tpw = 1.2 ns and μ0Hx = −200 mT. Snapshots of magnetization configuration (mz = Mz/Ms) at time t for tpw = 1.7 ns (D) and 1.8 ns (E). Yellow arrows show the direction of domain wall motion. (F) Switching parameter P as a function of tpw for various current densities (J = 16 × 1011, 18 × 1011, and 20 × 1011 A m−2).
Micromagnetic simulations reveal that the switching back phenomena originate from the domain wall reflection at sample edges in the presence of current (thus SOT), as discussed below. We show temporal evolutions of mz for tpw = 1.7 and 1.8 ns, corresponding to the switching (Fig. 4D) and switching back (Fig. 4E), respectively. For both cases, in the initial time stage (t < 1.7 ns), a reversed domain is nucleated at a corner and then expands isotropically. For tpw = 1.7 ns, the current is turned off at the moment when the domain wall arrives at sample edges. In this case, the domain wall remains moving in the same direction as before because of inertia (39–41), even after the current is turned off. As a result, a full switching is achieved. On the other hand, for tpw = 1.8 ns, the current is still turned on when the domain wall arrives at sample edges. In this case, the domain wall is reflected from the edges and moves in the opposite direction, leading to switching back. Therefore, the domain wall reflection at sample edges in the presence of SOT is key to explaining the anomalous switching back phenomena.
The domain wall reflection at sample edges also explains the current-dependent switching back behavior shown in Fig. 3. Figure 4C shows temporal evolutions of 〈mz〉 at various current densities when tpw = 1.2 ns and μ0Hx = −200 mT. At a low current density, a reversed domain is not nucleated (J = 14 × 1011 A m−2), or the domain wall is unable to reach the sample edges (J = 16 × 1011 A m−2). At an increased current density (J = 18 × 1011 A m−2), a full switching occurs. However, at a higher current density (J = 20 × 1011 A m−2), 〈mz〉 initially decreases but returns to the initial state because of the domain wall reflection (see section S3). Figure 4F shows the switching parameter P as a function of tpw at various current densities. Similar to the results shown in Fig. 4B, the switching back appears in a somewhat oscillatory manner. The no-switching event (P = 0) becomes more frequent for a higher current density when tpw exceeds a threshold to enable the switching. This behavior is consistent with experimental observations (Fig. 3), in which the switching back phenomena become more pronounced as the current amplitude increases.
Effect of FLT on the domain wall reflection: Collective coordinate analysis
To understand the effect of FLT on the domain wall reflection, we investigate domain wall dynamics based on a semi–one-dimensional micromagnetic model. We first show the domain wall moving along the bottom edge in a two-dimensional sample (Fig. 4, D and E), where a Néel-type domain wall is stabilized by Hx at this edge. Figure 5A shows temporal evolutions of the domain wall position at various FLT to DLT ratios (that is, τf/τd = c⊥/c||) for J = 6 × 10¹¹ A m−2 and μ0Hx = −200 mT. Here, we fix the DLT efficiency c|| as −0.07 and vary the FLT efficiency c⊥. For all cases, the domain wall is reflected at the edge (located at 2 μm), exhibits a backward motion for a while, and then moves back to the edge again. After several reflections, the domain wall eventually annihilates at the edge, and the switching is completed. This domain wall reflection is understood by the reflection of a transverse wave at a fixed end. It is known that the phase of a transverse wave changes by π when the wave is reflected at a fixed end (Fig. 5B). Because a domain wall can be decomposed into transverse spin waves, the phase change corresponds to a change in the domain wall angle φ upon reflection (see Fig. 5C for schematics). The most important feature in Fig. 5A is that the distance Δq (defined as a positive value) for the backward domain wall motion strongly depends on the magnitude and sign of τf/τd. For a positive τf/τd, Δq is small and the domain wall annihilates soon after it reaches the sample edge. On the other hand, for a negative τf/τd, Δq is large, which in turn causes a noticeable switching back behavior, as shown in Fig. 4E. For a domain wall moving along the left edge (parallel to the y axis), where the Bloch-type domain wall is stabilized by Hx, it experiences a similar reflection process due to the same symmetry of domain wall angle and SOT (see section S4).
Fig. 5. Domain wall reflection in one-dimensional model.

(A) Temporal evolutions of the domain wall position q at various FLT to DLT ratios (τf/τd = c⊥/c||) for c|| = −0.07, J = 6 × 10¹¹ A m−2, and μ0Hx = −200 mT. Δq is the distance for the backward motion of a reflected domain wall. Schematic illustrations of the reflection of a transverse wall at a fixed end (B), and the reflection of a domain wall at an edge (C). (D) Temporal evolutions of domain wall angle φ and domain wall position q for τf/τd = −2. Domain wall angles φstd, φM, φref, and φ0 are defined in (C) and (D) (see the text for details). (E) φref, φ0, and φstd as a function of τf/τd. (F) Δq as a function of τf/τd.
We adopt the collective coordinate approach for the domain wall position q and domain wall angle φ (see section S5) (42–46) to explain the dependence of Δq on the magnitude and sign of τf/τd. We define three domain wall angles, φref, φ0, and φstd (see Fig. 5, C and D): φref is the angle just after the reflection, φ0 is the angle at which the backward domain wall motion reverses to the forward motion, and φstd is the angle for the steady-state motion before the reflection. Note that φref = 2φM − φstd, where φM(≡π − tan−1(τf/Hx)) describes the domain tilting in the film plane (see Fig. 5C). Because the edge acts as a fixed end, the domain wall component transverse to the azimuthal angle φM of the magnetization is reversed upon reflection. That is, φstd, the angle of incoming domain wall, can be rewritten as φstd = φM + (φstd − φM), where the first (second) term is longitudinal (transverse) to the domain angle φM. Upon reflection, only a transverse component is reversed (that is, changes its sign), whereas a longitudinal component is conserved. Therefore, φref = φM − (φstd − φM) = 2φM − φstd.
From the collective coordinate approach, we obtain for −Hx > τf > 0 (see section S5)
| (2) |
| (3) |
| (4) |
where , , , and HK,eff is the effective anisotropy field. We find that Eqs. 2 to 4 describe general tendencies of the numerically obtained three domain wall angles with respect to τf/τd (Fig. 5E). Some disagreement for φref can be attributed to the dynamically distorted domain wall profile just after the reflection.
From the collective coordinate approach, assuming a small damping, an approximate Δq is given as (see section S5 for details)
| (5) |
where λ is the domain wall width. Figure 5F shows that Eq. 5 qualitatively describes the numerical results of the dependence of Δq on τf/τd. Note that the first term of Eq. 5 dominates over the second term (Fig. 5F). Therefore, the dependence of Δq on τf/τd is mostly governed by cos φ0/cos φref. Also note that φref changes more rapidly with τf/τd than φ0 (Fig. 5E). Therefore, the FLT dependence of φref is key to understanding a large backward domain wall motion for a negative τf/τd. From Eq. 3, the FLT-dependence of φref is described by −2 tan−1(τf/Hx) (thus, φM) in a small damping approximation, which means that the FLT affects the backward domain wall motion through its effect on φM.
DISCUSSION
We demonstrate that the FLT has a crucial role in the SOT switching and causes the anomalous switching back phenomena when it is large and its sign is the opposite to that of DLT. Our result suggests that not only DLT but also FLT should be carefully examined to achieve deterministic SOT switching. Furthermore, our result raises a question on the microscopic origin of SOT: What determines the sign correlation between DLT and FLT? To our knowledge, the sign product of DLT and FLT in all previous experiments has been negative (in our sign convention) except for a data point by Kim et al. (30), of which the spin-orbit effective field is too small to unambiguously determine the sign product. For instance, in our previous work (26), the signs of DLT and FLT vary with the oxidation of a ferromagnet, but the sign product is always negative. If this fixed sign product is true, it indicates that a single dominant mechanism is responsible for both DLT and FLT. It is in contrast to the currently widely accepted argument that the DLT (FLT) originates from the bulk spin Hall effect in a heavy metal layer (the Rashba effect at the ferromagnet/heavy metal interface). Notably, in theories for the bulk spin Hall mechanism, the sign product is positive (20) for a positive imaginary part of the spin-mixing conductance (47). On the other hand, in theories for the Rashba mechanism, the sign product is negative (17, 25).
We have demonstrated the anomalous switching back phenomena in rather large samples (a few square micrometers), which is required to obtain detectable MOKE signals. However, note that these results could be applicable to nanosized samples (a few tens of nanometers), as long as the sample size is larger than the domain wall width because the domain wall dynamics is key to the anomalous switching back phenomena.
MATERIALS AND METHODS
Sample fabrication and TR-MOKE measurements
The magnetic films of Ta (6 nm)/Co40Fe40B20 (0.8 nm)/MgO (2 nm)/SiO2 (3 nm) and Ta (3 nm)/Co40Fe40B20 (1.2 nm)/MgO (2 nm)/SiO2 (3 nm) were deposited on the thermally oxidized silicon substrates by magnetron sputtering with a base pressure of <2 × 10⁻⁹ torr at room temperature and patterned into a square of 3 μm × 3 μm or 3 μm × 6 μm. For a short pulse excitation, the ground-signal-ground (GSG) coplanar waveguide was patterned with electron-beam lithography and deposited with Ta (3 nm)/Cu (75 nm)/Ta (4.5 nm). In the stroboscopic pump-probe experiments, the pulse generator (pump) and the picosecond laser (probe) controller were synchronized by the pattern generator with a triggering frequency of 100 kHz, and each data point of TR-MOKE signal corresponded to an average of 60,000 events. The spot diameter of the laser beam was 2 μm. The reflected laser beam was measured by a balanced photodetector to obtain the MOKE signal. Measurements were carried out on three devices and showed similar results.
Micromagnetic simulations
Micromagnetic simulations were carried out by numerically solving Eq. 1 at zero temperature. The following parameters were used: Ms = 1.0 × 10⁶ A m−1, exchange stiffness constant Aex = 1.0 × 10⁻¹¹ J m−1, perpendicular anisotropy constant K⊥ = 0.9 × 10⁶ J m−3, α = 0.02, c|| = −0.07, and c⊥ = +0.28. The sample dimension for Fig. 4 was 200 nm × 200 nm × 1 nm, and the unit cell size was 2 nm × 2 nm × 1 nm. The sample dimension for Fig. 5 was 2000 nm × 50 nm × 1 nm, and the unit cell size was 2 × 50 × 1 nm3. For the current pulse, both rise and fall times were 100 ps. In our sign convention, a negative DLT efficiency (c|| < 0) induced an up-to-down switching for J > 0 and Hx < 0. For two-dimensional micromagnetic simulations (Fig. 4), we introduced an artificial defect at the bottom-left corner and considered local demagnetization fields to mimic a domain wall nucleation at room temperature.
Supplementary Material
Acknowledgments
Funding: This work was supported by the National Research Foundation (NRF), Prime Minister’s Office, Singapore, under its Competitive Research Programme (CRP award no. NRFCRP12-2013-01). K.-J.L. was supported by the NRF of Korea grant funded by the Korea government (MSIP) (2011–0027905, 2015M3D1A1070465). Author contributions: J.Y., J.H.K., and H.Y. initiated this work. J.Y. and X.Q. deposited the films. J.Y., J.H.K., and J.S. fabricated devices. J.Y. performed the switching measurements. J.M.L. characterized the films. S.-W.L., J.Y., and K.-J.L. performed theoretical and numerical studies. All authors discussed the results. J.Y., S.-W.L., K.-J.L., and H.Y. wrote the manuscript. H.Y. supervised and led the project. Competing interests: The authors declare that they have no competing interests. Data and materials availability: All data needed to evaluate the conclusions in the paper are present in the paper and/or the Supplementary Materials. Additional data related to this paper may be requested from the authors.
SUPPLEMENTARY MATERIALS
Supplementary material for this article is available at http://advances.sciencemag.org/cgi/content/full/3/4/e1603099/DC1
section S1. Stroboscopic pump-probe MOKE experiments using a picosecond laser
section S2. Characterization of magnetic films
section S3. Oscillatory SOT-induced magnetization switching: Micromagnetic simulations
section S4. Domain wall moving along the left edge
section S5. Backward motion of a domain wall reflected at an edge
fig. S1. Stroboscopic pump-probe MOKE setup.
fig. S2. Vibrating sample magnetometry and MOKE measurements.
fig. S3. Time-varying z component of the magnetization and its configurations.
fig. S4. Domain wall types formed in the two-dimensional sample.
fig. S5. Temporal evolutions of domain wall position q for the Bloch-type domain wall.
REFERENCES AND NOTES
- 1.Dyakonov M. I., Perel V. I., Current-induced spin orientation of electrons in semiconductors. Phys. Lett. A. 35, 459–460 (1971). [Google Scholar]
- 2.Hirsch J. E., Spin Hall effect. Phys. Rev. Lett. 83, 1834–1837 (1999). [Google Scholar]
- 3.Zhang S., Spin Hall effect in the presence of spin diffusion. Phys. Rev. Lett. 85, 393–396 (2000). [DOI] [PubMed] [Google Scholar]
- 4.Murakami S., Nagaosa N., Zhang S.-C., Dissipationless quantum spin current at room temperature. Science 301, 1348–1351 (2003). [DOI] [PubMed] [Google Scholar]
- 5.Sinova J., Culcer D., Niu Q., Sinitsyn N. A., Jungwirth T., MacDonald A. H., Universal intrinsic spin Hall effect. Phys. Rev. Lett. 92, 126603 (2004). [DOI] [PubMed] [Google Scholar]
- 6.Kato Y. K., Myers R. C., Gossard A. C., Awschalom D. D., Observation of the spin Hall effect in semiconductors. Science 306, 1910–1913 (2004). [DOI] [PubMed] [Google Scholar]
- 7.Wunderlich J., Kaestner B., Sinova J., Jungwirth T., Experimental observation of the spin-Hall effect in a two-dimensional spin-orbit coupled semiconductor system. Phys. Rev. Lett. 94, 047204 (2005). [DOI] [PubMed] [Google Scholar]
- 8.Valenzuela S. O., Tinkham M., Direct electronic measurement of the spin Hall effect. Nature 442, 176–179 (2006). [DOI] [PubMed] [Google Scholar]
- 9.Miron I. M., Garello K., Gaudin G., Zermatten P.-J., Costache M. V., Auffret S., Bandiera S., Rodmacq B., Schuhl A., Gambadella P., Perpendicular switching of a single ferromagnetic layer induced by in-plane current injection. Nature 476, 189–193 (2011). [DOI] [PubMed] [Google Scholar]
- 10.Liu L., Pai C.-F., Li Y., Tseng H. W., Ralph D. C., Buhrman R. A., Spin-torque switching with the giant spin Hall effect of tantalum. Science 336, 555–558 (2012). [DOI] [PubMed] [Google Scholar]
- 11.Thiaville A., Rohart S., Jué É., Cros V., Fert A., Dynamics of Dzyaloshinskii domain walls in ultrathin magnetic films. Europhys. Lett. 100, 57002 (2012). [Google Scholar]
- 12.Emori S., Bauer U., Ahn S.-M., Martinez E., Beach G. S. D., Current-driven dynamics of chiral ferromagnetic domain walls. Nat. Mater. 12, 611–616 (2013). [DOI] [PubMed] [Google Scholar]
- 13.Ryu K.-S., Thomas L., Yang S.-H., Parkin S., Chiral spin torque at magnetic domain walls. Nat. Nanotechnol. 8, 527–533 (2013). [DOI] [PubMed] [Google Scholar]
- 14.Obata K., Tatara G., Current-induced domain wall motion in Rashba spin-orbit system. Phys. Rev. B 77, 214429 (2008). [Google Scholar]
- 15.Manchon A., Zhang S., Theory of nonequilibrium intrinsic spin torque in a single nanomagnet. Phys. Rev. B 78, 212405 (2008). [Google Scholar]
- 16.Wang X., Manchon A., Diffusive spin dynamics in ferromagnetic thin films with a Rashba interaction. Phys. Rev. Lett. 108, 117201 (2012). [DOI] [PubMed] [Google Scholar]
- 17.Kim K.-W., Seo S.-M., Ryu J., Lee K.-J., Lee H.-W., Magnetization dynamics induced by in-plane currents in ultrathin magnetic nanostructures with Rashba spin-orbit coupling. Phys. Rev. B 85, 180404 (2012). [Google Scholar]
- 18.Pesin D. A., MacDonald A. H., Quantum kinetic theory of current-induced torques in Rashba ferromagnets. Phys. Rev. B 86, 014416 (2012). [Google Scholar]
- 19.van der Bijl E., Duine R. A., Current-induced torques in textured Rashba ferromagnets. Phys. Rev. B 86, 094406 (2012). [Google Scholar]
- 20.Liu L., Lee O. J., Gudmundsen T. J., Ralph D. C., Buhrman R. A., Current-induced switching of perpendicularly magnetized magnetic layers using spin torque from the spin Hall effect. Phys. Rev. Lett. 109, 096602 (2012). [DOI] [PubMed] [Google Scholar]
- 21.Jamali M., Narayanapillai K., Qiu X., Loong L. M., Manchon A., Yang H., Spin-orbit torques in Co/Pd multilayer nanowires. Phys. Rev. Lett. 111, 246602 (2013). [DOI] [PubMed] [Google Scholar]
- 22.Haney P. M., Lee H.-W., Lee K.-J., Manchon A., Stiles M. D., Current induced torques and interfacial spin-orbit coupling: Semiclassical modeling. Phys. Rev. B 87, 174411 (2013). [Google Scholar]
- 23.Haney P. M., Lee H.-W., Lee K.-J., Manchon A., Stiles M. D., Current induced torques and interfacial spin-orbit coupling. Phys. Rev. B 88, 214417 (2013). [Google Scholar]
- 24.Fan X., Celik H., Wu J., Ni C., Lee K.-J., Lorenz V. O., Xiao J. Q., Quantifying interface and bulk contributions to spin–orbit torque in magnetic bilayers. Nat. Commun. 5, 3042 (2014). [DOI] [PubMed] [Google Scholar]
- 25.Kurebayashi H., Sinova J., Fang D., Irvine A. C., Skinner T. D., Wunderlich J., Novák V., Campion R. P., Gallagher B. L., Vehstedt E. K., Zârbo L. P., Výborný K., Ferguson A. J., Jungwirth T., An antidamping spin–orbit torque originating from the Berry curvature. Nat. Nanotechnol. 9, 211–217 (2014). [DOI] [PubMed] [Google Scholar]
- 26.Qiu X., Narayanapillai K., Wu Y., Deorani P., Yang D.-H., Noh W.-S., Park J.-H., Lee K.-J., Lee H.-W., Yang H., Spin–orbit-torque engineering via oxygen manipulation. Nat. Nanotechnol. 10, 333–338 (2015). [DOI] [PubMed] [Google Scholar]
- 27.Lee K.-S., Lee S.-W., Min B.-C., Lee K.-J., Threshold current for switching of a perpendicular magnetic layer induced by spin Hall effect. Appl. Phys. Lett. 102, 112410 (2013). [Google Scholar]
- 28.Garello K., Avci C. O., Miron I. M., Baumgartner M., Ghosh A., Auffret S., Boulle O., Gaudin G., Gambardella P., Ultrafast magnetization switching by spin-orbit torques. Appl. Phys. Lett. 105, 212402 (2014). [Google Scholar]
- 29.Zhang C., Fukami S., Sato H., Matsukura F., Ohno H., Spin-orbit torque induced magnetization switching in nano-scale Ta/CoFeB/MgO. Appl. Phys. Lett. 107, 012401 (2015). [Google Scholar]
- 30.Kim J., Sinha J., Hayashi M., Yamanouchi M., Fukami S., Suzuki T., Mitani S., Ohno H., Layer thickness dependence of the current-induced effective field vector in Ta|CoFeB|MgO. Nat. Mater. 12, 240–245 (2013). [DOI] [PubMed] [Google Scholar]
- 31.Fan X., Wu J., Chen Y., Jerry M. J., Zhang H., Xiao J. Q., Observation of the nonlocal spin-orbital effective field. Nat. Commun. 4, 1799 (2013). [DOI] [PubMed] [Google Scholar]
- 32.Qiu X., Deorani P., Narayanapillai K., Lee K.-S., Lee K.-J., Lee H.-W., Yang H., Angular and temperature dependence of current induced spin-orbit effective fields in Ta/CoFeB/MgO nanowires. Sci. Rep. 4, 4491 (2014). [DOI] [PMC free article] [PubMed] [Google Scholar]
- 33.Park J., Rowlands G. E., Lee O. J., Ralph D. C., Buhrman R. A., Macrospin modeling of sub-ns pulse switching of perpendicularly magnetized free layer via spin-orbit torques for cryogenic memory applications. Appl. Phys. Lett. 105, 102404 (2014). [Google Scholar]
- 34.Legrand W., Ramaswamy R., Mishra R., Yang H., Coherent subnanosecond switching of perpendicular magnetization by the fieldlike spin-orbit torque without an external magnetic field. Phys. Rev. Appl. 3, 064012 (2015). [Google Scholar]
- 35.Taniguchi T., Mitani S., Hayashi M., Critical current destabilizing perpendicular magnetization by the spin Hall effect. Phys. Rev. B 92, 024428 (2015). [Google Scholar]
- 36.Safeer C. K., Jué E., Lopez A., Buda-Prejbeanu L., Auffret S., Pizzini S., Boulle O., Miron I. M., Gaudin G., Spin–orbit torque magnetization switching controlled by geometry. Nat. Nanotechnol. 11, 143–146 (2016). [DOI] [PubMed] [Google Scholar]
- 37.Krivorotov I. N., Emley N. C., Sankey J. C., Kiselev S. I., Ralph D. C., Buhrman R. A., Time-domain measurements of nanomagnet dynamics driven by spin-transfer torques. Science 307, 228–231 (2005). [DOI] [PubMed] [Google Scholar]
- 38.Devolder T., Hayakawa J., Ito K., Takahashi H., Ikeda S., Crozat P., Zerounian N., Kim J.-V., Chappert C., Ohno H., Single-shot time-resolved measurements of nanosecond-scale spin-transfer induced switching: Stochastic versus deterministic aspects. Phys. Rev. Lett. 100, 057206 (2008). [DOI] [PubMed] [Google Scholar]
- 39.A. P. Malozemoff, J. C. Slonczewski, Magnetic Domain Walls in Bubble Materials (Academic Press, 1979). [Google Scholar]
- 40.Saitoh E., Miyajima H., Yamaoka T., Tatara G., Current-induced resonance and mass determination of a single magnetic domain wall. Nature 432, 203–206 (2004). [DOI] [PubMed] [Google Scholar]
- 41.Thomas L., Moriya R., Rettner C., Parkin S. S. P., Dynamics of magnetic domain walls under their own inertia. Science 330, 1810–1813 (2010). [DOI] [PubMed] [Google Scholar]
- 42.Sobolev V. L., Huang H. L., Chen S. C., Domain wall dynamics in the presence of an external magnetic field normal to the anisotropy axis. J. Magn. Magn. Mater. 147, 284–298 (1995). [Google Scholar]
- 43.Kaczér J., Gemperle R., The rotation of bloch walls. Czech. J. Phys. 11, 157–170 (1961). [Google Scholar]
- 44.Boulle O., Buda-Prejbeanu L. D., Miron M., Gaudin G., Current induced domain wall dynamics in the presence of a transverse magnetic field in out-of-plane magnetized materials. J. Appl. Phys. 112, 053901 (2012). [Google Scholar]
- 45.Emori S., Martinez E., Lee K.-J., Lee H.-W., Bauer U., Ahn S.-M., Agrawal P., Bono D. C., Beach G. S. D., Spin Hall torque magnetometry of Dzyaloshinskii domain walls. Phys. Rev. B 90, 184427 (2014). [Google Scholar]
- 46.Thiele A. A., Steady-state motion of magnetic domains. Phys. Rev. Lett. 30, 230–233 (1973). [Google Scholar]
- 47.Xia K., Kelly P. J., Bauer G. E. W., Brataas A., Turek I., Spin torques in ferromagnetic/normal-metal stuctures. Phys. Rev. B 65, 220401 (2002). [Google Scholar]
- 48.Torrejon J., Kim J., Sinha J., Mitani S., Hayashi M., Yamanouchi M., Ohno H., Interface control of the magnetic chirality in CoFeB/MgO heterostructures with heavy-metal underlayers. Nat. Commun. 5, 4655 (2014). [DOI] [PubMed] [Google Scholar]
- 49.Lo Conte R., Martinez E., Hrabec A., Lamperti A., Schulz T., Nasi L., Lazzarini L., Mantovan R., Maccherozzi F., Dhesi S. S., Ocker B., Marrows C. H., Moore T. A., Kläui M., Role of B diffusion in the interfacial Dzyaloshinskii-Moriya interaction in Ta/Co20Fe60B20/MgO nanowires. Phys. Rev. B 91, 014433 (2015). [Google Scholar]
- 50.Gross I., Martínez L. J., Tetienne J.-P., Hingant T., Roch J.-F., Garcia K., Soucaille R., Adam J. P., Kim J.-V., Rohart S., Thiaville A., Torrejon J., Hayashi M., Jacques V., Direct measurement of interfacial Dzyaloshinskii-Moriya interaction in X|CoFeB|MgO heterostructures with a scanning NV magnetometer (X = Ta, TaN, and W). Phys. Rev. B 94, 064413 (2016). [Google Scholar]
Associated Data
This section collects any data citations, data availability statements, or supplementary materials included in this article.
Supplementary Materials
Supplementary material for this article is available at http://advances.sciencemag.org/cgi/content/full/3/4/e1603099/DC1
section S1. Stroboscopic pump-probe MOKE experiments using a picosecond laser
section S2. Characterization of magnetic films
section S3. Oscillatory SOT-induced magnetization switching: Micromagnetic simulations
section S4. Domain wall moving along the left edge
section S5. Backward motion of a domain wall reflected at an edge
fig. S1. Stroboscopic pump-probe MOKE setup.
fig. S2. Vibrating sample magnetometry and MOKE measurements.
fig. S3. Time-varying z component of the magnetization and its configurations.
fig. S4. Domain wall types formed in the two-dimensional sample.
fig. S5. Temporal evolutions of domain wall position q for the Bloch-type domain wall.