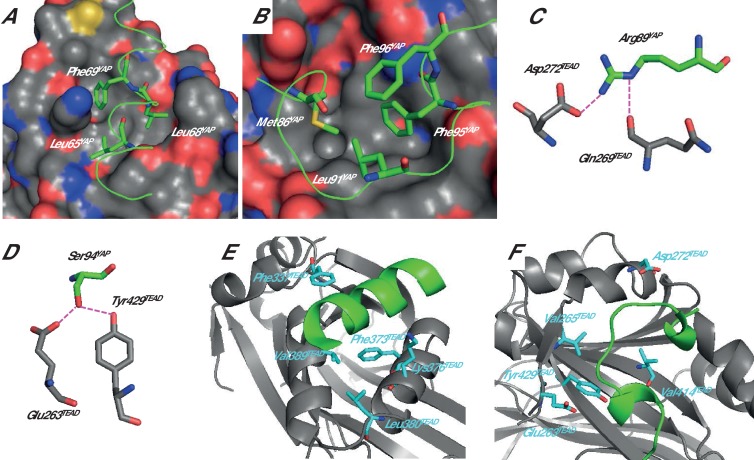
Figure 1. Structure of the YAP:TEAD complex.
The α-helix (A) and Ω-loop (B) binding interfaces. The surface of TEAD is represented and green ribbons indicate the α-helix (A, region 61–73) or the Ω-loop (B, region 85–99) of YAP. The different YAP residues that have been mutated are indicated. Interactions between hYAP Arg89 and TEAD (C) and between hYAP Ser94 and TEAD (D). The hydrogen bonds are represented by dotted purple lines. The TEAD α-helix (E) and Ω-loop (F) binding pockets. TEAD and YAP are represented by gray and green ribbons, respectively. The mutated TEAD residues for which a Kdeq has been measured are represented in cyan. These figures are drawn from the pdb structure 3KYS (Li et al., 2010). TEAD residues are labeled according to hTEAD4 primary sequence.

