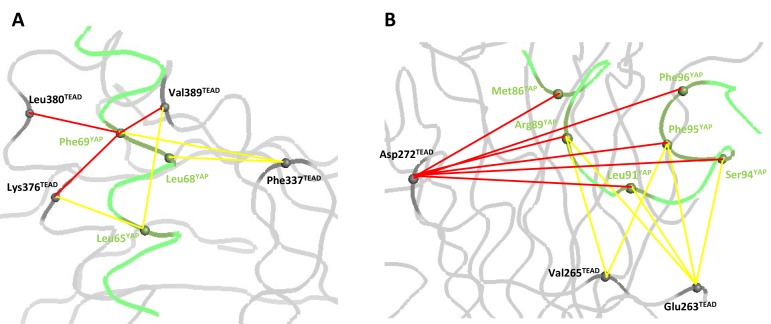
Figure 3. Coupling energies at the α-helix and Ω-loop binding pockets.
(A) α-helix interface. (B) Ω-loop interface. The gray and green ribbons represent the main polypeptide chain of TEAD and YAP, respectively. The Cα of the mutated amino acids are represented by spheres. The coupling energies (ΔΔGint) between the different residues are symbolized by lines. Yellow lines: −1 kcal/mol < ΔΔGint < −0.5 kcal/mol. Red lines: ΔΔGint < −1 kcal/mol.

