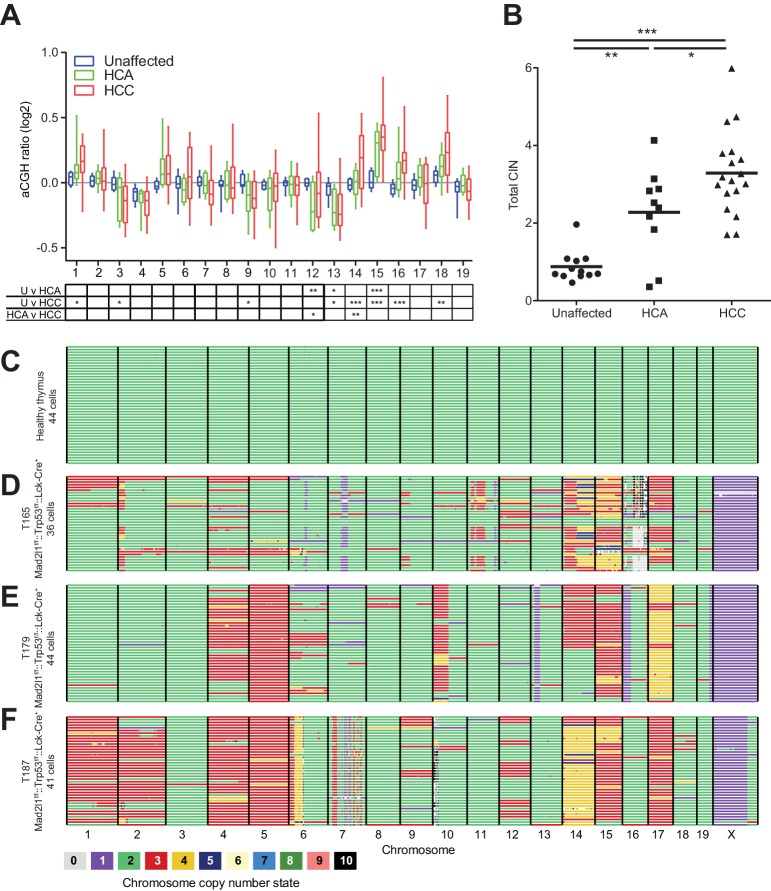
Figure 6. Mad2l1 deficiency results in clonal abnormalities despite ongoing chromosomal instability in murine T-ALL.
(A) Box and whiskers plot for each chromosome of unaffected liver (blue n = 12), HCA (green n = 10), and HCC (red n = 18) from Alb-Cre::Mad2l1f/f::Alb-Cre mice with mixed Trp53 genotypes. Statistical significance assessed by Two-way ANOVA and Tukey multiple comparison test with comparison between each group shown in the table below, *p<0.05, **p<0.01, ***p<0.001. (B) Sum of the absolute value of the aCGH ratio for each chromosome. Statistical significance assessed by One-way ANOVA and Tukey multiple comparison test, *p<0.05, **p<0.01, ***p<0.001. (C–F) AneuFinder plots revealing perfect euploidy in control thymus (45 freshly isolated T-cells (C)) and recurrent chromosomal abnormalities as well as intratumor karyotype heterogeneity in three Lck-Cre::Mad2l1f/f::Trp53f/f T-ALLs for which 46 (D), 44 (E) and 43 (F) primary tumor cells were analyzed by single cell sequencing, respectively. Colors refer to chromosome copy number state.


