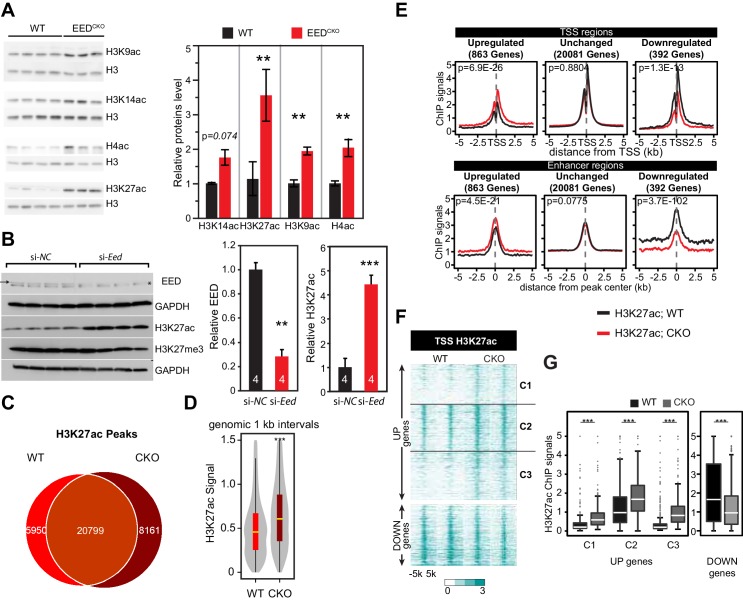
Figure 2. Eed depletion induced globally elevated histone acetylation.
(A) Global upregulation of histone H3 and H4 acetylation at different lysine residues in isolated adult cardiomyocytes from 2-month-old WT and EedCKO hearts. Histone levels were measured by immunoblotting and further quantified by normalization to total histone H3. (B) Acute EED depletion increased H3K27ac levels in HL-1 cardiomyocyte-like cells. Fully confluent HL-1 cells were transfected with TriFECTa DsiRNAs against Eed (si-Eed) or scrambled sequence-negative control (si-NC). Protein levels were measured by quantitative immunoblotting. Arrow, EED band. Asterisk, non-specific band. (C) Venn diagram showing the overlap of H3K27ac ChIP-seq peaks in isolated cardiomyocytes from WT and EedCKO hearts at 2 months of age. (D) Genome-wide distribution of H3K27ac signals. The violin plot displays H3K27ac ChIP-seq signals in 1 kb windows across the genome. Yellow horizontal lines denote median values. (E) Aggregation plots of H3K27ac ChIP-seq signals at ±5 kb of TSS (upper row) or at distal regions (lower row) of genes that were upregulated, downregulated, or unchanged by Eed inactivation. (F–G) Heat map (F) and box plots (G) of H3K27ac levels at TSS of differentially expressed genes. The row order and clustering is the same as in Figure 1J. A, B, Unpaired Student’s t-test; D,G, Wilcoxon-Mann-Whitney test. **p<0.01; ***p<0.001; NS, not significant.
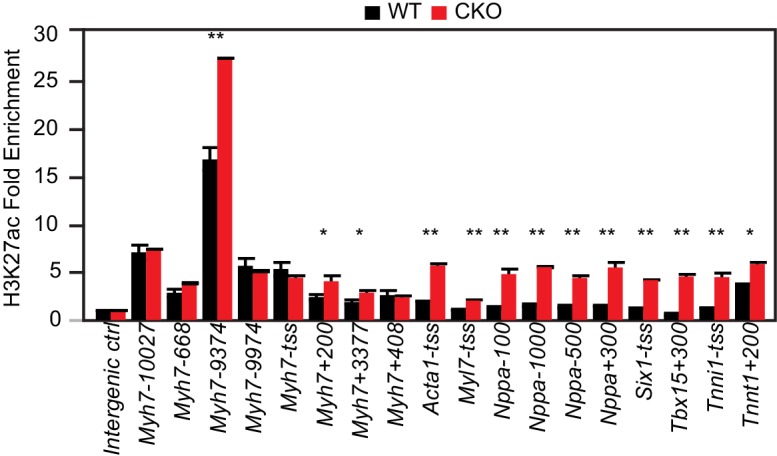
Figure 2—figure supplement 1. H3K27ac ChIP-qPCR validation.


