


Abstract
DoOP (http://doop.abc.hu/) is a database of eukaryotic promoter sequences (upstream regions) aiming to facilitate the recognition of regulatory sites conserved between species. The annotated first exons of human and Arabidopsis thaliana genes were used as queries in BLAST searches to collect the most closely related orthologous first exon sequences from Chordata and Viridiplantae species. Up to 3000 bp DNA segments upstream from these first exons constitute the clusters in the chordate and plant sections of the Database of Orthologous Promoters. Release 1.0 of DoOP contains 21 061 chordate clusters from 284 different species and 7548 plant clusters from 269 different species. The database can be used to find and retrieve promoter sequences of a given gene from various species and it is also suitable to see the most trivial conserved sequence blocks in the orthologous upstream regions. Users can search DoOP with either sequence or text (annotation) to find promoter clusters of various genes. In addition to the sequence data, the positions of the conserved sequence blocks derived from multiple alignments, the positions of repetitive elements and the positions of transcription start sites known from the Eukaryotic Promoter Database (EPD) can be viewed graphically.
INTRODUCTION
Regulation of transcription initiation was among the first successful targets of bioinformatic analyses. It is unequivocal that this regulation always involves the binding of one or more transcription factors to some parts of the promoter region (here referred to as the region upstream from the transcription start site of a gene), called transcription factor binding sites (TFBSs) (1). The sequence of the promoter region of genes can be determined experimentally, as well as the less exact positions and scope of those regions where the different transcription factors bind to the DNA. Although the experimental approach is very difficult and slow, and in most cases gives a rather ambiguous result, it soon had yielded enough data to start collecting them into databases (2,3). From the bioinformatic point of view, it was easy to suppose that predicting TFBSs would simply imply finding matches between experimentally known TFBSs and the promoter sequence. It became clear very soon, however, that it was more complicated, and even using sophisticated methods for defining TFBSs such as position-specific weight matrices gave unsatisfactory results in most cases (4).
Besides the experimental approaches to identify TFBSs in the promoter regions, several mostly string-based statistical methods have been developed to allow their ab initio prediction. As input, these methods can use promoter sequences of a set of either co-regulated or orthologous genes. The first approach has been applied with some success for example in yeast, where the in silico data are in good agreement with either the experimental results (5) or a set of well-characterized promoters (6,7). The second approach where a set of orthologous promoters are used to find conserved or over-represented motifs is called phylogenetic footprinting (8). Several examples prove that this is a good starting point to discover TFBSs (9–12).
The lack of a publicly accessible orthologous promoter database has hindered the widespread use of the phylogenetic footprinting approach. The best known Eukaryotic Promoter Database (EPD) (13) focuses rather on the specific features of the promoter regions, such as transcription start sites (TSSs), TATA-boxes, etc. than on defining orthologous sets of promoters. The Hematopoiesis Promoter Database (HemoPDB) (14) contains linked orthologous promoters, but only of those genes that are involved in hematopoiesis. There are several methods to cluster orthologous genes such as the COG database at the National Center for Biotechnology Information (NCBI) (15), the INPARANOID program (16) or the OrthoMCL (17). They are all based on an all-against-all BLAST search of protein sequences, thus it is difficult to use their data to retrieve promoter sequences. The Ensembl Genome Browser (18) provides links to orthologous genes, but they are limited to the species involved in the Ensembl system. The CORG database (19) also provides orthologous promoter sequences, but initially only from the human and mouse genomes and potentially from the species involved in the Ensembl system.
We believe that all attempts to identify functionally important motifs in upstream cis-regulatory regions of genes can largely benefit from a collection of orthologous promoter sequences. Once we have a set of orthologous upstream regions, we can locate known TFBSs, or try to predict new ones applying ab initio methods, or simply search for conserved regions. Several methods and databases are available to carry out these tasks (20), but they always require a set of orthologous genes.
We present here the first version of the Database of Orthologous Promoters (DoOP), which provides clusters of orthologous putative promoters within the phylum Chordata and kingdom Viridiplantae. The chordate and plant sections of DoOP are based on the NCBI gene annotation (21) of the human and Arabidopsis thaliana genomes, respectively. We use the first or the first two exons of genes as a query in a BLAST (22) search to find orthologous first exons. Subsequently, we extract the 500, 1000 and 3000 bp upstream regions of these orthologous first exons to build the DoOP clusters. A flow chart depicting the generation of the DoOP databases can be seen in Figure 1. The aim of the DoOP is to provide researchers with sets of orthologous promoters to facilitate the analysis of regulatory regions, including the discovery of conserved non-coding motifs.
Figure 1.

The data flow of the generation of the chordate DoOP database. The same method is used in the case of the plant DoOP database, except the source BLAST database comes from all Viridiplantae sequences and the query sequences are generated based on the NCBI A.thaliana annotation.
CONSTRUCTION OF THE DoOP DATABASE
Searching for orthologs
We chose Homo sapiens (NCBI Human Build 34 available from ftp://ftp.ncbi.nih.gov/genomes/H_sapiens) and A.thaliana (ftp://ftp.ncbi.nih.gov/genomes/Arabidopsis_thaliana/) as reference species for the chordate and plant databases, respectively. The first critical step of the database creation was to choose the most suitable query sequences. We analyzed the genome annotations provided by the NCBI, and decided to divide the query types into six main categories. These types of queries are distinguished according to the starting position of the first mRNA exon with respect to the protein-coding (CDS) sequence and the length of the first coding exon (Figure 2). In the BLAST searches we used coding sequences whenever it was possible (Figure 2, types 1–4), because the 5′-untranslated region (5′-UTR) sequences are usually less conserved than the coding regions. However, in types 5n and 6n, we had to use the sequence of the annotated 5′ fully UTR exons. To improve sensitivity, we used the sequences of the first two exons (type 6n) or the first two coding exons (types 2 and 4) if the length of the first exon was <50 bp (Figure 2).
Figure 2.

Different types of genes according to the positions of the first mRNA and coding (cds) exons. The types 5 and 6 fall into different subcategories based on the number of the first coding exon. If it is the second as in this figure, we call it type 52 or 62, but otherwise we are referring to them generally as 5n or 6n. The positions of the query sequences relative to the first exons are marked with green boxes, while the 500, 1000 and 3000 bp upstream regions that have been put into the database are marked with red boxes.
For building the local BLAST databases, we used the gss, htgs, nt and wgs sections of the NCBI BLAST databases (ftp://ftp.ncbi.nih.gov/blast/db/) and the whole genome sequences of mouse, rat, fugu, zebrafish from Ensembl (ftp://ftp.ensembl.org/pub) that were available at the end of March 2004. We built two databases by removing all mRNA (cDNA) sequences from both, and the non-chordate sequences from the chordate database and the non-Viridiplantae sequences from the plant database utilizing the NCBI taxid–gi number, phylum–kingdom assignment system (ftp://ftp.ncbi.nih.gov/pub/taxonomy/). In the case of the reference species, the 3000 bp upstream region with the first or the first two exons corresponding to the selected query sequence was used in the database. The details of the database creation, searching and processing can be found at the DoOP web pages (http://doop.abc.hu/details.html).
Processing the database
We analyzed the results of BLAST searches using Perl scripts utilizing BioPerl modules (23). First, we had made a results table (Figure 1) using a minimum threshold value of 50% for identity and 75% for the combined hit length compared to the query length. In the next step, we selected the best suitable orthologous hits with the following simple algorithm. In each species that had more than one hit, the hit with the best score was chosen. If there were two or more hits with identical scores from a species, the sequence that extended furthest to the 5′ direction relative to the hit was chosen (i.e. the one that had a longer upstream region). After the most orthologous hits were determined, 500, 1000 and 3000 bp long upstream sequences were extracted from the original database sequences if available.
In this paper we refer to the set of orthologous sequences as a cluster. In order to find conserved regions within the clusters, we generated multiple alignments. Since local alignments are better for this purpose, we chose the DIALIGN2 program that implements a segment-based alignment algorithm (24). The conserved motifs were extracted from the consensus sequences of the DIALIGN2 results using a Perl script. The putative interspersed repeats were identified in the cluster sequences using the RepeatMasker program (A. F. A. Smit and P. Green, http://repeatmasker.genome.washington.edu/) with the appropriate repeat libraries obtained from Repbase Update (25). Positions of the TSSs as annotated in the EPD database were determined in the two reference species using a BLAST-based pairing of EPD sequences with the corresponding DoOP entry. A similar method was used for the chordate database to retrieve Ensembl links and definitions of genes. The positions of the repeats and the conserved motifs along with other information such as the positions of the annotated 5′-UTRs for types 3 and 4 (Figure 2), and the TSSs were compiled together in a graphics file using BioPerl. The data obtained during database processing were fed into a MySQL database.
CONTENTS OF THE CURRENT RELEASE
Release 1.0 of DoOP databank contains practically two distinct databases, the plant and the chordate. They both reflect the sequence and annotation data that were available at the end of March 2004. The plant database contains 7548 clusters that have sequences from at least two species. This number refers to the clusters containing up to 500 bp promoter regions. The number is lower in the case of the 1000 and 3000 bp clusters (1088 and 973, respectively), because many hits, especially those from the Whole Genome Shotgun sequences section, contain <500 bp of promoter sequence depending on the position of the hit within the sequence entry. Most of the plant clusters contain sequences only from A.thaliana and Brassica oleracea. There are only 1096 clusters that contain promoter sequences of at least one species outside the Brassicaceae family. The chordate database contains 21 061 500 bp, 20 009 1000 bp and 18 911 3000 bp promoter region clusters. There are 15 178 clusters where at least one entry exists from a family other than Hominidae. A detailed database statistics is available in the DoOP web pages.
DATABASE ACCESS AND WEB CONTENT
The information that is stored in the DoOP databases can be accessed freely from the DoOP website at http://doop.abc.hu/. After selecting the chordate or the plant database section, users can search for a specific cluster or for a group of clusters. There are four text search fields, where users can enter a specific cluster ID, or a scientific taxon name, or a species taxonomy ID (taxid) from the NCBI Taxonomy database, or a keyword to search in the definition lines of the clusters. It is also possible to select a cluster (i.e. a gene) by a fast BLAT (26) search using any cDNA sequence from the reference species (H.sapiens or A.thaliana) as a query. In the next step users can select any cluster for further viewing from the results list. In the cluster view (Figure 3), among other data there is a graphical representation of the cluster sequences showing the species names, possible 5′-UTR and TSS in the reference sequence, any repetitive sequences and conserved motifs. By default the cluster view starts with the cluster of 500 bp long promoter regions (Figure 3), but users can select the 1000 or 3000 bp promoter clusters, too. It is also possible to view and save the multiple alignments and the FASTA format sequences of the clusters and the sequences of the conserved motifs.
Figure 3.
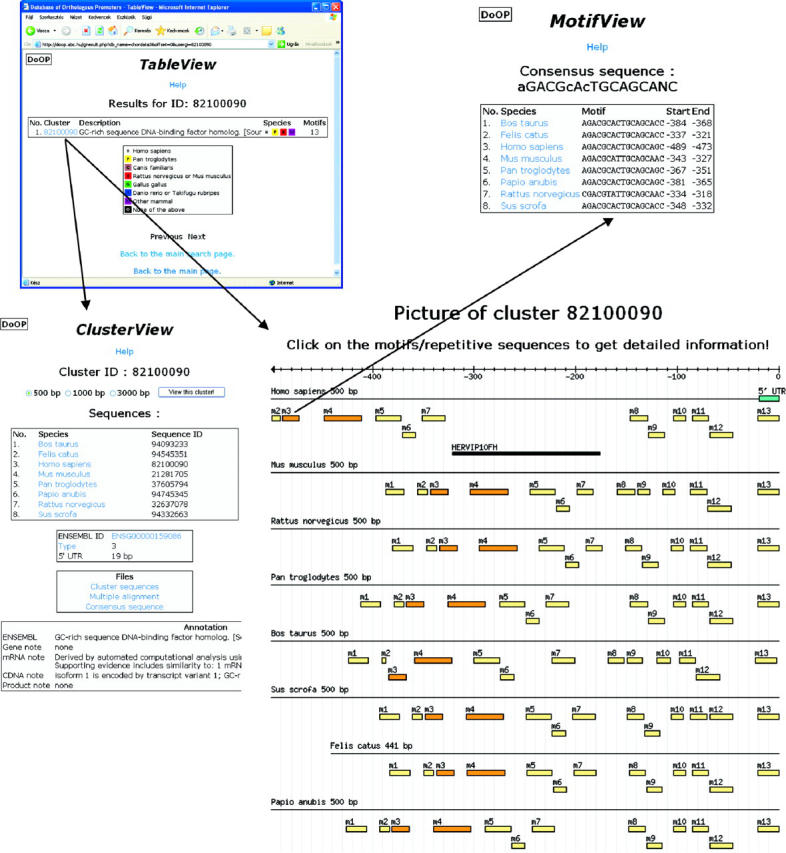
Examples of the DoOP dataviews. In the picture of the cluster the boxes numbered from m1 to m13 show the conserved motifs, the black box shows a predicted repetitive element, while the blue box shows the 5′-UTR.
CONCLUSIONS AND PERSPECTIVES
The primary aim of the DoOP is to provide an easy way to obtain clusters of orthologous promoter sequences. These cluster sequences can be a source for a more detailed analysis of possible promoter elements, including TFBSs. The data provided by the DoOP web server is also suitable for a draft view of the conserved motifs in the promoter regions of different genes.
Our method to find orthologous upstream regions relies on two important sources. The first is the genome annotation of the reference species (H.sapiens and A.thaliana). Undoubtedly, we need to have the exact positions of the first exons, including the 5′-UTR regions. We know that the annotation we had used is far from being complete. For example, there are still a lot of annotated genes (4031 in the human genome database) where the starting points of the first coding and mRNA exons are the same (types 1 and 2 in Figure 2), which is very unlikely in vivo. We expect that the genome annotation of these two reference species will be steadily bettered, thereby improving subsequent releases of DoOP as well. The second important factor of our work is the available genomic sequences, especially the number of complete genomes. It is proven that the more the sequences are available for phylogenetic footprinting, the better the result that can be achieved (27). The situation for the chordate database is quite promising, since already several mammalian whole genome sequences have been determined, and there are quite a few ongoing projects, too. Unfortunately, there are only two completed genomes from plants, A.thaliana and rice. We hope however that the sequence data appearing from the ongoing plant genome sequencing projects such as Medicago truncatula, Populus trichocarpa or tomato, will improve the plant DoOP database significantly.
This is the first release of the DoOP database. The next minor update will be available by the end of 2004. We plan to generate two databases per year in the future, which will reflect the sequence and annotation data available at the end of March and September. Our plans to improve the DoOP database include refining the BLAST searches to be more sensitive, using other methods for multiple alignments and to detect conserved motifs within the clusters, or relying more on the data of other databases such as Ensembl. The method we have developed here could also be applicable for the generation of DoOP databases based on other reference species, such as the yeast or the fruit fly.
Acknowledgments
ACKNOWLEDGEMENTS
This work was supported by Biotechnology 2001 grant BIO-0117/01 from the Central Technical Development Target Funds (Hungary). The recipients of ‘Bolyai Fellowship’ awarded by the Hungarian Academy of Sciences were E.B. and G.T.
REFERENCES
- 1.Fickett J.W. and Hatzigeorgiou,A.C. (1997) Eukaryotic promoter recognition. Genome Res., 7, 861–878. [DOI] [PubMed] [Google Scholar]
- 2.Wingender E., Chen,X., Fricke,E., Geffers,R., Hehl,R., Liebich,I., Krull,M., Matys,V., Michael,H., Ohnhauser,R. et al. (2001) The TRANSFAC system on gene expression regulation. Nucleic Acids Res., 29, 281–283. [DOI] [PMC free article] [PubMed] [Google Scholar]
- 3.Lescot M., Dehais,P., Thijs,G., Marchal,K., Moreau,Y., Van de Peer,Y., Rouze,P. and Rombauts,S. (2002) PlantCARE, a database of plant cis-acting regulatory elements and a portal to tools for in silico analysis of promoter sequences. Nucleic Acids Res., 30, 325–327. [DOI] [PMC free article] [PubMed] [Google Scholar]
- 4.Rombauts S., Florquin,K., Lescot,M., Marchal,K., Rouze,P. and Van de Peer,Y. (2003) Computational approaches to identify promoters and cis-regulatory elements in plant genomes. Plant Physiol., 132, 1162–1176. [DOI] [PMC free article] [PubMed] [Google Scholar]
- 5.van Helden J., del Olmo,M. and Perez-Ortin,J.E. (2000) Statistical analysis of yeast genomic downstream sequences reveals putative polyadenylation signals. Nucleic Acids Res., 28, 1000–1010. [DOI] [PMC free article] [PubMed] [Google Scholar]
- 6.Aerts S., Van Loo,P., Thijs,G., Moreau,Y. and De Moor,B. (2003) Computational detection of cis-regulatory modules. Bioinformatics, 19 (Suppl 2), II5–II14. [DOI] [PubMed] [Google Scholar]
- 7.Frith M.C., Fu,Y., Yu,L., Chen,J.F., Hansen,U. and Weng,Z. (2004) Detection of functional DNA motifs via statistical over-representation. Nucleic Acids Res., 32, 1372–1381. [DOI] [PMC free article] [PubMed] [Google Scholar]
- 8.Blanchette M., Schwikowski,B. and Tompa,M. (2002) Algorithms for phylogenetic footprinting. J. Comput. Biol., 9, 211–223. [DOI] [PubMed] [Google Scholar]
- 9.Lenhard B., Sandelin,A., Mendoza,L., Engstrom,P., Jareborg,N. and Wasserman,W.W. (2003) Identification of conserved regulatory elements by comparative genome analysis. J. Biol., 2, 13. [DOI] [PMC free article] [PubMed] [Google Scholar]
- 10.Gerencser A., Barta,E., Boa,S., Kastanis,P., Bosze,Z. and Whitelaw,C.B. (2002) Comparative analysis on the structural features of the 5′ flanking region of kappa-casein genes from six different species. Genet. Sel. Evol., 34, 117–128. [DOI] [PMC free article] [PubMed] [Google Scholar]
- 11.Solovyev V.V. and Shahmuradov,I.A. (2003) PromH: promoters identification using orthologous genomic sequences. Nucleic Acids Res., 31, 3540–3545. [DOI] [PMC free article] [PubMed] [Google Scholar]
- 12.Boffelli D., McAuliffe,J., Ovcharenko,D., Lewis,K.D., Ovcharenko,I., Pachter,L. and Rubin,E.M. (2003) Phylogenetic shadowing of primate sequences to find functional regions of the human genome. Science, 299, 1391–1394. [DOI] [PubMed] [Google Scholar]
- 13.Schmid C.D., Praz,V., Delorenzi,M., Perier,R. and Bucher,P. (2004) The Eukaryotic Promoter Database EPD: the impact of in silico primer extension. Nucleic Acids Res., 32, D82–D85. [DOI] [PMC free article] [PubMed] [Google Scholar]
- 14.Pohar T.T., Sun,H. and Davuluri,R.V. (2004) HemoPDB: Hematopoiesis Promoter Database, an information resource of transcriptional regulation in blood cell development. Nucleic Acids Res., 32, D86–D90. [DOI] [PMC free article] [PubMed] [Google Scholar]
- 15.Tatusov R.L., Fedorova,N.D., Jackson,J.D., Jacobs,A.R., Kiryutin,B., Koonin,E.V., Krylov,D.M., Mazumder,R., Mekhedov,S.L., Nikolskaya,A.N. et al. (2003) The COG database: an updated version includes eukaryotes. BMC Bioinformatics, 4, 41. [DOI] [PMC free article] [PubMed] [Google Scholar]
- 16.Remm M., Storm,C.E. and Sonnhammer,E.L. (2001) Automatic clustering of orthologs and in-paralogs from pairwise species comparisons. J. Mol. Biol., 314, 1041–1052. [DOI] [PubMed] [Google Scholar]
- 17.Li L., Stoeckert,C.J.,Jr and Roos,D.S. (2003) OrthoMCL: identification of ortholog groups for eukaryotic genomes. Genome Res., 13, 2178–2189. [DOI] [PMC free article] [PubMed] [Google Scholar]
- 18.Hammond M.P. and Birney,E. (2004) Genome information resources—developments at Ensembl. Trends Genet., 20, 268–272. [DOI] [PubMed] [Google Scholar]
- 19.Dieterich C., Wang,H., Rateitschak,K., Luz,H. and Vingron,M. (2003) CORG: a database for COmparative Regulatory Genomics. Nucleic Acids Res., 31, 55–57. [DOI] [PMC free article] [PubMed] [Google Scholar]
- 20.Iyer L. (2004) Conservation-enhanced prediction of transcription factor binding sites. Brief. Bioinformatics, 5, 90–92. [Google Scholar]
- 21.Pruitt K.D., Tatusova,T. and Maglott,D.R. (2003) NCBI Reference Sequence project: update and current status. Nucleic Acids Res., 31, 34–37. [DOI] [PMC free article] [PubMed] [Google Scholar]
- 22.Altschul S.F., Madden,T.L., Schaffer,A.A., Zhang,J., Zhang,Z., Miller,W. and Lipman,D.J. (1997) Gapped BLAST and PSI-BLAST: a new generation of protein database search programs. Nucleic Acids Res., 25, 3389–3402. [DOI] [PMC free article] [PubMed] [Google Scholar]
- 23.Stajich J.E., Block,D., Boulez,K., Brenner,S.E., Chervitz,S.A., Dagdigian,C., Fuellen,G., Gilbert,J.G., Korf,I., Lapp,H. et al. (2002) The Bioperl toolkit: Perl modules for the life sciences. Genome Res., 12, 1611–1618. [DOI] [PMC free article] [PubMed] [Google Scholar]
- 24.Morgenstern B. (1999) DIALIGN 2: improvement of the segment-to-segment approach to multiple sequence alignment. Bioinformatics, 15, 211–218. [DOI] [PubMed] [Google Scholar]
- 25.Jurka J. (2000) Repbase update: a database and an electronic journal of repetitive elements. Trends Genet., 16, 418–420. [DOI] [PubMed] [Google Scholar]
- 26.Kent W.J. (2002) BLAT—the BLAST-like alignment tool. Genome Res., 12, 656–664. [DOI] [PMC free article] [PubMed] [Google Scholar]
- 27.Thomas J.W., Touchman,J.W., Blakesley,R.W., Bouffard,G.G., Beckstrom-Sternberg,S.M., Margulies,E.H., Blanchette,M., Siepel,A.C., Thomas,P.J., McDowell,J.C. et al. (2003) Comparative analyses of multi-species sequences from targeted genomic regions. Nature, 424, 788–793. [DOI] [PubMed] [Google Scholar]