

SUMMARY
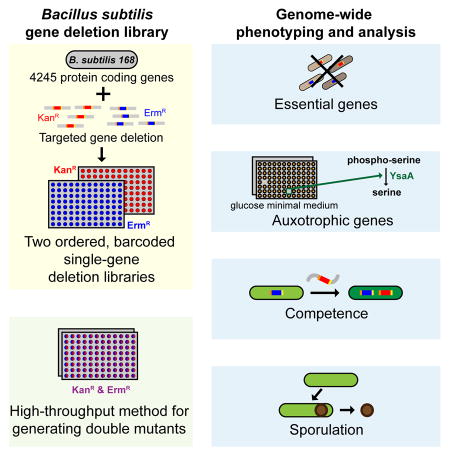
A systems level understanding of Gram-positive bacteria is important from both an environmental and health perspective, and is most easily obtained when high-quality, validated genomic resources are available. To this end, we constructed two ordered, barcoded, erythromycin-resistance- and kanamycin-resistance-marked single-gene deletion libraries of the Gram-positive model organism, Bacillus subtilis. The libraries comprise 3968 and 3970 genes, respectively, and overlap in all but four genes. Using these libraries, we update the set of essential genes known for this organism, provide a comprehensive compendium of B. subtilis auxotrophic genes, and identify genes required for utilizing specific carbon and nitrogen sources, as well as those required for growth at low temperature. We report the identification of enzymes catalyzing several missing steps in amino acid biosynthesis. Finally, we describe a suite of high-throughput phenotyping methodologies and apply them to provide a genome-wide analysis of competence and sporulation. Altogether, we provide versatile resources for studying gene function and pathway and network architecture in Gram-positive bacteria.
Graphical Abstract
INTRODUCTION
The number of sequenced bacterial genes and genomes is increasing exponentially due to new sequencing technologies and microbiome/metagenomic initiatives. Putative gene functions are automatically annotated based on sequence homology to previously characterized genes. However, even in the best-studied bacteria, Escherichia coli and Bacillus subtilis, > 30% of the genes are of unknown function or poorly characterized (Hu et al., 2009; Michna et al., 2014). This deficit limits both the ability to annotate genes by comparative genomics, and our ability to harness genomic information to understand and manipulate bacteria.
Phenotypes are key for characterizing gene function and are usually identified by studying the response of a mutant to environmental stress or genetic perturbation. In the genomics era, two approaches are broadly used to map phenotypes in a high-throughput manner: pooled screening of a randomly generated mutant library or characterization of an ordered deletion library (Brochado and Typas, 2013). Transposon mutagenesis followed by pooled screening and analysis using Tn-seq or similar deep sequencing methodologies is fast and inexpensive, and can be utilized in a wide-range of bacteria (Gray et al., 2015). However, this technique has several drawbacks: phenotype masking from cross-complementation, biases in strain abundance in the library, inability to deal with bottleneck effects in populations, and the difficulty of phenotype validation and double mutant analysis. A genome-wide ordered deletion library is labor intensive to construct, and must be carefully maintained to avoid cross-contamination, but can overcome most limitations of randomly generated libraries, as phenotypes for each mutant can be accurately quantified in isolation. Additionally, ordered barcoded libraries can be screened in pooled format, ensuring tighter control of input pool complexity and of bottleneck effects, and enabling much higher multiplexing in the sequence readout. Ordered gene deletion mutant libraries are available for several model Gram-negative bacteria (Baba et al., 2006; de Berardinis et al., 2008; Porwollik et al., 2014), and the E. coli library has been used for chemical-genomic profiling and double mutant analysis (Babu et al., 2014; Kumar et al., 2016; Nichols et al., 2011; Shiver et al., 2016).
Gram-positive bacteria are of intense interest because of their diversity of niches, adaptability to environmental extremes, and threat to human health and utility in biotechnology. Nonetheless, with the exception of a single organism with a minimal genome, Streptococcus sanguinis (Xu et al., 2011), there has been no systematic effort to elucidate gene function genome-wide in Gram-positive organisms. The Firmicute, B. subtilis is the key Gram-positive model organism, with powerful molecular, genetic and cell-biological tools, and several developmental processes: biofilm morphogenesis, competence and sporulation (Sonenshein et al., 2002). B. subtilis and its close relatives are important industrial workhorses, and several Bacillus species are pathogenic to humans. Notably, Firmicutes are one of the two most abundant phyla in the human gut microbiome, and the abundance of several of its members has been repeatedly associated with disease (Arumugam et al., 2011; El Feghaly et al., 2015; Miquel et al., 2013).
Here, we report the construction and initial analysis of two B. subtilis ordered deletion libraries in which every non-essential gene was replaced with either a kanamycin or an erythromycin resistance cassette (KanR or ErmR libraries). These libraries replace the existing single gene inactivation library (Kobayashi et al., 2003), which suffered from instability, incomplete coverage, and absence of the standard features of modern libraries. Our libraries are barcoded with easily removable antibiotic markers and suitable for double mutant analysis. We used these libraries to refine the essential and auxotrophic gene sets, to identify the genes responsible for missing steps in serine, tyrosine and phenylalanine biosynthesis and to determine genes required for low temperature growth. Additionally, we developed and implemented new high-throughput assays, including double mutant analysis, which allowed us to conduct genome wide screens for competence and sporulation, two key B. subtilis developmental programs (Table 1).
Table 1.
Summary of phenotype screens in this study.
| Screen | Outcomes | Points of screen | Related figure and/or dataset |
|---|---|---|---|
| Essential gene | * 257 B. subtilis essential genes required for growth in LB at 37 °C were defined. * Genome-wide essential gene screen by constructing deletion mutants using two different markers simultaneously. |
Detailed procedure for defining essential genes. List of B. subtilis essential genes. Condition-essentiality of 30 genes. Discussion of essentiality changes from this study. Comparison of essential genes in B. subtilis and other bacteria. |
Table S3, tab A legend Table S3, tab A; Figure 2A Table S3, tab A Table S3, tab B Table S3, tab C; Figure 2D |
| Growth phenotype | * Genome-wide relative fitness of libraries in different growth conditions. | List of relative fitness (growth phenotypes) of mutants in all conditions. | Table S4, tab B |
| Cold-sensitive (cs) phenotype | * Genes required for growth in LB at 16 °C were identified. * Data suggested that overexpression of some prophage genes are toxic in low temperature. |
List of cold-sensitive mutants and discussion about their phenotypes. Functional groups enriched in cs phenotype. |
Table S4, tab C Figure S3E |
| Auxotrophic gene | * Genome-wide auxotroph screen identified 98 auxotrophic genes in B. subtilis. | List of B. subtilis auxotrophic genes. Comparison of auxotrophic genes in B. subtilis and E. coli. |
Table S4, tab D Table S4, tab E; Figure 3B |
| Utilization of carbon (C) or nitrogen (N) source | * Genes required for utilizing specific C and N sources were identified. * Several pathway connections in B. subtilis metabolism were clarified. |
Genes required for utilization of specific C or N source. Analysis of pathways for C or N source utilization in B. subtiils. |
Table S4, tab F Figure S4 |
| Double mutant analysis | Identification of genes performing the final step of Phe and Tyr biosynthesis. | Methodology and analysis of linkage effect. New genes required for Phe and Tyr biosynthesis. |
Figure 5 Figure S5 |
| Competence | Genome-wide competence gene screen identified competence genes in B. subtilis. | List of competence defective mutants. Transformability of previously known competence defective mutants in this study. Conservation of competence genes in other bacteria. |
Table S5, tab B Table S5, tab C Table S5, tab D; Figure S6 |
| Sporulation | Genome-wide sporulation screen using colorimetric method confirmed known sporulation mutants and identified new players. | List of relative sporulation scores of mutants. List of sporulation defective mutants. Functional groups enriched in sporulation phenotype. Conservation of sporulation genes in other bacteria. |
Table S6, tab A Table S6, tab B Figure 6E Table S6, tab E; Figure S7C |
RESULTS AND DISCUSSION
Construction of single gene deletion libraries of B. subtilis 168
We constructed two comprehensive single gene deletion libraries of the B. subtilis 168 genome (RefSeq: NC_000964.3) based on its natural competence for transformation by linear DNA fragments (Figure 1A). We targeted 4245 genes for replacement by erythromycin (bacteriostatic) and kanamycin (bactericidal) resistance cassettes. In general, we replaced the entire protein coding sequence except for the start and stop codons. To minimize functional interference, we maintained at least 21 bp of sequence between the antibiotic resistance cassette and flanking genes, modifying the precise deletion endpoints to maintain this spacing for closely spaced or overlapping genes, or to maintain transcriptional terminators that overlap stop codons (STAR Methods and Table S1).
Figure 1. Overview of construction of single gene deletion libraries in B. subtilis.

(A) Left: Workflow of mutant construction and essential gene validation. Right top (green): Construction of DNA fragments to replace target genes. The plasmid encoded antibiotic resistance cassette (ErmR or KanR) was amplified with Ab-F and Ab-R, each consisting of a random barcode sequence flanked by UP (Universal priming) sequences. About 1kb of the 5′ and 3′ flanking sequences of the target gene were amplified by 5pL/5pR and 3pL/3pR respectively. The purified antibiotic resistance cassette and its flanking regions were joined, amplified, and transformed into the wild-type strain. Right bottom (blue): Schematic procedure for barcode identification. Within each library, mutants were pooled in 9 groups as denoted by color code according to their position in 96 well plates. Sequencing libraries were prepared and sequenced as described in STAR methods. Mutant specific barcodes were identified by mapping the sequencing reads onto the B. subtilis genome. Cross-contamination was indicated when mutant barcodes were present in pools that should lack the mutant. Detailed procedures are described in STAR Methods.
(B) Structure of the antibiotic resistance cassettes. UP1~4, universal priming sequence; BC1 and BC2, mutant specific barcodes; lox71 and lox66, Cre recombinase recognition sites used for excision of the antibiotic resistance cassette. A150 bp scar sequence after Cre mediated excision of antibiotic resistance cassette is shown at the bottom. The lox72 sequence remaining after recombination between lox71 and lox66 is indicated.
Using our high-throughput transformation pipeline, we obtained 10–1000 colonies/transformation, except for when the target was an essential gene. In toto, we obtained 3967 replacements with both antibiotics, as well as four replacements with either ErmR or KanR only, resulting in 3968 ErmR and 3970 KanR mutants. We purified four independent clones of each strain, retained two as frozen stocks, identified barcodes for both isolates (Table S2), and replaced all clones that failed rigorous quality control standards (STAR Methods). We found only two cases of cross-contamination, underlining the high quality of the library and it suitability for further global phenotypic analyses. In contrast to the previously reported E. coli and S. sanguinis libraries (Baba et al., 2006; Xu et al., 2011), we found no instances of gene duplication, either because we did not enhance recombination during library construction or because of organism-specific differences.
Several features of our antibiotic resistance cassette facilitate downstream analysis (Figure 1B). First, the antibiotic cassettes lack a transcriptional terminator, so that downstream genes in the operon can be transcribed. Second, because transcription from the cassette promoters may modify downstream gene expression and alter phenotypes, the cassette can be excised to alleviate such effects using Cre recombinase sites (Figure S1). Third, Cre cannot utilize the small scar that remains after excision; this facilitates constructing strains with multiple gene deletions (Yan et al., 2008), as demonstrated by making a strain with 10 gene deletions from our library (Meeske et al., 2015). Finally, the barcodes and universal priming sites flanking the Cre recognition sites enable ultra-high-throughput deep sequencing approaches, as recently described for RB-Tn-Seq (Wetmore et al., 2015).
To demonstrate the utility of this approach, we determined the phenotypes of the individual mutants comprising both libraries from almost all tested conditions. This allowed us to pinpoint library specific differences and to report high-confidence phenotypes, i.e. those in common between both libraries. We find high concordance between the two libraries. Discrepancies are rare and probably reflect differential downstream effects of the different antibiotic resistance cassettes or suppressor mutants. Conducting large-scale screens with both libraries largely obviates the problem of false positives. Besides facilitating phenotype validation, two libraries are necessary for high-throughput double mutant analysis (see below).
The essential gene set
We established the essential gene set in LB at 37°C by starting from the 274 genes that either failed to give transformants after ≥2 independent attempts with validated PCR products, or produced tiny transformants that did not regrow. Genes that could not be replaced due to secondary effects (e.g. overexpression of an adjacent lethal product by transcription from the promoter of antibiotic resistance gene) and putative new essentials that could not be complemented were excluded from the essential set (see Table S3). We confirmed that new non-essentials lack a copy of the gene that was deleted (STAR Methods).
In toto, we defined 257 essential protein-coding genes enriched in several functional categories related to core processes and growth (Figure 2A), including three genes of unknown function: ylaN encodes a alpha-helical bundle protein (Xu et al., 2007); yneF encodes a methionine-rich small protein; and yqeG encodes a putative HAD family phosphatase (UniProt, 2015) (Table S3). Compared to the 253 essential genes in the SubtiWiki compendium (http://subtiwiki.uni-goettingen.de/wiki/index.php/Essential_genes), we report 29 new essential and 25 new non-essential genes (Figure 2B and Table S3). Differences likely reflect the fact that ours is the first systematic, high-resolution gene deletion set in B. subtilis, constructed in a single background strain with consistent techniques by one group. Of the 257 genes essential in LB medium, 30 are not essential in some other growth condition or genomic context (Table S3). LB may have an insufficient amount of particular compounds; e.g., ylaN requires higher iron than the amount present in LB (Figure S2) or may lack a compound that could bypass the need for that gene product; e.g., eno, pgm, gapA and alrA (Commichau et al., 2013; Heaton et al., 1988)). Some gene products are essential only at high growth rates typical of LB at 37°C [(smc and scpA), (Gruber et al., 2014)], and these may not be essential in the natural soil environment, where B. subtilis grows slower. Finally, some genes are non-essential in specific genetic backgrounds; e.g., antitoxins can be deleted in strains lacking their cognate toxin gene. Our rationale for the updated list of essential genes is described in detail in Table S3.
Figure 2. The B. subtilis essential gene set.

(A) Functional categories of B. subtilis essential genes. Pie chart (left) indicates COG based classification of essential genes. Each color represents a COG class ID described at the right. Gradient red colors outside the pie chart represent enrichment of each category. Bottom table: enriched functional categories of essential genes with their Bonferroni corrected p-value.
(B) A Venn diagram comparison of the essential genes from SubtiWiki and our study.
(C) Phylogenetic tree of bacteria representing the distance among B. subtilis, S. aureus, S. sanguinis and E. coli. Two phyla, Firmicutes and Proteobacteria are highlighted by blue and yellow circles respectively. Tree was generated from NCBI Taxonomy and visualized in iTOL (Letunic and Bork, 2016).
(D) Conservation and essentiality of orthologs of B. subtilis essential genes in E. coli, S. aureus and S. sanguinis. Top: Orthologs of B. subtilis essential genes in other bacteria were identified by pairwise comparison of their protein sequences as determined from their genomic sequences. Genes were grouped by their conservation and essentiality in other bacteria: i. essential in all four bacteria; ii. conserved in all four bacteria; iii. missing in at least one bacterium. Bottom: Pie charts indicate the distribution of functional categories of genes in each group colored according to their COG class IDs shown in (A). The enriched functional categories in each group are indicated by letter in the pie chart; description of enriched functional categories and their Bonferroni corrected p-values are indicated under the pie chart. See also Figure S2 and Table S3.
Previous comparative studies of essential gene sets (essentialomes) among microbes revealed that the number of essential genes does not scale with genome size; that essential genes are enriched in cell proliferation-related genes; and that essential genes are preferentially located in operons, usually as the first gene in its operon (Grazziotin et al., 2015). Clade-specific essential genes are usually attributed to distinct surface structures, such as the outer membrane biosynthesis genes in Gram-negative bacteria and teichoic acid biosynthesis genes in Gram-positive bacteria. Having clarified the B. subtilis essentialome, we revisited this analysis by comparing the essential genes in four microbes, separated by a billion years of evolution (Figure 2C). Three had “gold-standard” essential gene sets in which targeted gene deletion libraries were used to identify genes required in rich medium [B. subtilis (Firmicutes), S. sanguinis (Firmicutes) and E. coli (γ-proteobacteria)] (Baba et al., 2006; Kato and Hashimoto, 2007; Xu et al., 2011; Yamamoto et al., 2009). The fourth, S. aureus (Firmicutes), was defined by transposon mutagenesis. To minimize S. aureus false positives, we considered the essential gene-set as those essentials present in two independent transposon libraries (Chaudhuri et al., 2009; Santiago et al., 2015).
More than half of the B. subtilis essential genes are essential in the other three bacteria, indicating high conservation of essential genes even in distantly related bacteria (Figure 2D, top). Genes involved in translation/ribosome structure and biogenesis are highly enriched (p=1.8×10⁻⁴) in this subset (Figure 2D, bottom). An additional 25% of the B. subtilis essential genes are present in the other three and variably essential, indicating that they are broadly conserved and important. Interestingly, conservation of essentiality has little to do with phylogeny: the overlap of B. subtilis essentials to closely related S. sanguinis and distantly related E. coli is similar. Broadly distributed genes may not be essential in B. subtilis because of the presence of paralogs (e.g. thrS and thrZ paralogs in B. subtilis), differences in the complement of essential nutrient transporters (e.g. E. coli lacks a riboflavin transporter), different physiological requirements in different growth conditions (e.g. LB vs TSA), or distinct morphological requirements (e.g. mreC and mreD are essential only in rod shaped bacteria). The 25% of the B. subtilis essential gene set not present in at least one of the other three bacteria is enriched in poorly characterized genes (p=6.1×10⁻⁵) and in inorganic ion transport/metabolism (p= 2.6×10⁻⁴). Their lower conservation results from group-specific essential cell structures and physiology (e.g. envelope and cell division), functionally analogous genes that perform some steps in a pathway, and completely different pathways that carry out the same process (e.g. both the methylerythritol 4- phosphate (MEP) and mevalonate pathways (Heuston et al., 2012) perform isoprenoid biosynthesis). Detailed results are in Table S3.
In summary, 75% of the B. subtilis essential genes are universally present and 50% are universally essential in our four-organism test set, spanning from E. coli to B. subtilis. In contrast, only 13% of B. subtilis genes overall are universally present in the other three organisms. The variably conserved essentials include the 4% of the essential genes that are B. subtilis-specific, all of which alleviate the lethal activity of other genes (e.g. anti-sigma, anti-toxin, prophage repressor). It is likely that all organisms have a cadre of organism-specific essential genes that improve viability in their natural environment.
Growth phenotypes in rich medium
In this study, we used the integrated colony opacity (Kritikos et al., in revision) to calculate the relative fitness (RF) of each strain in an arrayed screen of the ErmR and KanR libraries (1536 mutants/plate). LB at 37°C is taken as our standard condition (Table S4), and phenotypes in other conditions are presented as normalized relative fitness (nRF) values: fitness of a strain in condition X relative to that in the standard condition (STAR Methods).
The fitness phenotypes on LB at 37°C were reproducible within and between the ErmR and KanR libraries (r>0.67 and r=0.49; Figures S3A and S3B) with inter-library correlation dropping mostly due to technical reasons and several clone discrepancies. Gene set enrichment analysis [GSEA, (Subramanian et al., 2005)] indicates that slower growing strains are enriched in the energy production/conversion and translation functional categories (p<0.05, Figure S3C). Notably, coenzyme metabolism/transport genes are also enriched among slower growing strains, suggesting that LB does not have an optimal balance for some cofactors or that cofactors are not taken up well by B. subtilis.
We also measured relative fitness at 16°C to identify cold-sensitive mutants (Figure S3D and Table S4). We found enrichment of several gene categories including translation/ribosome structure and biogenesis and cell cycle control/division/chromosome partitioning (Figure S3E and Table S4).
Growth phenotypes in minimal media
Identification of genes essential for growth in minimal media is important for understanding metabolic pathways and their regulation, and provides crucial foundational information for metabolic engineering. B. subtilis auxotrophs had previously been inferred from gene annotation. We identified auxotrophic genes by probing the library in glucose-ammonium minimal medium, supplemented with tryptophan to complement the trpC mutation in B. subtilis 168 (Figure 3A, Table S4). We defined 98 auxotrophs (STAR methods): 93 experimentally identified auxotrophs, predominantly deleted in known biosynthetic enzymes, but also including ysaA, a poorly characterized gene, and the 5 annotated tryptophan synthesis genes. Auxotrophic genes in B. subtilis are as highly biased to the leading strand (91%, p=3.9×10⁻⁵) as essential genes (91%, p=5.6×10⁻¹³), compared to the leading strand bias of all genes (74%). In contrast, E. coli auxotrophic genes lack strand bias, but multi-responsive genes, i.e. genes required in many conditions, are biased towards the leading strand (Nichols et al., 2011). Thus in bacteria, strand bias is thought to be driven by gene essentiality or importance (Nichols et al., 2011; Zheng et al., 2015). The head-on collisions of the replication and transcription machines resulting from lagging strand transcription are deleterious in general and especially deleterious in B. subtilis (Merrikh et al., 2012). The strand bias of B. subtilis auxotrophic genes would be explained if these genes are essential/important for growth in the natural soil habitat of B. subtilis.
Figure 3. Profiling of strain fitness in minimal media.

The ErmR and KanR libraries arrayed in high-density (1536/plate) were grown in minimal media with different C or N source. We used integrated colony opacity (Iris; Kritikos et al.) to calculate the normalized relative fitness (nRF) of each mutant (colony opacity of mutant)/(median colony opacity in plate). Data were processed as described in STAR methods and are listed in Table S4.
(A) Scatter plot of the nRF of ErmR and KanR mutants in glucose minimal medium at 37°C. We defined as auxotrophs mutants with an nRF <0.3 in both libraries (red square).
(B) Comparison of auxotrophic genes in B. subtilis and E. coli. Orthologs were identified by pairwise protein sequence allignments using NCBI BLAST. The Metacyc database (Caspi et al., 2014) was used for functional annotation of genes and pathway analysis. The colors represent conservation, essentiality and auxotrophy of genes in each bacterium. The reasons for discordance in auxotrophy between orthologs are described to the right of the chart. The numbers of auxotrophic genes in each category for B. subtilis (black) and E. coli (blue) are indicated.
(C) Heat map representation of nRF of 3911 KanR mutants (x-axis) in 13 minimal media conditions and in defined rich medium (y-axis).
See also Figure S3 and S4, and Table S4.
Comparison of the 98 B. subtilis and the 86 E. coli experimentally identified auxotrophic genes (Nichols et al., 2011) indicated an overlap of only 55 genes (Figure 3B and Table S4). This number increased to 59, when the four B. subtilis auxotrophs that are essential in E. coli (folD, pgk, purB and gpsA) were included, and to 72 when paralogs and redundant pathways were taken into account. The remaining differences reflect genes encoding non-homologous isofunctional enzymes and unique auxotrophic genes including transcriptional regulators (gltC in B. subtilis and lysR and metR in E. coli). This diversity may reflect divergent and convergent evolution of enzymes according to their niches (Galperin and Koonin, 2012).
By profiling the mutant library on seven additional C and six N sources, we identified 40 additional genes required for utilization of particular C and N sources and pathway connections in B. subtilis central metabolism (Figure 3C, S4 and Table S4).
Identification of the previously uncharacterized gene, YsaA, as a phosphoserine phosphatase
In addition to large-scale screens, our libraries may be used to identify the physiological functions of previously uncharacterized genes. As demonstration of this utility, we focused on ysaA, which was the only new auxotrophic gene of unknown function. To guide identification of its pathway defect, we grew the ysaA mutant in various combinations of amino acids. We found that the ysaA, serA, and serC mutants have virtually identical profiles when observed across all the conditions we studied, likely placing YsaA in the serine biosynthesis pathway. For example, like other mutants disrupted in serine biosynthesis, the ysaA defect was complemented by glycine, or a combination of serine and other amino acids such as glutamine or glutamate. The inability of serine alone to rescue the growth defect of the serA, serC, or ysaA mutants is due to serine toxicity (Lachowicz et al., 1996) (Figure 4A).
Figure 4. Identifying the function of YsaA.

(A) Growth of ysaA, serA, serC and wild-type in various defined media are shown as a heat map. Values are based on average of duplicate determinations of the OD600 of each strain after 18hr in glucose minimal media supplemented with various metabolites and pools of metabolites. Amino acids are represented by their single letter code. Abbreviations: AA: amino acids; NUC: nucleoside bases; VIT: vitamins; L-A: L-alanine; D-A: D-alanine; HS: homoserine; SHK: shikimate; Ade: adenine; Cyt: cytosine; Gua: guanine; Ura: uracil; DAP: diaminopimelic acid; B1: vitamin B1; PABA, p-amino benzoic acid.
(B) Serine biosynthesis pathway. Known enzymes catalyzing each step in B. subtilis (red) and E. coli (blue) are shown. The function of YsaA (bold) was identified as part of this study.
(C) Saturation curve for phosphoserine phosphatase activity of YsaA.
(D) Steady-state kinetic parameters for YsaA against four putative substrates.
(E) Epistatic interaction of ysaA with serA and serC in B. subtilis is shown by comparing plates with (right) or without (left) serine.
(F) Complementation of B. subtilis ysaA with either B. subtilis ysaA or with E.coli serB, each integrated at the B. subtilis amyE chromosomal locus, and controlled by an IPTG inducible promoter (Pspank).
(G) Complementation of E. coli serB growing in glucose minimal medium with multicopy plasimids expressing B. subtilis ysaA (pDR_yasA) or E.coli serB (pDR_serB).
In E. coli, serine is synthesized either by the GlyA-catalyzed conversion of glycine to serine, or from 3-phosphoglycerate via three enzymatic steps catalyzed by SerA, SerC and SerB (Figure 4B). Although a serB homolog had not been identified in B. subtilis, ysaA encodes a haloalkanoate dehalogenase superfamily phosphatase. This suggests that ysaA may be the B. subitilis equivalent of serB. Accordingly, we examined the phosphohydrolase activity of YsaA in vitro, screening YsaA against a library of 167 phosphorylated substrates with a stop-point colorimetric assay (Huang et al., 2015). YsaA showed phosphatase activity against phosphoserine, phosphothreonine, phosphoethanolamine and histidinol phosphate. We measured steady-state kinetic parameters against these substrates and found that YsaA had the highest substrate specificity for phosphoserine with a kcat/Km of 6.9 × 10⁴ M−1s−1 (Figure 4C and 4D), and with a Km of 0.116 mM, similar to that of E. coli SerB (Km = 0.097 mM) (Kuznetsova et al., 2006).
There is also genetic evidence that ysaA and serB are functional equivalents. As expected from genes in the same pathway, epistasis experiments show that the ysaA-serA and ysaA-serC double mutants grew equivalently to each single mutant strain in glucose-glutamate minimal medium supplemented with serine (Figure 4E). Moreover, although they lack significant amino acid sequence identity, ysaA complements E. coli serB and vice versa (Figure 4F and 4G), demonstrating that YsaA and SerB are interchangeable in vivo. Given these observations, we rename ysaA as serB.
High-throughput double gene mutant generation
We developed a high-throughput method for generating double mutants in B. subtilis based on its natural competence (STAR Methods). The major experimental challenge was the asynchronous development of competence due to the widely different growth rates of the library in competence medium. We solved this problem by adding DNA at the time of inoculation and growing overnight prior to enriching for transformants (Figure 5A). KanR hisC genomic DNA successfully transformed 3811 of 3899 ErmR gene deletion strains (69 strains were missing from this screen), indicating that our method is suitable for high-throughput generation of double mutants. As hisC contributes to the last step of phenylalanine (Phe) and tyrosine (Tyr) biosynthesis, as well as histidine (His) biosynthesis, we were able to use the results of this screen to identify double mutants that required Phe/Tyr as well as His to grow. Coupled with downstream analysis, we found that yhdR, renamed pheC, is a major aminotransferase catalyzing this reaction and that AspB also plays a minor catalytic role in producing Phe and Tyr (Figure S5 and Table S5).
Figure 5. High-throughput transformation with genomic DNA.

(A) Schematic procedure for high-throughput double mutant generation. ErmR mutants arrayed in 384 format on MC agar plates were resuspended in liquid competence medium, mixed with genomic DNA from donor (KanR) and incubated for 16 hr. Transformants were then enriched by adding LB and kanamycin and incubation for 6 hours further. Note that mutants with only KanR can also be generated by replacement of ErmR region with its original wild-type sequence, which results from co-transformation of wild-type piece of genomic DNA (congression). Following enrichment for transformants on Kan, double mutants (KanR + ErmR) were selected on both erythromycin and kanamycin. The steps in liquid medium are highlighted in yellow. The genome-wide screen was performed with hisC:kan.
(B) The minimum distance between deletions in a double mutant was assessed by determining the fraction of mutants in the amyE or gmuD neighborhood that maintained their ErmR antibiotic marker after transformation with amyE::KanR and gmuD::KanR genomic DNA. This experiment was performed according to the protocol in (A) except that the enrichment step was eliminated to obtain an accurate estimation of the number of transformants that retained both markers. Top - Genomic context of the amyE and gmuD loci. Middle - Quantitative representation of the results. A bar graph indicating the fraction of double mutants among total transformants. Results at the amyE locus left and the gmuD locus-right. Bottom - Qualitative representation of the results. Direct plating of the double mutants in each transformation presented in the bar graph. Each plating is in duplicate from technical replicate cultures.
See also Figure S5 and S6, and Table S5.
Double-mutant analysis is generally limited by linkage, which precludes constructing double mutants that are nearby on DNA because one of the two mutants will be recombined out. We determined the genetic distance necessary to obtain double mutants at reasonable frequency by systematically introducing a second mutation to a strain in which an adjacent or near adjacent gene was marked with a different antibiotic marker. Using two different genomic contexts (amyE, and gmuD), we found that the gene immediately adjacent to the locus being transformed lost its existing antibiotic marker, but those only two or three genes away maintained their markers to a large degree (>20%) (Figure 5B). The efficiency reached ~40% at a distance of 3 genes (~2 Kb), at which point there is a negligible effect on the resultant double mutant strains. Thus, linkage effects are minimal compared to other microbes (50–200 Kb in E. coli, fission or budding yeast) (Collins et al., 2006; Roguev et al., 2007; Typas et al., 2008), enabling such high-resolution coverage of genetic interactions for the first time. We anticipate that this methodology and our libraries will be used extensively in the future for high-throughput genetic interaction profiling in B. subtilis.
Competence
Competence is an important developmental state in B. subtilis, but no genome-wide screens have been performed to identify all the players necessary for DNA uptake and other steps in the process. Using our new high-throughput method for generating double mutants, our transformation of the ErmR gene deletion library with hisC::kan genomic DNA) identified 88 mutants that failed to be transformed (Table S5). These 88 mutants included most identified competence genes. Because this qualitative assay contains an enrichment step, it cannot score gradations of competence. Fifteen known competence-defective mutants, mostly involved in signaling pathways to regulate ComK (Hamoen et al., 2003) were deemed competent proficient in this assay, likely because they reduced, rather than abolished competence (Table S5).
To provide further semi-quantitative competence information, we compared competence with and without enrichment (STAR Methods). Testing the competence mutant candidates identified from the genome-wide screen described above and strains missing from that screen yielded 61 non-transformable or poorly transformable strains, of which 34 were previously known to be competence defective (Table S5). These 34 genes are involved in DNA uptake and recombination, membrane proteolysis, mRNA degradation and control of the amount, activity and stability of ComK, the master competence regulator. The remaining 27 competence defective strains are comprised of 9 strains that are strong candidates for new competence genes, and 18 strains that are growth impaired and did not reach the cell density required for competence development in our medium. Of these 9 new putative competence genes, 4 are also involved in other processes (greA, prmC, pgi and ptsI) but are likely to also have a competence specific role and are present in all naturally transformable strains we queried (Figure S6 and Table S5). The other 5 are poorly characterized and confined to Bacillales. Since the regulation of competence development diversifies rapidly even within the same genus, we suggest that the function of these genes is related to B. subtilis-specific competence development.
Sporulation
Sporulation is the major developmental pathway in Bacilli and Clostridia, and an important survival strategy for both pathogenic and microbiome members of these genera (Browne et al., 2016; Jedrzejas, 2002). This pathway has been heavily studied, starting with the isolation of individual mutants that do not sporulate. In B. subtilis, such studies had identified the key sporulation-related transcription factors, regulons, and inter-compartmental communication strategies (Higgins and Dworkin, 2012). Nearly 25% of the genome has been associated with this process [~1000 genes; (Eijlander et al., 2014)]. However, lack of a comprehensive mutant library, and a high-throughput assay had prevented genome-wide sporulation phenotyping. We developed a high-throughput assay to assess sporulation based on the dark brown color produced by sporulating cells in minimal medium at a late stage of sporulation (Driks, 1999) (Figure 6A and STAR Methods), and then applied it to our mutant library to determine the relative contributions of known and new sporulation genes in our two libraries (Table S6).
Figure 6. Genome-wide screening of sporulation in B. subtilis.

(A) Sporulation phenotypes and colony size were automatically quantified using Iris (Kritikos et al.) after 45 hr of growth on succinate-glutamate minimal agar plates supplemented with limiting amounts of nutrients. Top: A representative sporulation plate image is shown. Bottom left: A zoomed-in portion of the 1536 colony array image processed with Iris is shown at the lower left. The raw sporulation score is calculated from the color intensity in the center area of the colony (red circle). Bottom right: Color-coded relative sporulation scores (rSS) of each mutant in the zoomed-in portion are shown. rSS was calculated by following equation, rSS = (sporulation score of mutant)/(median sporulation score in plate). For details see STAR Methods.
(B) Reproducibility of rSS from two technical replicates of the KanR library.
(C) The rSS of ErmR and KanR mutants is shown by scatter plot, with the sporulation scores of 101 known sporulation mutants indicated in red color. A density plot (above) indicates the relative distribution of known mutants compared to all genes in B. subtilis.
(D) Using a 5% false discovery rate (FDR), 70% of the known sporulation mutants were recovered in this screen.
(E) COG functional groups enriched in sporulation defective mutants (p<0.05). A violin plot showing the distribution of the rSS of genes by functional group with the total member of genes in each category indicated. Width represents the probability density of the data at a given rSS. D, cell cycle control, cell division, chromosome partitioning; J, translation, ribosome structure and biogenesis; M, cell wall/membrane/envelope biogenesis; N, cell motility; T, signal transduction
(F) Distribution of the rSS of genes positively regulated by mother cell sporulation sigmas (SigE and SigK; red), forespore sigmas (SigF and SigG; blue) and Spo0A (yellow). Total member of genes in each category is indicated. Sigma regulons enriched in sporulation defective genes are indicated by *, p-value <0.05); n.s., not significant.
Our sporulation assay was reproducible (r>0.9 for technical replicates and r=0.68 for biological replicates from the two libraries) and captured the majority of the known sporulation mutants (Figure 6B, 6C and S7A). Poorly growing and non-reproducible mutants were filtered from the dataset and removed from subsequent analysis (STAR Methods, Figure S7B and Table S6). Of the 101 known sporulation mutants present in the filtered data, we recovered 71 at 5% FDR and 79 at 10% FDR (Figure 6D). We did not expect to recover 10 of the remaining 22 sporulation mutants either because they had medium-specific defects or because they were involved in producing dipicolinic acid for spore heat resistance, a step that is independent of pigment development. We recovered genes encoding the quorum-sensing peptides phrA and phrE, transcriptional regulators and sporulation sigmas, the sporulation phosphorelay, the spo0A phosphorylation-stimulating complex, and most spo genes (Table S6). Notably, the phrA and phrE mutants would be lost in a pooled screen as they would be complemented by the predominantly wild-type cells in the population (Meeske et al., 2016).
Using a stringent 5% FDR cutoff (rSS < 0.31), we also identified an additional 73 genes likely to be sporulation defective of which 33 are poorly characterized, and 40 are of known function. We and others validated 12 of these players (Table S6) (Meeske et al., 2016), with two of the poorly characterized genes, ywmB (spoIIT) and yqzE (spoIIlL) being identified as forespore activators of SigE and SigG (Meeske et al., 2016). Further examination of the newly identified sporulation genes revealed new connections and roles. Two of the poorly characterized cell-envelope related genes yabM and ykvU, encode paralogs of the MurJ and SpoVB lipid II flippases (Meeske et al., 2015). Based on our results and their previous associations with cell-wall related phenotypes (Vasudevan et al., 2009), we speculate that both play a specialized, flippase-related role in spore cortex synthesis. Among the known signal transduction genes, yqfL, is a negative regulator of the CcpN, gluconeogenesis repressor (Servant et al., 2005). As CcpN negatively regulates gapB (Servant et al., 2005), a gluconeogenic enzyme whose deletion also results in a sporulation defect, we suggest that gluconeogenesis may have a direct impact in sporulation. Finally, 15/40 known genes are involved in translation. That a significant fraction (6/15) of the non-essential ribosomal protein genes analyzed in this screen have sporulation phenotypes suggests either that they have a specific role in sporulation or that they are needed in stressful circumstances. In support of the former idea, these deletion strains were not cold sensitive (Table S4), a condition where translation is compromised (Barria et al., 2013).
To obtain an overall overview of the processes involved in sporulation, we identified functional categories enriched in low sporulation scores. GSEA analysis identified cell cycle/division, cell envelope biogenesis, signal transduction, translation and cell motility as enriched functional categories (p<0.05, Figure 6E). It will be interesting to determine in the future whether the role of these processes in sporulation requires additional protein synthesis, and also whether they are necessary in both the mother cell and forespore. We also assessed the importance of genes in the known spo regulons to sporulation using GSEA analysis of the regulons of Spo0A, which initiates sporulation, and the sporulation sigma factors, SigE, F, K and G (Eijlander et al., 2014). As expected, all of these regulons are enriched in our hits (p<0.05), with the exception of SigG (Figure 6F), which has a role in the terminal processes of sporulation. Only 52/407 genes, or 10–20% of the genes in each regulon, are significantly sporulation defective (rSS <0.31), consistent with the previous findings on the SigE regulon (Eichenberger et al., 2003). Notably, genes expressed in the mother cell (SigE or SigK regulons) are just as likely as those expressed in the forespore (SigF or SigG regulons) to have severe phenotypes (Figure 6F), indicating the important role of the mother cell in nourishing and orchestrating forespore development, and the equal redundancy of function on both compartments. Mutants in spo regulons with no or weak phenotypes may have subtle, conditional or redundant effects. These genes require additional dissection, possibly by double mutant analysis (Silvaggi et al., 2004), which can now be performed with the high-throughput method described above.
We used our genome-scale dataset of 144 known and newly identified sporulation genes to reexamine the genetic signature for sporulating Firmicutes (Figure S7C and Table S6). Previous genomic studies comparing sporulating and nonsporulating Firmicutes (Bacilli + Clostridia) identified 50–60 genes that comprised a genetic signature for sporulating Firmicute, as well as a larger set of Bacilli or Clostridia-specific sporulation genes (Abecasis et al., 2013; Galperin et al., 2012). We confirmed the previously identified genetic signature for sporulating Firmicutes and identified two new broadly conserved sporulation genes, disA and minD. disA was previously implicated in reporting about DNA integrity during sporulation, but no spo phenotype had been identified (Bejerano-Sagie et al., 2006). minD was just identified as a member of complex machinery for proper chromosome segregation with a mild spo phenotype (Kloosterman et al., 2016).
We confirmed the known Bacilli-specific sporulation genes, and identified several new members of this group. In addition to ywmB, yqzE, and ykvU, discussed above, we identify yppC, ywgA, yunG, rsiX and kinB as Bacilli-specific sporulation genes. kinB is involved in sporulation signal transduction but was not thought to have a sporulation phenotype (Trach and Hoch, 1993). Our study also identified two secreted signaling short peptides (PhrI and PhrK), known to play roles in other processes (Auchtung et al., 2007; Auchtung et al., 2006), as potentially defective in sporulation as well. Although direct conservation analysis is difficult because the peptides are short, each Phr inhibits an adjacent response regulator aspartate phosphatase (Rap). We find that rap-phr gene pairs are widely present in sporulating Bacillus species but absent in sporulating Clostridia and even in closely related non-sporulating Listeria monocytogenes, suggesting that they play a species specific role in regulation of sporulation.
PERSPECTIVES
We report the construction of two ordered B. subtilis single gene deletion libraries, accompanied by high-throughput technologies that will facilitate functional genomics in the premier model Gram-positive bacterium. This platform will also nucleate studies in related Firmicutes, of importance for human health and industrial technologies.
We refined the essential gene subset, provided the first comprehensive characterization of auxotrophic genes, and assessed competence and sporulation genome wide. Our studies were performed with both the KanR and ErmR libraries, finding high phenotypic agreement. The few discrepancies arose from different strengths of the promoters driving Erm and Kan expression, occasionally resulting in different downstream effects, and suppressive mutations masking the phenotype of especially sick mutants (e.g. ponA, pdhA, and fmt; Table S4). The simplest way to ensure a valid phenotype is to screen both libraries for the phenotypes of interest. The Bacillus Genetic Stock Center (BGSC, www.bgsc.org) is already distributing individual ErmR mutants and will soon be able to distribute the KanR mutants. The entire KanR library will also be distributed by Addgene.
Our libraries have several important features. The antibiotic resistance cassette can easily be removed via the Cre/lox system, and removal can be performed sequentially thereby enabling dissection of gene redundancy. The library is optimal for arrayed screens, which are necessary for assaying single cell phenotypes that cannot be identified in pooled screens, including screens for genes involved in morphology, sporulation, and production of secreted proteins, secondary metabolites and antibiotics. Additionally, as each mutant has two unique barcodes that are retained even after removal of the antibiotic resistance cassette, this collection is a critical resource for high-throughput pooled studies. Like RB-Tn-seq (Wetmore et al., 2015), library preparation is simple, increasing throughput. Additionally, our barcoded library is significantly less complex (only one barcode/gene) vs >100,000 mutants in a typical Tn-seq screen, further increasing throughput so that it is feasible to test relative fitness in hundreds of conditions in one sequencing lane. These libraries also permit adjusting complexity of the initial pools to bypass potential bottleneck effects (Maier et al., 2014). Finally, each mutation can be easily transferred to different B. subtilis genetic backgrounds to study traits lost from the domesticated strain, such as surface swarming and the formation of architecturally complex biofilms (Zeigler et al., 2008).
The rapid identification of gene functions, pathways and their regulation in divergent bacteria is a major challenge in microbiology, and has spawned a cadre of high-throughput phenotyping approaches including comparative genomics, proteomics, high-throughput enzyme activity screens, metabolomics and functional genomics. We demonstrated the synergy of these approaches in our identification of the function of the auxotrophic gene, ysaA, renamed serB. The next goal is to integrate data from diverse approaches to build a high-resolution biological network. Using the same resource library will facilitate data integration. Indeed, several groups are using our library for transcriptomics, ribosome profiling, cell imaging and chemical genetics.
STAR Methods
CONTACT FOR REAGENT AND RESOURCE SHARING
B. subtilis single gene deletion mutants are available from Bacillus Genetic Stock Center (BGSC, www.bgsc.org) and whole library is available from Addgene (www.addgene.org/Carol_Gross). Further information and requests for other reagents may be directed to, and will be fulfilled by the lead contact, Carol Gross (cgrossucsf@gmail.com)
EXPERIMENTAL MODEL AND SUBJECT DETAILS
B. subtilis 168 strain (BGSC; accession number: 1A1) was used as the wild-type strain for construction of mutant libraries and genetic analysis. Strain numbers of each mutant were assigned as BKK (KanR) or BKE (ErmR) with the locus tag of the deleted gene. Cells were routinely grown in LB medium (1% tryptone, 0.5% yeast extract and 0.5% NaCl) at 37 °C with aeration or on LB agar plates. LB medium was supplemented with 7.5 μg/ml kanamycin or 1 μg/ml erythromycin + 12.5 μg/ml lincomycin for selection of KanR or ErmR mutants respectively. E. coli K-12 BW25113 and its serB deletion mutant (Baba et al., 2006) were used for testing functional compatibility between E. coli serB and B. subtilis ysaA. Cloning was performed in E. coli DH5α.
METHOD DETAILS
Design of primers
Primers used for construction of gene targeting fragments and cloning of genes were designed by using Primer3 (Untergasser et al., 2012). When orfA and orfB are separated by >21 bp, the whole ORF is removed, except for its start and stop codons. When orfA and orfB are separated by <21 bp (e.g. many genes in same operon such as pdhA and pdhB), the orfA deletion leaves 21~ 23 bp upstream region from the start site of orfB. The exact spacing is based on matching the reading frame of the scar after loop-out with stop codon of orfA. For translationally coupled genes (e.g. pyrD and pyrF), the orfA deletion maintains a region of 21–23 bp (depending on reading frame) upstream of the orfB start site and the orfB deletion maintains the stop codon of orfA. When stop codons overlap their intrinsic transcriptional terminators, placing the 3′ end of the antibiotic resistance cassette just prior to the stop codon obliterates the terminator and generate long transcripts that could be antisense RNA for a convergent downstream gene. For example, we were unable to fully delete yerO and ycgJ, likely because loss of the terminator produced a transcript antisense to the convergent essential gatA, B, C and aroK genes respectively but could make one ~30 bp shorter that retained the terminator. All primers are listed in Table S1.
Construction of single gene deletion mutants
Schematic procedure of construction of single gene deletion mutants is described in Figure 1A. The PCR reactions, transformations and mutant storage steps were performed in microtiter plates using automated liquid handling platforms with in-house protocols designed to minimize cross-contamination.
Generation of gene targeting DNA fragments
Gene targeting DNA fragments were generated by joining PCR of three fragments; antibiotic resistance cassette containing random barcodes, 1kb 5′ and 3′ flaking sequences of targeting gene. For preparation of antibiotic resistance cassettes, PAGE-purified primer pairs Ab-F (5′ GCAGGCGAGAAAGGAGAGVNNVNNVNNVNNVNNVNNVNNGAGGGAGGAAAGGCAGGA 3′, V is A or C or G) and Ab-R (5′ CGAGGCTCCTGTCACTGCNNBNNBNNBNNBNNBNNBNNBCGCCGTATCTGTGCTCTC 3′, B is C or G or T) (0.5 μM final each) were mixed with 10 ng of purified template plasmid (pDR240a for KanR and pDR242a for ErmR) and amplified by PCR under standard condition using Phusion hot-start DNA polymerase (NEB). Amplified KanR or ErmR fragments were purified by gel extraction. For preparation of flanking sequences of target genes, targeting gene specific primer pairs, 5pL-5pR and 3pL-3pR (0.5 μM final each) were arrayed in 384-well PCR plates and mixed with 20 ng of purified B. subtilis 168 genomic DNA, and amplified by PCR under standard conditions. Amplified flanking DNA fragments in 384-well plates were purified using the Agencourt AMPure XP (Beckman Coulter) magnetic beads. Antibiotic resistance cassette and 5′ and 3′ flanking DNA fragments (approximately 15 ng of each DNA) were mixed and subjected to the joining PCR in the presence of 5pL and 3pR (0.5 μM final each) under following conditions: 1 min at 98°C; (10 s at 98°C, 20 s at 55°C, 80 s at 72°C) for 30 cycles; 5 min a t 72°C using detergent-free HF buffer and Phusion hot -start DNA polymerase. The joined PCR products were directly used for transformation. All high-throughput liquid handling steps were performed using a Biomek FX liquid handling robot.
Transformation, purification and storage of mutants
All B. subtilis mutants were constructed using natural competence. Competent cells were prepared by following protocol; Wild-type B. subtilis 168 cells were inoculated into 3 ml of MC medium (10.7 g/L K2HPO4, 5.2 g/L KH2PO4, 20 g/L glucose, 0.88 g/L trisodium citrate dihydrate, 0.022 g/L ferric ammonium citrate, 1 g/L casamino acids, 2.2 g/L potassium glutamate monohydrate, 20 mM MgSO4, 300 nM MnCl2, 20 mg/L L-tryptophan) and incubated at 37 °C overnight with aeration. The overnight culture was diluted to an OD600 of 0.1 in 30 ml competence medium (10.7 g/L K2HPO4, 5.2 g/L KH2PO4, 20 g/L glucose, 0.88 g/L trisodium citrate dihydrate, 0.022 g/L ferric ammonium citrate, 2.5 g/L potassium aspartate, 10 mM MgSO4, 150 nM MnCl2, 40 mg/l L-tryptophan, 0.05% yeast extract), then grown in a 125 ml flask at 37°C with shaking (250 rpm) until cells reached OD600~1.5. 120 μl of culture was then mixed with 10 μl of gene targeting PCR fragments arrayed in a deep 96-well plate, covered with a breathable film, and incubated at 37 °C with shaking (900 rpm). After 2 hr incubation, cells were plated on LB agar containing selective antibiotics (7.5 μg/ml kanamycin or 1 μg/mL erythromycin, and 12.5 μg/ml lincomycin [by activity]). After 16~24 hr incubation, four single colonies from each plate were purified by restreaking on new selection plate; two of them were stored in 15% glycerol at −80 °C.
Removal of antibiotic resistance cassette from BKK and BKE strain
BKK or BKE strain was transformed with pDR244 (temperature-sensitive plasmid with constitutively expressed Cre recombinase). Transformants were selected on LB agar plate supplemented with 100 μg/mL spectinomycin at 30 °C. Transformants were the n streaked on LB agar plates and incubated at 42 °C. Cells from the edge of single c olonies were then restreaked on LB, LB supplemented with kanamycin (for BKK) or erythromycin and lincomycin (for BKE), and LB supplemented with spectinomycin. A strain that grew on LB agar plate, but not on LB agar plates supplemented with antibiotics, had lost pDR244 and antibiotic resistance cassette. Markerless deletion was confirmed by PCR with primers flanking the deletion (5pL and 3pR).
Validation of new essential and non-essential genes
As described in RESULTS AND DISCUSSION, essential genes were defined based on inability to obtain viable transformants using two independent, validated PCR products. New essential gene candidates were confirmed using a standard complementation protocol. The ribosome binding site and ORF of a candidate gene was cloned into pDR110a integration plasmid where its expression is under control of IPTG inducible promoter. After transformation of the plasmid containing the cloned gene into wild-type for ectopic expression of new essential gene candidate from amyE locus, the ORF of native gene was replaced with KanR or ErmR cassettes by transformation of gene targeting DNA fragment in medium supplemented with IPTG. Primers used in construction of complementation strains are listed in Table S1. If the gene was previously annotated as essential, we confirmed that the new non-essential gene mutants lacked a copy of the gene that was deleted. Two sets of PCR were carried out using different combination of primers, reaction A with 3pR and antibiotic resistance cassette- specific primers (5′ AGTAAGTGGCTTTATTGATCTTGGG 3′ for KanR and 5′ CCTTAAAACATGCAGGAATTGACG 3′ for ErmR) and reaction B with deleted gene-specific primer pair. Gene deletions were confirmed by ~1.2 kb PCR product from reaction A and no product from reaction B.
Identification of mutant-specific barcodes
Pooling mutants and preparation of genomic DNA
Each mutant was inoculated into deep 96-well plates containing 200 μl LB supplemented with 3.5 μg/ml kanamycin (for KanR) or 0.5 μg.ml erythromycin (for ErmR) from frozen stocks using a BioMek FX liquid handling robot and incubated in an Infors incubator at 30 °C overnight with shaking at 900 rpm. 5 μl of each mutant culture was pooled in deep 96-well plates as described in Figure 1A. Mutants in the same pool were combined in one tube and genomic DNA was purified using the Qiagen DNeasy Blood & Tissue kit.
Preparation of sequencing library
Deep sequencing samples were prepared as previously described with some modifications for identification of the gene associated barcode (Son and Taylor, 2011). Genomic DNA from each pool was sheared using a Bioruptor (UCD-200) sonicator to yield fragments with a mean length of 250 bp. The sheared DNA was concentrated using a Qiagen PCR purification kit, and end-repair, dA tailing and adapter ligation were carried out as previously described. For enrichment of barcodes and their flanking region, total 72 reactions (9 pools × 2 libraries × 2 barcodes × 2 clones) of first-round PCR were performed using primers, biotinylated P1_UPs (KanR or ErmR library-specific indices are included) and P2_INDs (including pool specific indices are included). Amplified biotinylated products were purified using Dynabeads MyOne Streptavidin C1 (Invitrogen). First-round PCR products were further amplified using the Illumina paired-end primer PE2.0S and PE1.0 and DNA fragments of 200–600 bp were size selected and purified by agarose gel electrophoresis prior Illumina sequencing. Sequences of primers used for preparation of sequencing libraries are listed in Table S1.
Analysis of barcodes
Mutant specific barcodes were identified by mapping the sequencing reads onto the genome sequence of B. subtilis using Bowtie2 (Langmead and Salzberg, 2012). Cross-contamination was assessed by the presence of mutant barcodes in pools that should not contain the mutant.
Quality control of library
We established four quality control standards and replaced strains failing any standard.
Pools expected to lack a particular mutant must have minimal barcode reads originating from that mutant (the smaller of ≤10 reads or ≤ 5% barcode reads in the correct group). We found only 2 cases of this problem-suggesting little cross contamination, a proposition validated by our phenotyping analysis.
Barcodes uniquely identified the antibiotic replacement cassette with which it was associated.
The barcode length was > 17bp, the UP1 and UP4 universal priming sequences were intact, and the appropriate size of the scar following excision of antibiotic resistance cassette was maintained.
The strains were wild-type at the SpoIIE locus.
High-throughput growth phenotype screen
The screen was carried out as described previously for E. coli chemical genomics (Nichols et al., 2011) with modifications optimized for B. subtilis. Plates for screening were allowed to dry for two days. ErmR and KanR libraries were independently re-arrayed in 384-well plates using a Biomek FX liquid handling robot (Beckman Coulter) and stored as glycerol stock. To screen each library, cells were pinned from glycerol stocks onto rectangular LB agar plates in 384-format using a Singer Rotor robot, then four 384-format plates were combined and pinned to 1536-format. For each screen, exponentially growing cells in 1536-format were then pinned to LB or defined media plates and incubated for 6~48 hr depending on their growth conditions. Composition of defined media was described in Table S4. All plates were incubated in a humidified incubator. Plates were imaged using a Powershot G10 camera (Canon) when at a time point at which fitness differences were apparent but growth had not saturated. The calculation of RF and nRF was carried out as described in QUANTIFICATION AND STATISTICAL ANALYSIS.
High-throughput sporulation assay
Exponentially growing cells in 1536-format on LB agar plates were pinned to sporulation medium agar plates (0.2% succinate, 0.1% glutamate, 1X S750 salts, 40 μg/ml L-tryptophan, 1X metals, 10 μM MnCl2, 0.1X AAA, 0.1X FAA, 0.1X BAA, 0.25X ACGU, 0.1X vitamin mix, 2% agar). Sporulation was measured after incubation of plates at 37 °C in a humidified incubator for 45 hr. Plates were imaged using a Powershot G10 camera (Canon) and sporulation scores were quantified using Iris (Kritikos et al, submitted), which measures the dark brown pigmentation at a defined area around the colony center.
High-throughput double gene mutant generation
ErmR library was pinned from glycerol stocks onto rectangular LB agar plates in 384-format using a Singer Rotor robot, then pinned again onto MC agar plates and incubated overnight. Each of the ErmR mutants arrayed on MC agar plates were resuspended in liquid competence medium using a Singer Rotor robot. 20 μl transformation reactions in shallow 384-well plates were set as following: 4 μl of cells resuspended in competence medium, 4 μl of donor genomic DNA resuspended in competence medium (hisC::kanR, final 1 μg/ml), and 12 μl of competence medium. Each plate was covered with a breathable film and incubated for 16 hr without shaking. For enrichment of transformants, 5 μl of LB with kanamycin (final concentration, 3.5 μg/ml in 25 μl) was added to each well and incubated for 6 hr further. Following enrichment for transformants on kanamycin, transformants were first selected on LB supplemented with kanamycin followed by LB supplemented with kanamycin and erythromycin. Double mutants (KanR and ErmR) were screened to identify the aminotransferase gene performing the final step of Phe and Tyr biosynthesis by pining on selective minimal media. All plates in each step were incubated at 37 °C in a humidified incubator. For confirmation of competence genes identified in 1st genome-wide screen, 88 candidate mutants and 70 mutants missing from 1st screen due to no or poor growth in MC medium were rearrayed in two 96-well plates. The following modifications were applied to second screen; 1) MC medium was supplemented with nucleotide bases and vitamins, 2) Reactions were carried out in shallow v-bottom 96-well plates, and 3) two different donor genomic DNA (hisC:kan or amyE:kan) with higher concentration (final 3 μg/ml) were tested.
Identification of the function of YsaA
Metabolic suppression profiling
The profiling was carried out as previously described (Zlitni et al., 2013), with modification of the metabolic suppression array. Cells exponentially growing in LB medium were collected and washed with glucose minimal medium by mild centrifugation. Cells resuspended in glucose minimal medium were diluted to an OD600 of 0.01 in 150 μl of each culture medium in 96 well plate described in Figure 4A. Plate was covered with a breathable film and incubated at 37 °C with shaking (900 rpm). OD600 of each culture was measured after 18 hr.
Cloning, Overexpression and Purification of YsaA
ysaA was amplified from B. subtilis 168 genomic DNA using primers ysaA-F3 (CAACGgctagc AAAGCCGTATTTTTTGATTTAGAT) and ysaA-R3 (AACTCggatccCATTTCACTTGATGAGTTTGTG) to create flanking NheI and BamHI sites. Purified PCR product digested with NheI and BamHI was inserted into the pET28a vector.
YsaA was overexpressed in E. coli Rosetta2 (DE3). Overnight cultures were diluted 1:100 into fresh LB medium containing 20 μg/ml kanamycin and 30 μg/ml chloramphenicol, and grown aerobically at 30 °C. When the cultures reached OD 600 of 0.4, expression of YsaA was induced by addition of IPTG to a final concentration of 1 mM and growth continued at 30 °C with aeration for 2 hr. Purification of YsaA was carried out as described previously (Huang et al., 2015). Cells were suspended in lysis buffer [20 mM HEPES (pH 7.5), 500 mM NaCl, 20 mM imidazole, and 10% (vol/vol) glycerol] and lysed by sonication. The lysate was clarified by centrifugation at 35,000 × g for 30 min. Clarified lysate was loaded onto an ÄKTAxpress FPLC (GE Healthcare). Lysate was loaded onto a 1 mL HisTrap FF column (GE Healthcare), washed with 10 column volumes of lysis buffer, and eluted in buffer containing 20 mM HEPES (pH 7.5), 500 mM NaCl, 500 mM imidazole, and 10% glycerol. The purified sample was loaded onto a HiLoad S200 16/60 PR gel filtration column that was equilibrated with SECB buffer [20 mM HEPES (pH 7.5), 150 mM NaCl, 10% (vol/vol) glycerol, and 5 mM DTT]. Peak fractions were collected and protein was analyzed by SDS/PAGE, snap-frozen in liquid nitrogen, and stored at −80 °C.
Enzyme Kinetics
For steady-state kinetic characterization, purified YsaA was diluted to 5 nM into an assay buffer (25 mM HEPES, pH 7.5, 0.3 mM TCEP, 5 mM MgCl2). The steady-state kinetic parameters (Km and kcat) for each substrate were determined from initial reaction velocities measured at varying substrate concentrations (0.5 – 5 Km). The assay was carried out in assay buffer with Biomol Green reagent for phosphate detection in a total volume of 50 μl in a 96-well microtiter plate. Enzyme and substrate were incubated at 25 °C for various time points and reac tions were quenched by the addition of 100 μl Biomol Green reagent to each well. The assay plate was incubated at room temperature for 60 minutes to allow color to fully develop. The OD620 was measured on a Molecular Devices SpectraMax M5 microtiter plate reader. Inorganic phosphate release was quantified by comparison to a standard curve constructed by using a range of KH2PO4 concentrations diluted in deionized distilled water. Data were fit to the following equation using Prism:
| (1) |
Here, vo is the initial velocity, Vmax the maximum velocity, [S] the substrate concentration and Km the Michaelis-Menten constant. The value for kcat was calculated from the equation kcat = Vmax [E], where [E] is the protein concentration in the assay. The steady-state kinetic constants are reported in Figure 4G.
QUANTIFICATION AND STATISTICAL ANALYSIS
Calculation of Relative fitness, RF and nRF
Mutants arrayed in high density on agar plates (1536 mutants/plate) were grown for 6~48 hours depending on conditions. Fitness was measured by the colony opacity of each mutant determined with B subtilis optimized Iris colony sizing software, and spatial effects on plates were corrected (Kritikos et al, submitted). The RF of each mutant was calculated as: RF = (colony opacity of mutant)/(median colony opacity of the plate). The average RF calculated from three technical replicates is presented in Table S4. The nRF of each mutant represents the RF in condition X relative to its RF in the Standard Condition (LB 37°C).
Identification of auxotrophs
Auxotrophs were experimentally identified by determining library fitness in glucose-ammonium minimal medium, supplemented with tryptophan to complement the trpC mutation in B. subtilis 168. A total of 93 strains were defined as auxotrophic according to their nRFs of both libraries. Eighty strains were unable to grow (average nRF of ErmR and KanR is less than 0.1 and one of their nRF is 0). Thirteen additional strains showed some growth (average nRF of ErmR and KanR is between 0.1 and 0.3, but none of their nRF is higher than 0.3), likely due to nutrient carryover.
Calculation of relative sporulation score, rSS
Sporulation was measured after growing the arrayed libraries for 45 hours on sporulation medium agar plates. Sporulation scores were assigned based on the color intensity at center of each colony (Figure 4A), as determined with Iris. Normalized sporulation scores were calculated by normalizing replicate plate bias. Positional effects were addressed by separately normalizing values of colonies positioned in the 4 outermost rows and columns of the colony array. rSS was calculated by following equation, rSS = (sporulation score of mutant)/(median sporulation score in plate). Dependence of the sporulation score on colony size (mutant fitness) was assessed, and a minimum size threshold was set at 1100 pixel (Table S5). Mutant values were averaged separately for the ErmR and KanR libraries and compared. Mutants with discordant clones and mutants that were not viable in either library were discarded. ErmR and KanR library scores for remaining mutants were averaged into per-mutant scores.
Analysis of dataset
Pre-ranked GSEA using default values (Subramanian et al., 2005) was performed on the mean centered RF, nRF, or rSS values to test for enrichment of B. subtilis COG, prophage genes and sporulation sigma regulon genes using the Broad Institute GSEA desktop application. To test for enrichment in gene lists and strand bias of auxotrophic gene, the Bonferroni corrected hypergeometric test was used. To test for conservation of genes grouped by their sporulation phenotypes among other spore-forming bacteria, the Chi-squared test with Yates’ continuity correction was used.
Databases for B. subtilis gene annotation, COG and regulation were downloaded from Microscope, EggNog and SubtiWiki (Huerta-Cepas et al., 2016; Michna et al., 2014; Vallenet et al., 2013). COG assignments for some genes were updated and modified as needed.
Conservation analysis
Conservation of genes across species was performed using Protein BLAST (Altschul et al., 1990). All protein sequences for the selected species were downloaded from the RefSeq database Release 78 (O’Leary et al., 2016) using the rentrez R package. Subsequently, a BLAST database was made for each species, and Protein BLAST was used to extract protein similarities for each query gene. We defined gene conservation by two-step procedure. First, conserved genes were identified by setting a bit score threshold at 50, and a sequence identity threshold of 30%. Second, we validated them based on their functional annotations.
Species phylogenetic trees were created by hierarchical clustering pairwise species distances. Distances used were acquired using a set of universal marker proteins (Mende et al., 2013).
DATA AND SOFTWARE AVAILABILITY
Software
The Iris image analysis software was used to automatically quantify colony size and sporulation. Binary distribution and source code are freely available at https://github.com/critichu/Iris/
KEY RESOURCES TABLE
| REAGENT or RESOURCE | SOURCE | IDENTIFIER |
|---|---|---|
| Antibodies | ||
| Chemicals, Peptides, and Recombinant Proteins | ||
| Lysogeny broth (LB), Lennox | Fisher scientific | Cat# BP1427-2 |
| Tryptic Soy Agar (TSA) | BD Biosciences | Cat# 236950 |
| Nutrient broth | BD Biosciences | Cat# 234000 |
| Agar | BD Biosciences | Cat# 214030 |
| Hemin | Sigma-Aldrich | Cat# 51280 |
| Yeast extract | BD Biosciences | Cat# 212750 |
| Casamino acids | BD Biosciences | Cat# 223050 |
| Potassium phosphate monobasic | Sigma-Aldrich | Cat# P0662 |
| Potassium phosphate dibasic | Sigma-Aldrich | Cat# P8281 |
| Trisodium citrate dihydrate | Fisher scientific | Cat# S279-500 |
| Ferric ammonium citrate | Sigma-Aldrich | Cat# F5879 |
| Potassium glutamate monohydrate | Sigma-Aldrich | Cat# G1501 |
| Potassium aspartate | Sigma-Aldrich | Cat# A6558 |
| Manganese chloride tetrahydrate | Sigma-Aldrich | Cat# M3634 |
| Magnesium sulfate heptahydrate | Sigma-Aldrich | Cat# M1880 |
| L-tryptophan | Fisher scientific | Cat# BP395-100 |
| Dextrose (D-[+]-glucose) | Sigma-Aldrich | Cat# D9434 |
| IPTG | Denville scientific | Cat# C18280-13 |
| MOPS | Sigma-Aldrich | Cat# M1254 |
| Potassium sulfate | Sigma-Aldrich | Cat# P9458 |
| Ammonium Chloride | Sigma-Aldrich | Cat# A9434 |
| L-alanine | Sigma-Aldrich | Cat# A7627 |
| D-alanine | Sigma-Aldrich | Cat# A7377 |
| L-arginine | Sigma-Aldrich | Cat# A8094 |
| L-glutamine | Sigma-Aldrich | Cat# G3126 |
| Glycine | Sigma-Aldrich | Cat# G7126 |
| L-histidine | Sigma-Aldrich | Cat# H8125 |
| L-isoleucine | Sigma-Aldrich | Cat# I2752 |
| L-leucine | Sigma-Aldrich | Cat# L8000 |
| L-lysine | Sigma-Aldrich | Cat# L5626 |
| L-methionine | Sigma-Aldrich | Cat# M9625 |
| L-proline | Sigma-Aldrich | Cat# P0380 |
| L-serine | Sigma-Aldrich | Cat# S4500 |
| L-threonine | Sigma-Aldrich | Cat# T8625 |
| L-valine | Sigma-Aldrich | Cat# V0500 |
| L-cysteine hydrochloride monohydrate | Sigma-Aldrich | Cat# C7880 |
| L-phenylalanine | Sigma-Aldrich | Cat# P2126 |
| L-tyrosine | Sigma-Aldrich | Cat# T3754 |
| p-amino benzoic acid | Sigma-Aldrich | Cat# A9878 |
| p-hydroxy benzoic acid | Sigma-Aldrich | Cat# H5376 |
| 2,6 -diaminopimelic acid | Sigma-Aldrich | Cat# D1377 |
| L-Homoserine | Sigma-Aldrich | Cat# H6515 |
| Shikimic acid | Sigma-Aldrich | Cat# S5375 |
| Adenine | Sigma-Aldrich | Cat# A8626 |
| Cytosine | Sigma-Aldrich | Cat# C3506 |
| Guanine | Sigma-Aldrich | Cat# G11950 |
| Uracil | Sigma-Aldrich | Cat# U0750 |
| Biotin | Sigma-Aldrich | Cat# B4501 |
| Nicotinamide | Sigma-Aldrich | Cat# N3376 |
| (−)-Riboflavin | Sigma-Aldrich | Cat# R9504 |
| Thiamine hydrochloride | Sigma-Aldrich | Cat# T4625 |
| Calcium pantothenate | Sigma-Aldrich | Cat# C8731 |
| Pyridoxine hydrochloride | Sigma-Aldrich | Cat# P6280 |
| Vitamine B12 | Sigma-Aldrich | Cat# V2876 |
| Succinic acid | Sigma-Aldrich | Cat# S3674 |
| D-(−)-Fructose | Sigma-Aldrich | Cat# F0127 |
| L-(−)-malic acid sodium salt | Sigma-Aldrich | Cat# M1125 |
| Glycerol | Fisher scientific | Cat# G30-4 |
| Sodium pyruvate | Sigma-Aldrich | Cat# P2256 |
| D-gluconic acid | Sigma-Aldrich | Cat# G9005 |
| L-ornithine | Sigma-Aldrich | Cat# O2375 |
| Potassium nitrate | Sigma-Aldrich | Cat# P8394 |
| Calcium chloride dihydrate | Sigma-Aldrich | Cat# C3881 |
| Zinc chloride | Sigma-Aldrich | Cat# 208086 |
| Cobalt(II) chloride hexahydrate | Sigma-Aldrich | Cat# 60820 |
| Sodium molybdate dihydrate | Sigma-Aldrich | Cat# 71756 |
| Copper(II) chloride dihydrate | Sigma-Aldrich | Cat# 307483 |
| Ferric chloride hexahydrate | Sigma-Aldrich | Cat# F2877 |
| 2,2′-dipyridyl | Sigma-Aldrich | Cat# D216305 |
| Kanamycin sulfate | Sigma-Aldrich | Cat# K1377 |
| Erythromycin | Sigma-Aldrich | Cat# E5389 |
| Lincomycin hydrochloride | Sigma-Aldrich | Cat# L2774 |
| Spectinomycin dihydrochloride pentahydrate | Sigma-Aldrich | Cat# S9007 |
| Ampicillin sodium salt | Sigma-Aldrich | Cat# A9518 |
| SalI-HF (restriction enzyme) | New England Biolabs | Cat# R3138 |
| HindIII-HF (restriction enzyme) | New England Biolabs | Cat# R3104 |
| NheI-HF (restriction enzyme) | New England Biolabs | Cat# R3131 |
| SphI-HF (restriction enzyme) | New England Biolabs | Cat# R3182 |
| Phusion hot-start DNA polymerase | Thermo scientific | Cat# F540L |
| Q5 High-Fidelity DNA polymerase | New England Biolabs | Cat# M0491L |
| T4 DNA ligase | New England Biolabs | M0202 |
| T4 DNA polymerase | New England Biolabs | M0203 |
| DNA polymerase I, Large (Klenow) Fragment | New England Biolabs | M0210 |
| T4 Polynucleotide kinase | New England Biolabs | M0201 |
| Klenow fragment (3′→ 5′ exo-) | New England Biolabs | M0212 |
| dATP solution | New England Biolabs | N0440 |
| dNTP solution mix | New England Biolabs | N0447 |
| Lysozyme (from chicken egg white) | Sigma-Aldrich | Cat# L6876 |
| Triton X-100 | Fisher scientific | Cat# BP151-500 |
| Imidazole | Sigma-Aldrich | Cat# I2399 |
| DTT (DL-dithiothreitol) | Sigma-Aldrich | Cat# D9779 |
| HEPES | Sigma-Aldrich | Cat# H3375 |
| Tris(2-carboxyethyl)phosphine hydrochloride, (TCEP) | Sigma-Aldrich | Cat# C4706 |
| 2-mercaptoethanol | Sigma-Aldrich | Cat# M3148 |
| Biomol Green | Enzo Life Sciences | Cat# BML AK111 |
| Critical Commercial Assays | ||
| Agencourt AMPure XP | Beckman Coulter | Cat# A63881 |
| Dynabeads MyOne Streptavidin C1 | Invitrogen | Cat# 65001 |
| QIAquick PCR purification kit | Qiagen | Cat# 28104 |
| DNeasy Blood & Tissue Kit | Qiagen | Cat# 69504 |
| Deposited Data | ||
| Experimental Models: Cell Lines | ||
| Experimental Models: Organisms/Strains | ||
| Bacillus subtilis 168 | BGSC | 1A1 |
| Bacillus subtilis 168 deletion mutants | This study | BKE or BKK with locus tag numbers |
| Escherichia coli DH5α | Lab stock | N/A |
| Escherichia coli Rosetta2 (DE3) | EMD Millipore | Cat# 71400 |
| Escherichia coli BW25113 | Baba et al., 2006 | N/A |
| Escherichia coli BW25113 ΔserB | Baba et al., 2006 | N/A |
| Recombinant DNA | ||
| pDR240a | This study | N/A |
| pDR242a | This study | N/A |
| pDR244 | This study | N/A |
| pDR110a | Rudner lab | N/A |
| pET28a | EMD Millipore | Cat# 69864 |
| Sequence-Based Reagents | ||
| Primers used in this study are listed in Table S1. | This study | N/A |
| Software and Algorithms | ||
| Primer3 | Untergasser et al., 2012 | http://biotools.umassmed.edu/bioapps/primer3_www.cgi |
| Bowtie2 | Langmead and Salzberg, 2012 | http://bowtie-bio.sourceforge.net/bowtie2/index.shtml |
| Iris | Kritikos et al., submitted | https://github.com/critichu/Iris/ |
| Protein BLAST | Altschul et al., 1990 | https://blast.ncbi.nlm.nih.gov/Blast.cgi |
| GSEA | Broad Institute | http://software.broadinstitute.org/gsea |
| iTOL | Letunic and Bork, 2016 | http://itol.embl.de/ |
| Other | ||
Supplementary Material
Acknowledgments
We thank D. Dubnau, KC Huang, B.M. Burton, A.D. Grossman, A.L. Sonenshein and members of Gross laboratory for helpful comments. This work was supported by Sofja Kovalevskaja award to A.T.; NIH U54 GM093342 to K.N.A.; NIH RC2 GM092616 to C.A.G. and D.Z.R.; NIH R01 GM073831 to D. Z.R.; NIH R01 GM102790 and R35 GM118061 to C.A.G.
Footnotes
Supplemental Information including seven figures and six tables can be found with this article.
AUTHOR CONTRIBUTIONS
Conceptualization, B.M.K., D.Z.R., A.T., and C.A.G.; Methodology, B.M.K., G.K., J.D.F., D.Z.R., K.N.A. A.T., and C.A.G.; Investigation, B.M.K., G.K., J.D.F., K.T., J.M.P., H.K., A.C., A-B.H. D.Z.R.; Formal Analysis, B.M.K, G.K., J.D.F., H.T., I.W., M.G., D.Z.R., K.N.A., A.T., and C.A.G.; Writing-Original Draft, B.M.K., G.K., H.T., K.N.A., A.T., and C.A.G.; Writing-Review & Editing, B.M.K., G.K., H.T., A.T., and C.A.G.; Funding Acquisition, D.Z.R., K.N.A., A.T., and C.A.G.; Supervision, B.M.K., D.Z.R., K.N.A., A.T., and C.A.G.
Publisher's Disclaimer: This is a PDF file of an unedited manuscript that has been accepted for publication. As a service to our customers we are providing this early version of the manuscript. The manuscript will undergo copyediting, typesetting, and review of the resulting proof before it is published in its final citable form. Please note that during the production process errors may be discovered which could affect the content, and all legal disclaimers that apply to the journal pertain.
References
- Abecasis AB, Serrano M, Alves R, Quintais L, Pereira-Leal JB, Henriques AO. A genomic signature and the identification of new sporulation genes. J Bacteriol. 2013;195:2101–2115. doi: 10.1128/JB.02110-12. [DOI] [PMC free article] [PubMed] [Google Scholar]
- Altschul SF, Gish W, Miller W, Myers EW, Lipman DJ. Basic local alignment search tool. J Mol Biol. 1990;215:403–410. doi: 10.1016/S0022-2836(05)80360-2. [DOI] [PubMed] [Google Scholar]
- Arumugam M, Raes J, Pelletier E, Le Paslier D, Yamada T, Mende DR, Fernandes GR, Tap J, Bruls T, Batto JM, et al. Enterotypes of the human gut microbiome. Nature. 2011;473:174–180. doi: 10.1038/nature09944. [DOI] [PMC free article] [PubMed] [Google Scholar]
- Auchtung JM, Lee CA, Garrison KL, Grossman AD. Identification and characterization of the immunity repressor (ImmR) that controls the mobile genetic element ICEBs1 of Bacillus subtilis. Mol Microbiol. 2007;64:1515–1528. doi: 10.1111/j.1365-2958.2007.05748.x. [DOI] [PMC free article] [PubMed] [Google Scholar]
- Auchtung JM, Lee CA, Grossman AD. Modulation of the ComA-dependent quorum response in Bacillus subtilis by multiple Rap proteins and Phr peptides. J Bacteriol. 2006;188:5273–5285. doi: 10.1128/JB.00300-06. [DOI] [PMC free article] [PubMed] [Google Scholar]
- Baba T, Ara T, Hasegawa M, Takai Y, Okumura Y, Baba M, Datsenko KA, Tomita M, Wanner BL, Mori H. Construction of Escherichia coli K-12 in-frame, single-gene knockout mutants: the Keio collection. Mol Syst Biol. 2006;2:2006. doi: 10.1038/msb4100050. 0008. [DOI] [PMC free article] [PubMed] [Google Scholar]
- Babu M, Arnold R, Bundalovic-Torma C, Gagarinova A, Wong KS, Kumar A, Stewart G, Samanfar B, Aoki H, Wagih O, et al. Quantitative genome-wide genetic interaction screens reveal global epistatic relationships of protein complexes in Escherichia coli. PLoS Genet. 2014;10:e1004120. doi: 10.1371/journal.pgen.1004120. [DOI] [PMC free article] [PubMed] [Google Scholar]
- Barak I, Behari J, Olmedo G, Guzman P, Brown DP, Castro E, Walker D, Westpheling J, Youngman P. Structure and function of the Bacillus SpoIIE protein and its localization to sites of sporulation septum assembly. Mol Microbiol. 1996;19:1047–1060. doi: 10.1046/j.1365-2958.1996.433963.x. [DOI] [PubMed] [Google Scholar]
- Barria C, Malecki M, Arraiano CM. Bacterial adaptation to cold. Microbiology. 2013;159:2437–2443. doi: 10.1099/mic.0.052209-0. [DOI] [PubMed] [Google Scholar]
- Bejerano-Sagie M, Oppenheimer-Shaanan Y, Berlatzky I, Rouvinski A, Meyerovich M, Ben-Yehuda S. A checkpoint protein that scans the chromosome for damage at the start of sporulation in Bacillus subtilis. Cell. 2006;125:679–690. doi: 10.1016/j.cell.2006.03.039. [DOI] [PubMed] [Google Scholar]
- Brochado AR, Typas A. High-throughput approaches to understanding gene function and mapping network architecture in bacteria. Curr Opin Microbiol. 2013;16:199–206. doi: 10.1016/j.mib.2013.01.008. [DOI] [PubMed] [Google Scholar]
- Browne HP, Forster SC, Anonye BO, Kumar N, Neville BA, Stares MD, Goulding D, Lawley TD. Culturing of ‘unculturable’ human microbiota reveals novel taxa and extensive sporulation. Nature. 2016;533:543–546. doi: 10.1038/nature17645. [DOI] [PMC free article] [PubMed] [Google Scholar]
- Caspi R, Altman T, Billington R, Dreher K, Foerster H, Fulcher CA, Holland TA, Keseler IM, Kothari A, Kubo A, et al. The MetaCyc database of metabolic pathways and enzymes and the BioCyc collection of Pathway/Genome Databases. Nucleic Acids Res. 2014;42:D459–471. doi: 10.1093/nar/gkt1103. [DOI] [PMC free article] [PubMed] [Google Scholar]
- Chaudhuri RR, Allen AG, Owen PJ, Shalom G, Stone K, Harrison M, Burgis TA, Lockyer M, Garcia-Lara J, Foster SJ, et al. Comprehensive identification of essential Staphylococcus aureus genes using Transposon-Mediated Differential Hybridisation (TMDH) BMC Genomics. 2009;10:291. doi: 10.1186/1471-2164-10-291. [DOI] [PMC free article] [PubMed] [Google Scholar]
- Collins SR, Schuldiner M, Krogan NJ, Weissman JS. A strategy for extracting and analyzing large-scale quantitative epistatic interaction data. Genome Biol. 2006;7:R63. doi: 10.1186/gb-2006-7-7-r63. [DOI] [PMC free article] [PubMed] [Google Scholar]
- Commichau FM, Pietack N, Stulke J. Essential genes in Bacillus subtilis: a re-evaluation after ten years. Mol Biosyst. 2013;9:1068–1075. doi: 10.1039/c3mb25595f. [DOI] [PubMed] [Google Scholar]
- de Berardinis V, Vallenet D, Castelli V, Besnard M, Pinet A, Cruaud C, Samair S, Lechaplais C, Gyapay G, Richez C, et al. A complete collection of single-gene deletion mutants of Acinetobacter baylyi ADP1. Mol Syst Biol. 2008;4:174. doi: 10.1038/msb.2008.10. [DOI] [PMC free article] [PubMed] [Google Scholar]
- Driks A. Bacillus subtilis spore coat. Microbiol Mol Biol Rev. 1999;63:1–20. doi: 10.1128/mmbr.63.1.1-20.1999. [DOI] [PMC free article] [PubMed] [Google Scholar]
- Eichenberger P, Jensen ST, Conlon EM, van Ooij C, Silvaggi J, Gonzalez-Pastor JE, Fujita M, Ben-Yehuda S, Stragier P, Liu JS, et al. The sigmaE regulon and the identification of additional sporulation genes in Bacillus subtilis. J Mol Biol. 2003;327:945–972. doi: 10.1016/s0022-2836(03)00205-5. [DOI] [PubMed] [Google Scholar]
- Eijlander RT, de Jong A, Krawczyk AO, Holsappel S, Kuipers OP. SporeWeb: an interactive journey through the complete sporulation cycle of Bacillus subtilis. Nucleic Acids Res. 2014;42:D685–691. doi: 10.1093/nar/gkt1007. [DOI] [PMC free article] [PubMed] [Google Scholar]
- El Feghaly RE, Bangar H, Haslam DB. The molecular basis of Clostridium difficile disease and host response. Curr Opin Gastroenterol. 2015;31:24–29. doi: 10.1097/MOG.0000000000000131. [DOI] [PubMed] [Google Scholar]
- Galperin MY, Koonin EV. Divergence and convergence in enzyme evolution. J Biol Chem. 2012;287:21–28. doi: 10.1074/jbc.R111.241976. [DOI] [PMC free article] [PubMed] [Google Scholar]
- Galperin MY, Mekhedov SL, Puigbo P, Smirnov S, Wolf YI, Rigden DJ. Genomic determinants of sporulation in Bacilli and Clostridia: towards the minimal set of sporulation-specific genes. Environ Microbiol. 2012;14:2870–2890. doi: 10.1111/j.1462-2920.2012.02841.x. [DOI] [PMC free article] [PubMed] [Google Scholar]
- Gray AN, Koo BM, Shiver AL, Peters JM, Osadnik H, Gross CA. High-throughput bacterial functional genomics in the sequencing era. Curr Opin Microbiol. 2015;27:86–95. doi: 10.1016/j.mib.2015.07.012. [DOI] [PMC free article] [PubMed] [Google Scholar]
- Grazziotin AL, Vidal NM, Venancio TM. Uncovering major genomic features of essential genes in Bacteria and a methanogenic Archaea. Febs J. 2015;282:3395–3411. doi: 10.1111/febs.13350. [DOI] [PMC free article] [PubMed] [Google Scholar]
- Gruber S, Veening JW, Bach J, Blettinger M, Bramkamp M, Errington J. Interlinked sister chromosomes arise in the absence of condensin during fast replication in B. subtilis. Curr Biol. 2014;24:293–298. doi: 10.1016/j.cub.2013.12.049. [DOI] [PMC free article] [PubMed] [Google Scholar]
- Hamoen LW, Venema G, Kuipers OP. Controlling competence in Bacillus subtilis: shared use of regulators. Microbiology. 2003;149:9–17. doi: 10.1099/mic.0.26003-0. [DOI] [PubMed] [Google Scholar]
- Heaton MP, Johnston RB, Thompson TL. Controlled lysis of bacterial cells utilizing mutants with defective synthesis of D-alanine. Can J Microbiol. 1988;34:256–261. doi: 10.1139/m88-047. [DOI] [PubMed] [Google Scholar]
- Heuston S, Begley M, Gahan CG, Hill C. Isoprenoid biosynthesis in bacterial pathogens. Microbiology. 2012;158:1389–1401. doi: 10.1099/mic.0.051599-0. [DOI] [PubMed] [Google Scholar]
- Higgins D, Dworkin J. Recent progress in Bacillus subtilis sporulation. FEMS Microbiol Rev. 2012;36:131–148. doi: 10.1111/j.1574-6976.2011.00310.x. [DOI] [PMC free article] [PubMed] [Google Scholar]
- Hu P, Janga SC, Babu M, Diaz-Mejia JJ, Butland G, Yang W, Pogoutse O, Guo X, Phanse S, Wong P, et al. Global functional atlas of Escherichia coli encompassing previously uncharacterized proteins. PLoS Biol. 2009;7:e96. doi: 10.1371/journal.pbio.1000096. [DOI] [PMC free article] [PubMed] [Google Scholar]
- Huang H, Pandya C, Liu C, Al-Obaidi NF, Wang M, Zheng L, Toews Keating S, Aono M, Love JD, Evans B, et al. Panoramic view of a superfamily of phosphatases through substrate profiling. Proc Natl Acad Sci U S A. 2015;112:E1974–1983. doi: 10.1073/pnas.1423570112. [DOI] [PMC free article] [PubMed] [Google Scholar]
- Huerta-Cepas J, Szklarczyk D, Forslund K, Cook H, Heller D, Walter MC, Rattei T, Mende DR, Sunagawa S, Kuhn M, et al. eggNOG 4.5: a hierarchical orthology framework with improved functional annotations for eukaryotic, prokaryotic and viral sequences. Nucleic Acids Res. 2016;44:D286–293. doi: 10.1093/nar/gkv1248. [DOI] [PMC free article] [PubMed] [Google Scholar]
- Jedrzejas MJ. The structure and function of novel proteins of Bacillus anthracis and other spore-forming bacteria: development of novel prophylactic and therapeutic agents. Crit Rev Biochem Mol Biol. 2002;37:339–373. doi: 10.1080/10409230290771537. [DOI] [PubMed] [Google Scholar]
- Kanehisa M, Goto S, Sato Y, Kawashima M, Furumichi M, Tanabe M. Data, information, knowledge and principle: back to metabolism in KEGG. Nucleic Acids Res. 2014;42:D199–205. doi: 10.1093/nar/gkt1076. [DOI] [PMC free article] [PubMed] [Google Scholar]
- Kato J, Hashimoto M. Construction of consecutive deletions of the Escherichia coli chromosome. Mol Syst Biol. 2007;3:132. doi: 10.1038/msb4100174. [DOI] [PMC free article] [PubMed] [Google Scholar]
- Kloosterman TG, Lenarcic R, Willis CR, Roberts DM, Hamoen LW, Errington J, Wu LJ. Complex polar machinery required for proper chromosome segregation in vegetative and sporulating cells of Bacillus subtilis. Mol Microbiol. 2016;101:333–350. doi: 10.1111/mmi.13393. [DOI] [PMC free article] [PubMed] [Google Scholar]
- Kobayashi K, Ehrlich SD, Albertini A, Amati G, Andersen KK, Arnaud M, Asai K, Ashikaga S, Aymerich S, Bessieres P, et al. Essential Bacillus subtilis genes. Proc Natl Acad Sci U S A. 2003;100:4678–4683. doi: 10.1073/pnas.0730515100. [DOI] [PMC free article] [PubMed] [Google Scholar]
- Kumar A, Beloglazova N, Bundalovic-Torma C, Phanse S, Deineko V, Gagarinova A, Musso G, Vlasblom J, Lemak S, Hooshyar M, et al. Conditional Epistatic Interaction Maps Reveal Global Functional Rewiring of Genome Integrity Pathways in Escherichia coli. Cell Rep. 2016;14:648–661. doi: 10.1016/j.celrep.2015.12.060. [DOI] [PubMed] [Google Scholar]
- Kuznetsova E, Proudfoot M, Gonzalez CF, Brown G, Omelchenko MV, Borozan I, Carmel L, Wolf YI, Mori H, Savchenko AV, et al. Genome-wide analysis of substrate specificities of the Escherichia coli haloacid dehalogenase-like phosphatase family. J Biol Chem. 2006;281:36149–36161. doi: 10.1074/jbc.M605449200. [DOI] [PubMed] [Google Scholar]
- Lachowicz TM, Morzejko E, Panek E, Piatkowski J. Inhibitory action of serine on growth of bacteria of the genus Bacillus on mineral synthetic media. Folia Microbiol. 1996;41:21–25. [Google Scholar]
- Langmead B, Salzberg SL. Fast gapped-read alignment with Bowtie 2. Nat Methods. 2012;9:357–359. doi: 10.1038/nmeth.1923. [DOI] [PMC free article] [PubMed] [Google Scholar]
- Letunic I, Bork P. Interactive tree of life (iTOL) v3: an online tool for the display and annotation of phylogenetic and other trees. Nucleic Acids Res. 2016;44:W242–245. doi: 10.1093/nar/gkw290. [DOI] [PMC free article] [PubMed] [Google Scholar]
- Maier L, Diard M, Sellin ME, Chouffane ES, Trautwein-Weidner K, Periaswamy B, Slack E, Dolowschiak T, Stecher B, Loverdo C, et al. Granulocytes impose a tight bottleneck upon the gut luminal pathogen population during Salmonella typhimurium colitis. PLoS Pathog. 2014;10:e1004557. doi: 10.1371/journal.ppat.1004557. [DOI] [PMC free article] [PubMed] [Google Scholar]
- Meeske AJ, Rodrigues CD, Brady J, Lim HC, Bernhardt TG, Rudner DZ. High-Throughput Genetic Screens Identify a Large and Diverse Collection of New Sporulation Genes in Bacillus subtilis. PLoS Biol. 2016;14:e1002341. doi: 10.1371/journal.pbio.1002341. [DOI] [PMC free article] [PubMed] [Google Scholar]
- Meeske AJ, Sham LT, Kimsey H, Koo BM, Gross CA, Bernhardt TG, Rudner DZ. MurJ and a novel lipid II flippase are required for cell wall biogenesis in Bacillus subtilis. Proc Natl Acad Sci U S A. 2015;112:6437–6442. doi: 10.1073/pnas.1504967112. [DOI] [PMC free article] [PubMed] [Google Scholar]
- Mende DR, Sunagawa S, Zeller G, Bork P. Accurate and universal delineation of prokaryotic species. Nat Methods. 2013;10:881–884. doi: 10.1038/nmeth.2575. [DOI] [PubMed] [Google Scholar]
- Merrikh H, Zhang Y, Grossman AD, Wang JD. Replication-transcription conflicts in bacteria. Nat Rev Microbiol. 2012;10:449–458. doi: 10.1038/nrmicro2800. [DOI] [PMC free article] [PubMed] [Google Scholar]
- Michna RH, Commichau FM, Todter D, Zschiedrich CP, Stulke J. SubtiWiki-a database for the model organism Bacillus subtilis that links pathway, interaction and expression information. Nucleic Acids Res. 2014;42:D692–698. doi: 10.1093/nar/gkt1002. [DOI] [PMC free article] [PubMed] [Google Scholar]
- Miquel S, Martin R, Rossi O, Bermudez-Humaran LG, Chatel JM, Sokol H, Thomas M, Wells JM, Langella P. Faecalibacterium prausnitzii and human intestinal health. Curr Opin Microbiol. 2013;16:255–261. doi: 10.1016/j.mib.2013.06.003. [DOI] [PubMed] [Google Scholar]
- Nester EW, Montoya AL. An enzyme common to histidine and aromatic amino acid biosynthesis in Bacillus subtilis. J Bacteriol. 1976;126:699–705. doi: 10.1128/jb.126.2.699-705.1976. [DOI] [PMC free article] [PubMed] [Google Scholar]
- Nichols RJ, Sen S, Choo YJ, Beltrao P, Zietek M, Chaba R, Lee S, Kazmierczak KM, Lee KJ, Wong A, et al. Phenotypic landscape of a bacterial cell. Cell. 2011;144:143–156. doi: 10.1016/j.cell.2010.11.052. [DOI] [PMC free article] [PubMed] [Google Scholar]
- O’Leary NA, Wright MW, Brister JR, Ciufo S, Haddad D, McVeigh R, Rajput B, Robbertse B, Smith-White B, Ako-Adjei D, et al. Reference sequence (RefSeq) database at NCBI: current status, taxonomic expansion, and functional annotation. Nucleic Acids Res. 2016;44:D733–745. doi: 10.1093/nar/gkv1189. [DOI] [PMC free article] [PubMed] [Google Scholar]
- Porwollik S, Santiviago CA, Cheng P, Long F, Desai P, Fredlund J, Srikumar S, Silva CA, Chu W, Chen X, et al. Defined single-gene and multi-gene deletion mutant collections in Salmonella enterica sv Typhimurium. PLoS One. 2014;9:e99820. doi: 10.1371/journal.pone.0099820. [DOI] [PMC free article] [PubMed] [Google Scholar]
- Roguev A, Wiren M, Weissman JS, Krogan NJ. High-throughput genetic interaction mapping in the fission yeast Schizosaccharomyces pombe. Nat Methods. 2007;4:861–866. doi: 10.1038/nmeth1098. [DOI] [PubMed] [Google Scholar]
- Santiago M, Matano LM, Moussa SH, Gilmore MS, Walker S, Meredith TC. A new platform for ultra-high density Staphylococcus aureus transposon libraries. BMC Genomics. 2015;16:252. doi: 10.1186/s12864-015-1361-3. [DOI] [PMC free article] [PubMed] [Google Scholar]
- Servant P, Le Coq D, Aymerich S. CcpN (YqzB), a novel regulator for CcpA-independent catabolite repression of Bacillus subtilis gluconeogenic genes. Mol Microbiol. 2005;55:1435–1451. doi: 10.1111/j.1365-2958.2005.04473.x. [DOI] [PubMed] [Google Scholar]
- Shiver AL, Osadnik H, Kritikos G, Li B, Krogan N, Typas A, Gross CA. A Chemical-Genomic Screen of Neglected Antibiotics Reveals Illicit Transport of Kasugamycin and Blasticidin S. PLoS Genet. 2016;12:e1006124. doi: 10.1371/journal.pgen.1006124. [DOI] [PMC free article] [PubMed] [Google Scholar]
- Silvaggi JM, Popham DL, Driks A, Eichenberger P, Losick R. Unmasking novel sporulation genes in Bacillus subtilis. J Bacteriol. 2004;186:8089–8095. doi: 10.1128/JB.186.23.8089-8095.2004. [DOI] [PMC free article] [PubMed] [Google Scholar]
- Son MS, Taylor RK. Preparing DNA libraries for multiplexed paired-end deep sequencing for Illumina GA sequencers. Curr Protoc Microbiol. 2011;Chapter 1(Unit 1E):4. doi: 10.1002/9780471729259.mc01e04s20. [DOI] [PMC free article] [PubMed] [Google Scholar]
- Sonenshein AL, Hoch JA, Losick R. Bacillus subtilis and its closest relatives: from genes to cells. Washington, D.C: ASM Press; 2002. [Google Scholar]
- Subramaniam AR, Deloughery A, Bradshaw N, Chen Y, O’Shea E, Losick R, Chai Y. A serine sensor for multicellularity in a bacterium. eLife. 2013;2:e01501. doi: 10.7554/eLife.01501. [DOI] [PMC free article] [PubMed] [Google Scholar]
- Subramanian A, Tamayo P, Mootha VK, Mukherjee S, Ebert BL, Gillette MA, Paulovich A, Pomeroy SL, Golub TR, Lander ES, et al. Gene set enrichment analysis: a knowledge-based approach for interpreting genome-wide expression profiles. Proc Natl Acad Sci U S A. 2005;102:15545–15550. doi: 10.1073/pnas.0506580102. [DOI] [PMC free article] [PubMed] [Google Scholar]
- Trach KA, Hoch JA. Multisensory activation of the phosphorelay initiating sporulation in Bacillus subtilis: identification and sequence of the protein kinase of the alternate pathway. Mol Microbiol. 1993;8:69–79. doi: 10.1111/j.1365-2958.1993.tb01204.x. [DOI] [PubMed] [Google Scholar]
- Typas A, Nichols RJ, Siegele DA, Shales M, Collins SR, Lim B, Braberg H, Yamamoto N, Takeuchi R, Wanner BL, et al. High-throughput, quantitative analyses of genetic interactions in E. coli. Nat Methods. 2008;5:781–787. doi: 10.1038/nmeth.1240. [DOI] [PMC free article] [PubMed] [Google Scholar]
- UniProt C. UniProt: a hub for protein information. Nucleic Acids Res. 2015;43:D204–212. doi: 10.1093/nar/gku989. [DOI] [PMC free article] [PubMed] [Google Scholar]
- Untergasser A, Cutcutache I, Koressaar T, Ye J, Faircloth BC, Remm M, Rozen SG. Primer3--new capabilities and interfaces. Nucleic Acids Res. 2012;40:e115. doi: 10.1093/nar/gks596. [DOI] [PMC free article] [PubMed] [Google Scholar]
- Vallenet D, Belda E, Calteau A, Cruveiller S, Engelen S, Lajus A, Le Fevre F, Longin C, Mornico D, Roche D, et al. MicroScope--an integrated microbial resource for the curation and comparative analysis of genomic and metabolic data. Nucleic Acids Res. 2013;41:D636–647. doi: 10.1093/nar/gks1194. [DOI] [PMC free article] [PubMed] [Google Scholar]
- Vasudevan P, McElligott J, Attkisson C, Betteken M, Popham DL. Homologues of the Bacillus subtilis SpoVB protein are involved in cell wall metabolism. J Bacteriol. 2009;191:6012–6019. doi: 10.1128/JB.00604-09. [DOI] [PMC free article] [PubMed] [Google Scholar]
- Wetmore KM, Price MN, Waters RJ, Lamson JS, He J, Hoover CA, Blow MJ, Bristow J, Butland G, Arkin AP, et al. Rapid quantification of mutant fitness in diverse bacteria by sequencing randomly bar-coded transposons. MBio. 2015;6:e00306–00315. doi: 10.1128/mBio.00306-15. [DOI] [PMC free article] [PubMed] [Google Scholar]
- Xu L, Sedelnikova SE, Baker PJ, Hunt A, Errington J, Rice DW. Crystal structure of S. aureus YlaN, an essential leucine rich protein involved in the control of cell shape. Proteins. 2007;68:438–445. doi: 10.1002/prot.21377. [DOI] [PubMed] [Google Scholar]
- Xu P, Ge X, Chen L, Wang X, Dou Y, Xu JZ, Patel JR, Stone V, Trinh M, Evans K, et al. Genome-wide essential gene identification in Streptococcus sanguinis. Sci Rep. 2011;1:125. doi: 10.1038/srep00125. [DOI] [PMC free article] [PubMed] [Google Scholar]
- Yamamoto N, Nakahigashi K, Nakamichi T, Yoshino M, Takai Y, Touda Y, Furubayashi A, Kinjyo S, Dose H, Hasegawa M, et al. Update on the Keio collection of Escherichia coli single-gene deletion mutants. Mol Syst Biol. 2009;5:335. doi: 10.1038/msb.2009.92. [DOI] [PMC free article] [PubMed] [Google Scholar]
- Yan X, Yu HJ, Hong Q, Li SP. Cre/lox system and PCR-based genome engineering in Bacillus subtilis. Appl Environ Microbiol. 2008;74:5556–5562. doi: 10.1128/AEM.01156-08. [DOI] [PMC free article] [PubMed] [Google Scholar]
- Yoshida K, Yamaguchi H, Kinehara M, Ohki YH, Nakaura Y, Fujita Y. Identification of additional TnrA-regulated genes of Bacillus subtilis associated with a TnrA box. Mol Microbiol. 2003;49:157–165. doi: 10.1046/j.1365-2958.2003.03567.x. [DOI] [PubMed] [Google Scholar]
- Zeigler DR, Pragai Z, Rodriguez S, Chevreux B, Muffler A, Albert T, Bai R, Wyss M, Perkins JB. The origins of 168, W23, and other Bacillus subtilis legacy strains. J Bacteriol. 2008;190:6983–6995. doi: 10.1128/JB.00722-08. [DOI] [PMC free article] [PubMed] [Google Scholar]
- Zheng WX, Luo CS, Deng YY, Guo FB. Essentiality drives the orientation bias of bacterial genes in a continuous manner. Sci Rep. 2015;5:16431. doi: 10.1038/srep16431. [DOI] [PMC free article] [PubMed] [Google Scholar]
- Zlitni S, Ferruccio LF, Brown ED. Metabolic suppression identifies new antibacterial inhibitors under nutrient limitation. Nat Chem Biol. 2013;9:796–804. doi: 10.1038/nchembio.1361. [DOI] [PMC free article] [PubMed] [Google Scholar]
Associated Data
This section collects any data citations, data availability statements, or supplementary materials included in this article.