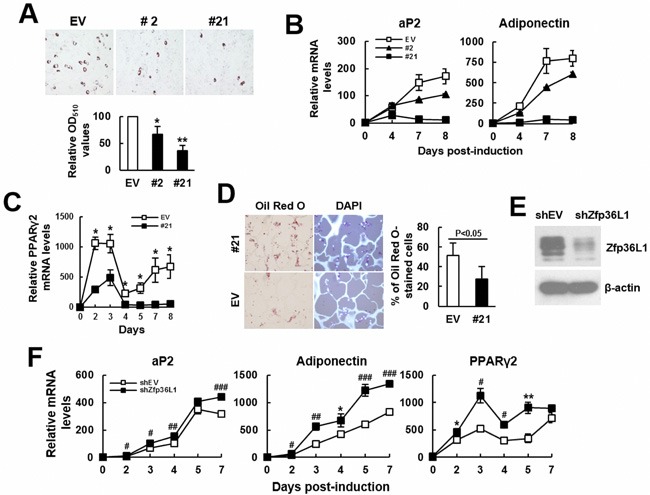
Figure 5. ZFP36L1 regulated adipogenic differentiation of C3H10T1/2 cells.

A. Adipogenic differentiation. C3H10T1/2 control (EV), clone 2 (#2), and clone 21(#21) cells were induced to undergo adipogenic differentiation. Cells were stained with Oil Red O 8 days post-induction. Representative photos are shown. The stains were quantitated, and the signals of #2 and #21 were compared to that of EV cells (to which a value of 100 was assigned). *, P < 0.05; **, P < 0.005 versus EV control. B. RT-qPCR analyses. The expression kinetics of aP2 and adiponectin mRNAs in cells after adipogenic induction were examined, and presented in relative to EV control of day 0 (to which a value of 1 was assigned). C. RT-qPCR analyses. The expression kinetics of Pparγ2 mRNA in EV and #21 cells after adipogenic induction were shown. *, P < 0.05 versus EV control. D. Ex vivo experiments and histological analyses. EV and #21 cells were seeded into 3 scaffolds (4 × 10⁵ cells/scaffold) separately, and implanted in pairs into the back of 3 nude mice. Implants were retrieved 2 weeks after implantation and prepared for histological analysis. Histological sections were stained with Oil Red O and DAPI. Representative images are shown. The ratio of Oil Red O-stained cells were calculated. E. Western blot analyses. ZFP36L1 expression of ZFP36L1-knockdown (shZFP36L1) and control (shEV) C3H10T1/2 cells were shown. F. RT-qPCR analyses. shEV and shZFP36L1 cells were induced to undergo adipogenic differentiation. The expression kinetics of aP2, adiponectin, and Pparγ2 mRNAs were shown. *, P < 0.05; **. P < 0.01; #, P < 0.005; ##, P < 0.001; ###, P < 0.0001 versus corresponding EV control.
