
Figure 3. Protein and mRNA expression in transfected cells.
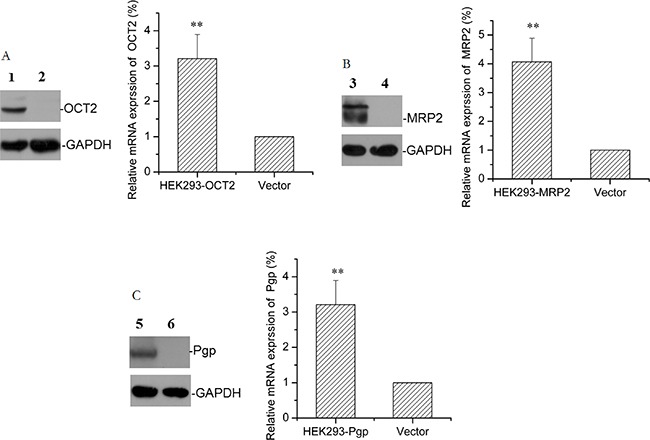
The representative protein bands and the relative mRNA levels of OCT2 (A), Mrp2 (B), and Pgp (C) in HEK293 transfected cells overexpressing OCT2, Mrp2, and Pgp or in HEK293-vector cells are shown. (1) HEK293-OCT2, (3) HEK293-Mrp2, (5) HEK293-Pgp; (2, 4, 6) HEK293-vector. Error bars indicate SD. **p < 0.01 compared with the vector.