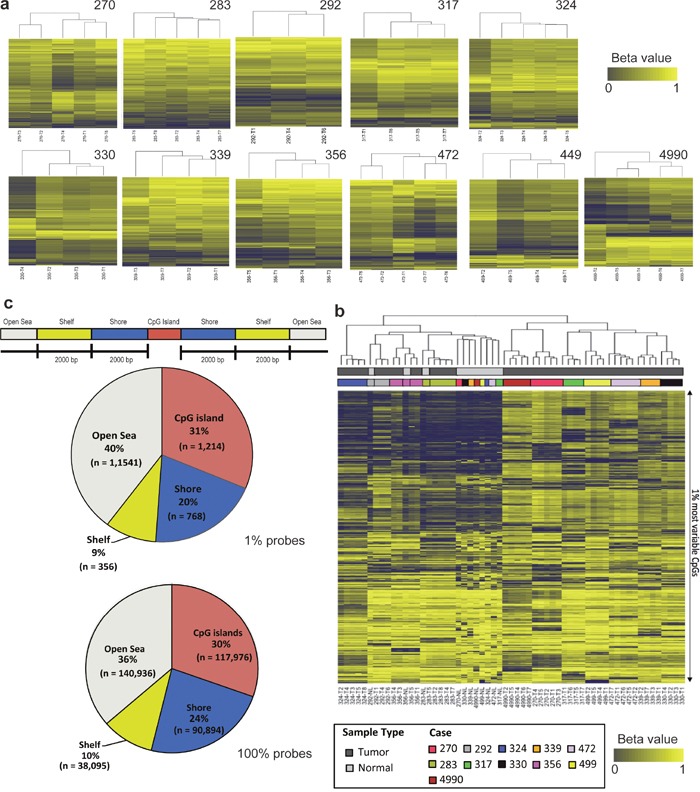
Figure 1. Assessment of methylation intratumor and intertumor heterogeneity of localized lung adenocarcinomas.

(a) Unsupervised hierarchical clustering of intratumoral DNA methylation. Columns are the tumor regions and rows are the DNA methylation status (beta values; ranged from 0 to 1) for the top 1% CpG probes (n = 4, 855). Dark blue denotes low and yellow indicates high methylation level. (b) Unsupervised hierarchical clustering of intertumoral DNA methylation across the cohort of 11 patients for the top 1% CpG probes (n = 3, 879). (c) Top: DNA methylation CpG probes are mapped to gene regions relatively to the proximity to CpG island. Bottom: Genomic distributions of the CpG probes obtained from 1% probes and 100% probes.
