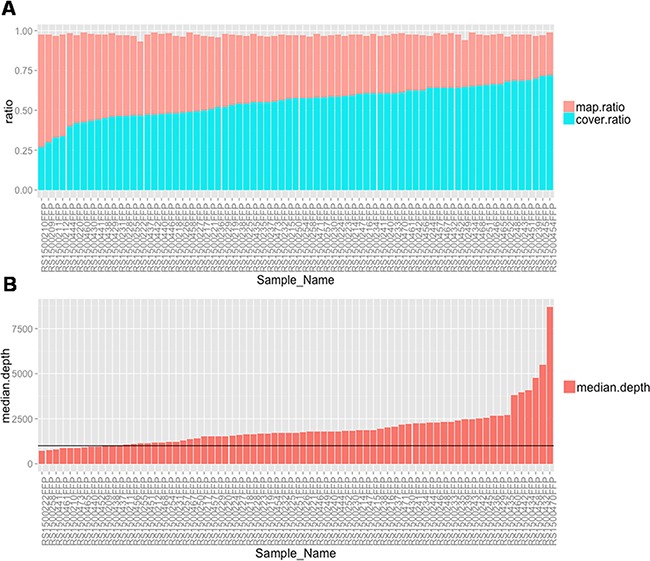
Figure 2. Quality assessment of the targeted sequencing data among 75 samples.

(A) Histogram show the percentage of all mapped reads and percentage of reads mapped to target regions for every sample. (B) Bar plot of The median coverage depth among all the target regions for each sample.
