Abstract
Purpose
Balanced steady state free precession (bSSFP) sequences can provide superior SNR efficiency for hyperpolarized 13C MRI by efficiently utilizing the non-recoverable magnetization, but managing their spectral response is challenging in the context of metabolic imaging. A new spectrally selective bSSFP sequence was developed for fast imaging of multiple hyperpolarized 13C metabolites with high spatiotemporal resolution.
Methods
This novel approach for bSSFP spectral selectivity incorporates optimized short duration spectrally selective RF pulses within a bSSFP pulse train and a carefully chosen TR to avoid banding artifacts.
Results
The sequence enabled sub-second 3D dynamic spectrally selective imaging of 13C metabolites of co-polarized [1-13C]pyruvate and [13C]urea at 2mm isotropic resolution, with excellent spectral selectivity (~100:1). The sequence was successfully tested in phantom studies and in vivo studies with normal mice.
Conclusion
This sequence is expected to benefit applications requiring dynamic volumetric imaging of metabolically active 13C compounds at high spatiotemporal resolution including preclinical studies at high field and potentially clinical studies.
Keywords: balanced SSFP, spectrally selective, hyperpolarized C-13, optimized RF pulse design, banding artifact
Introduction
Hyperpolarized (HP) 13C MRI with dissolution Dynamic Nuclear Polarization (DNP), with its sensitivity enhancements of >10,000 fold over thermal equilibrium values, enables non-invasive, spatially localized measurements of the enzymatic conversions of endogenous, nontoxic 13C-labeled probes through key biochemical pathways (1,2). This technology is distinguished by the capability to simultaneously image both injected agents and their downstream metabolic products separately, based on their unique chemical shifts. HP 13C MRI has been successfully applied in numerous preclinical studies, and a recent clinical trial in prostate cancer patients showed safety and feasibility of this approach for investigating human disease (3,4).
Unique challenges faced in HP 13C metabolic imaging include the non-recoverable nature of HP magnetization and the complex pattern of resonances that must be spectrally resolved. Rapid and efficient MRI pulse sequences are required to acquire data within the limited temporal window dictated by the rapid irreversible T1 decay of HP magnetization. Various approaches for MR spectroscopic imaging (MRSI) have been applied for HP 13C, including standard chemical shift imaging (CSI) (2), echo-planar spectroscopic imaging (EPSI) (5–7), and spiral CSI (8). These MRSI sequences have high spectral resolution but are generally limited by low spatiotemporal resolution. Alternatively, by exploiting a priori knowledge of the spectral distribution of resonances, spatiotemporal resolution can be improved at the expense of spectral resolution. Examples of this approach include spectrally selective imaging with multi-echo chemical shift separation (9), and spectral-spatial excitation of individual metabolites followed by spiral (10–11) or echo-planar imaging readouts (12–13).
Compared to small flip angle spoiled gradient echo acquisitions (9–13), the balanced steady state free precession (bSSFP) sequence can more efficiently utilize the non-recoverable HP magnetization by preserving transverse magnetization across multiple TR’s, which is especially valuable for 13C nuclei with long T2’s (18). Due to their high SNR efficiency, bSSFP sequences are routinely used for rapid morphological and cardiac 1H MRI (14,15). A bSSFP approach has been previously applied for HP 13C perfusion imaging and angiography with improved spatiotemporal resolution using metabolically inactive agents with a single HP resonance (16–19). The bSSFP sequence incorporates the desirable refocusing performance of spin echo sequences (20) with the flexibility to operate in the small flip angle regime to maximize the temporal window for dynamic data acquisition, with short TR and high sampling efficiency. The bSSFP sequence is also relatively insensitive to B1 variation or miscalibration of transmitter gain (7).
However, managing the spectral response of bSSFP sequences is difficult in the context of HP 13C metabolic imaging, which has unique additional challenges as compared to spectrally selective 1H bSSFP (i.e. water-fat separation), including: 1) Typically there are several resonances (>2) that need to be separated; 2) Quantitative measurement of each compound is required, hence reducing one component qualitatively is not an option (i.e. fat suppression); 3) HP magnetization decays irreversibly and cannot be recovered once saturated; 4) Fast acquisition is required due to rapid metabolic conversion and HP signal decay; and 5) HP signal necessarily evolves in a transient state, as there is no true steady state. These additional considerations limit the usage of some previous methods developed for 1H bSSFP water-fat separation, such as insertion of a spectrally selective saturation pulse in steady state (21), which will cause irreversible HP signal loss; phase detection (22), which is most suitable for separating only two compounds and suffers from the partial volume effect; fluctuating equilibrium (23) and other similar approaches taking advantage of banding artifact (24–26), which cannot provide sufficient suppression for quantitative measurement.
Several bSSFP approaches for spectrally selective HP 13C metabolic imaging have been developed, including methods based on multi-echo Dixon-type separation (27), metabolite-specific imaging using the low flip angle frequency response (28,29), chemical shift separation with low readout bandwidth (30,31), and fitting of multiple acquisitions with variable phase advance (32). However, these methods have various respective limitations including: 1) long TR (27,30), 2) narrow excitation bandwidth (~ ±10Hz) and suboptimal SNR (28,29), 3) low readout bandwidth and requirement for wide spectral separation (30), and 4) several assumptions required including ignoring T1 and T2, knowledge of B0 map and exact flip angle, and establishment of steady state (32). For methods simultaneously exciting all compounds (27,32), a complicated spectroscopic reconstruction is required, which may be prone to error and could result in spurious local effects in areas with imperfect shims. Off-resonance insensitivity is degraded by either narrow excitation bandwidth (28,29), long TR (27,30), or less robust reconstruction (27,32).
In this work, we developed a new method for spectrally selective bSSFP for fast imaging of multiple HP 13C metabolites with high spatiotemporal resolution that, compared to previous methods, is more insensitive to off-resonance and more SNR efficient with simple and robust reconstruction. The key feature of this new pulse sequence is a combination of novel optimized short duration spectrally selective RF pulses (33) and a bSSFP pulse train with a carefully chosen TR to avoid banding artifacts. In this study, we tested this new sequence in phantoms and then applied it for in vivo HP 13C mouse imaging at 14T with 2mm isotropic spatial resolution and <1s temporal resolution. Co-polarized [1-13C]pyruvate and [13C]urea (34) were used as the injected substrates, which allows for combined perfusion and metabolic imaging. Several previous clinical studies have shown that a perfusion–metabolism mismatch is associated with adverse disease features in human cancers (35–37), and therefore combined imaging of perfusion and metabolism could provide improved classification of individual cancers.
Theory
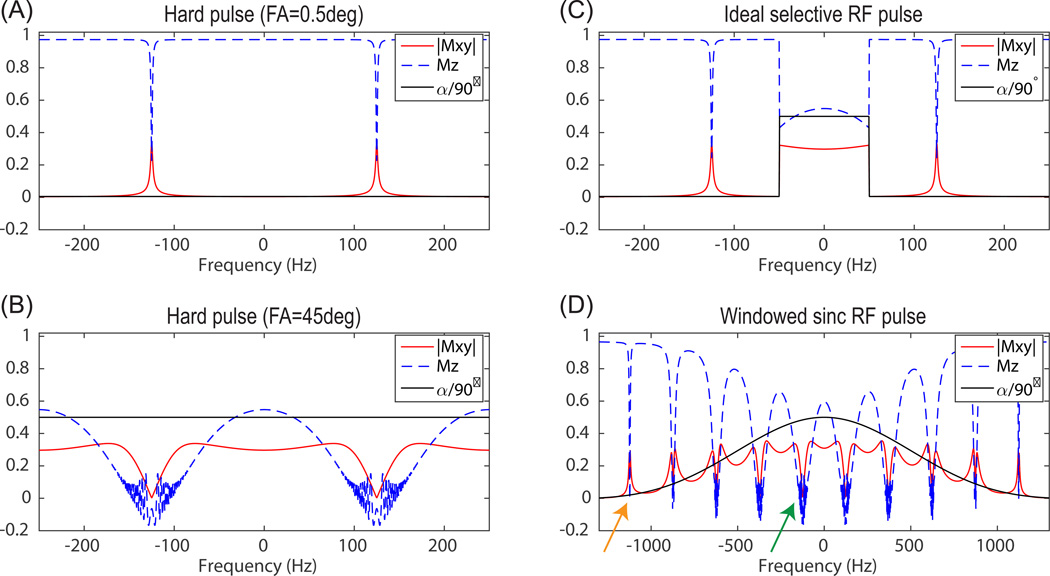
The bSSFP pulse train has an intrinsic periodic frequency response with periodicity 1/TR, as shown in Fig. 1 (A, B). With alternating 1/−1 RF modulation, spins around the center of each cycle (f= …, −1/TR, 0, 1/TR, …) behave as desired, in that a large flip angle excites magnetization while a small flip angle keeps spins unaffected. The opposite behavior exists at the edge of each cycle (f= …, −1/(2TR), 1/(2TR), …), where a large flip angle results in little longitudinal and transverse magnetization while a small flip angle produces significant excitation over a small frequency range.
Figure 1.
bSSFP frequency response with small flip angle (0.5°) hard pulse (A), large flip angle (45°) hard pulse (B), ideal selective RF pulse (passband/stopband flip angle = 45°/0.5°) (C), and a windowed sinc RF pulse (flip angle = 45°, duration = 2ms, bandwidth = 1kHz). “|Mxy|” is the averaged transverse magnetization over all echoes during transient state, “Mz” is the longitudinal magnetization after the last echo, “α/90°” is RF pulse excitation flip angle divided by 90°. Simulation parameters included: number of echoes = 256, TR = 4ms, T1 = 40s, T2 = 300ms, and linear ramp preparation pulse (N = 5).
Previous studies have employed excitation by a non-selective RF pulse with either large flip angles and metabolites placed near the center of each cycle (27, 30), or small flip angles with metabolites placed near the edge of each cycle (28,29,32). If spectrally selective RF pulses are used in a bSSFP pulse train, the overall spectral selectivity is a combination of the frequency response of the RF pulse and the bSSFP pulse train (54). Assuming an ideal selective RF pulse is used (Fig. 1(C)), the overall spectrally selective profile will have a passband at the same frequency as the RF pulse profile passband. However, there are also undesired narrow excitation bands at the edge of each cycle due to accumulated small flip angle excitations, which will be termed “excitation banding artifact” (to distinguish from the more common notion of bSSFP banding artifact corresponding to image signal loss). The RF pulse in Fig. 1(C) is infeasible since selective RF pulses have finite pulse duration and transition from passband to stopband in the pulse profile. The bSSFP frequency response with a spectrally selective windowed sinc RF pulse is shown in Fig. 1(D), with RF pulse profile passband covering multiple cycles (1/TR). Excitation banding artifact occurs at RF pulse profile stopband (orange arrow in Fig. 1(D)), while banding artifact corresponding to signal loss occurs at passband (green arrow in Fig. 1(D)).
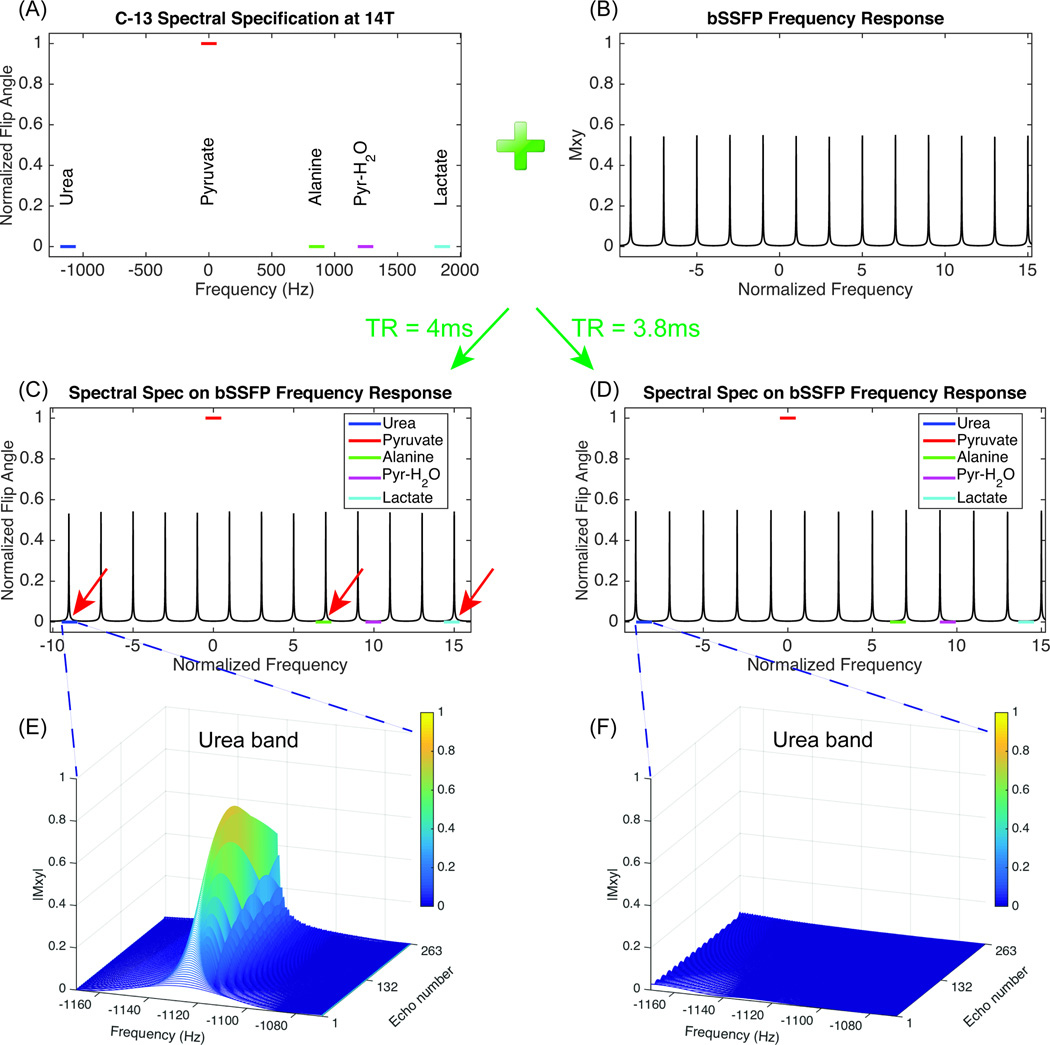
In this method, spectrally selective RF pulses are used to excite a single metabolite per acquisition. The undesired excitation banding artifacts are avoided by carefully choosing TR to place all resonance peaks close to center of each cycle. The resonance frequency of each compound is fixed, while the bSSFP frequency response can be widened or narrowed by decreasing or increasing TR. For selective imaging of each specific metabolite, an optimal TR value was derived, and a different optimized RF pulse waveform was created. Since the TR optimization problem has only one variable, it can be easily solved by scanning a range of feasible value of TR, and choosing one which places the selected resonance peak closest to the center of bSSFP cycle, while meeting the constraint that all other resonance peaks do not touch the edge of each cycle with certain margin. An implementation of this approach is shown in Fig 2, designed for selectively exciting pyruvate in experiments with co-polarized substrate [1-13C]pyruvate and [13C]urea. Resonance peaks of urea, pyruvate, pyruvate hydrate, and metabolic products (alanine, lactate) at 14T are considered (Fig. 2(A)). To increase insensitivity to B0 inhomogeneity, a finite bandwidth around each resonance frequency (±50Hz) is specified, within which a uniform spectrally selective profile is desired. Pyruvate is specified to be in the RF pulse’s passband while the other four resonances are specified as stopbands. Nevertheless, due to the bSSFP frequency response, there can be excitation even with the low flip angle produced in the RF pulse’s stopbands (Fig. 2(B)). For example, choosing a suboptimal TR of 4ms results in the urea, alanine and lactate stopbands being near the excitation banding artifact frequency (red arrow in Fig. 2(C)), and the simulated urea stopband shows an undesired narrow excitation peak (Fig. 2(E)). Thus, in this method, it is important to choose a proper TR. In this example, with an optimal TR of 3.8ms, all bands are located close to center of a cycle (Fig. 2(D)), and the simulated urea stopband shows negligible excitation (Fig. 2(F)). The excitation passband is always placed around center (f = 0) for larger bandwidth and higher SNR efficiency, compared to being located at band edge with small flip angle (28,29,32).
Figure 2.
Diagram of TR selection process for avoiding excitation banding artifact. Multiband spectral specification of urea, pyruvate, pyruvate hydrate, alanine and lactate in this implementation (selective excitation of pyruvate), with height corresponding to the desired RF pulse excitation flip angle and with finite bandwidth (±50Hz) for improving B0 insensitivity (A). bSSFP frequency response with low flip angle (0.5°) (B). Normalized frequency is frequency over 1/(2TR). Locate spectral specification on top of bSSFP frequency response with suboptimal TR of 4ms (C), and optimal TR of 3.8ms (D). Simulated transient state echo train within urea stopband with TR of 4ms (E), and TR of 3.8ms (F). Simulation parameters include: number of echoes = 256, T1 = 30s, T2 = 1s, α/2 – TR/2 preparation pulse.
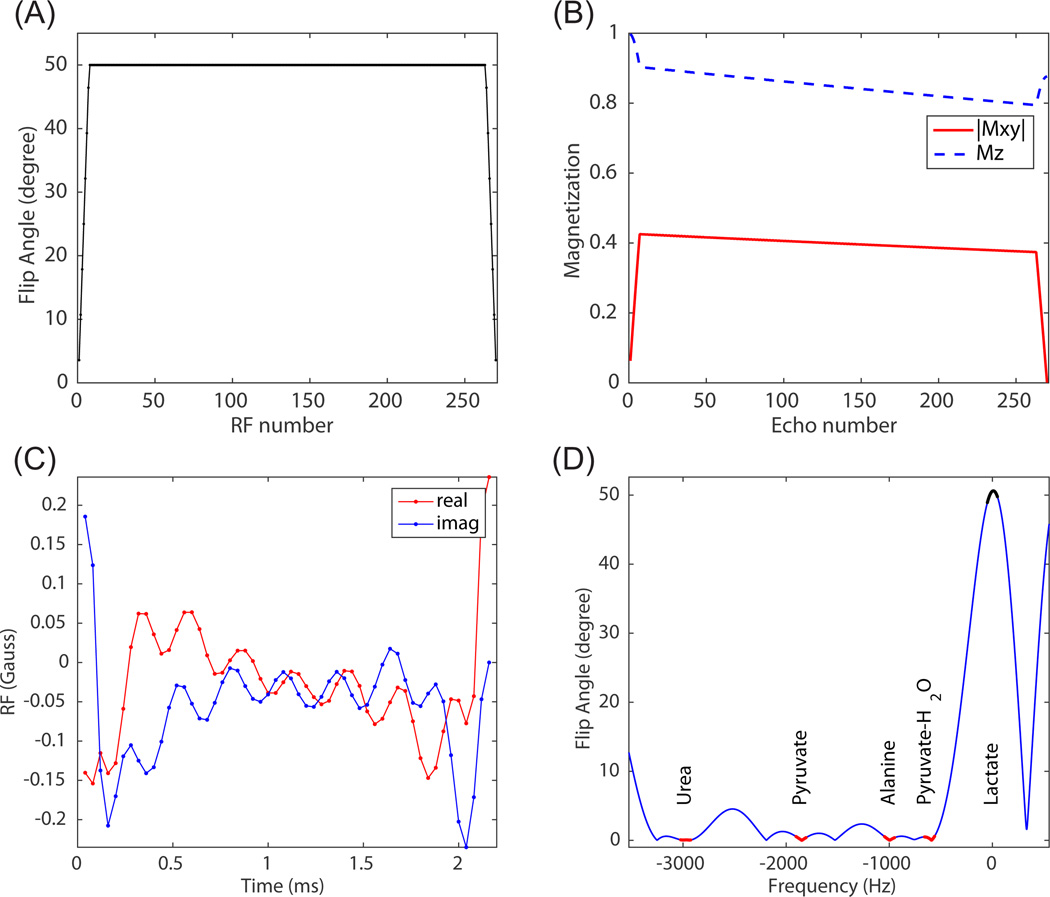
Spectrally selective RF pulses are usually not used in bSSFP due to long pulse duration. An optimized selective RF pulse with the shortest possible duration (33) was used to keep TR and total scan time short. The minimum pulse duration was achieved by exploiting spectral sparsity, specifying a multiband profile and releasing the constraint on “don’t-care” regions (33). The optimal pyruvate/lactate/urea excitation pulse had durations of 1.40ms/2.04ms/1.04ms, much shorter than a conventional RF pulse design with minimum-phase low-pass filter (~5ms), with one example shown in Fig. 3(C,D) and more detailed comparison in (33).
Figure 3.
Flip angle scheme including a ramp-up preparation pulse and ramp-down flip back pulse (A). Simulated on-resonance magnetization evolution (B). Simulation parameters include: number of echoes = 256, T1 = 40s, T2 = 1s, TR = 3.785ms. Optimized lactate-only RF pulse with shortest duration (C), and its simulated spectral profile (D).
A set of ramp-up preparation pulses was applied before acquisition (Fig. 3 (A)), to reduce transient state signal oscillations and achieve pseudo steady-state (Fig. 3 (B)) (38–40). A set of ramp-down pulses was applied after the acquisition to flip magnetization back to Mz to increase signal in subsequent acquisitions. Similar to how the ramp up preparation pulse outperforms the α/2 − TR/2 preparation pulse by working for a larger range of off-resonance frequencies (40), this ramp-down flip back pulse is also more insensitive to off-resonance compared to the conventional driven equilibrium pulse (16). Besides, a RF pulse with duration longer than TR/2 can be fit in the ramp down flip back pulse, but not in the driven equilibrium pulse with TR/2 interval. The flip angle modulation of preparation pulse and flip back pulse is achieved by linearly scaling RF pulse amplitude. However, the optimized RF pulse is designed based on the Shinnar-Le Roux algorithm (33) so the pulse profile gets degraded after scaling (41). This is not very problematic in our dynamic studies with primarily small flip angles (< 50 degree).
Methods
Bloch simulation
Though the RF pulses used in this study were optimized with shorter duration compared to conventional SLR pulses, the pulse durations (1~2ms) still take a considerable fraction of TR (3~4ms), thus violating the assumption of an instantaneous RF pulse, which is utilized in the common bSSFP theoretical framework. Therefore, T1 and T2 relaxation and off-resonance induced rotation can no longer be ignored during the RF pulse. The finite RF pulse effect has been studied previously and an analytical modification of bSSFP signal formulation was derived for steady-state signal (42). However, bSSFP transient state signal is used for HP 13C imaging, and a general analytical correction for the finite RF pulse effect is difficult to obtain, given the time dependent signal and arbitrary RF pulse waveform. Therefore, a numerical Bloch simulation was performed to compare bSSFP transient state signal evolution with both an ideal instantaneous RF pulse and the actual RF pulse used in this study, using a matrix formulation of the Bloch equation (43–46). Both signal at echo time (TE=TR/2) and signal evolutions between two RF pulses were simulated. For the ideal instantaneous RF pulse, a constant flip angle at all frequencies was assumed. The ramp up preparation pulse and ramp down flip back pulse were also included in the simulation.
Hardware
The pulse sequence was implemented on a 14.1T vertical Varian NMR microimaging system (Agilent Technologies, Santa Clara, CA, USA) with a 38mm dual-tuned (13C/1H) volume RF coil. A custom 3D bSSFP sequence was implemented with optimized RF pulses. The sequence can run dynamically and cycle the transmit frequency among the Larmor frequencies of pyruvate, lactate and urea when images are acquired for each metabolite. The RF transmit gain was calibrated with a 13C-enriched urea phantom, placed near the center of the RF coil. Dissolution DNP was performed with a HyperSense polarizer (Oxford Instruments, Oxford, UK) operating at 1.3 K and 3.35 T.
Phantom Measurements
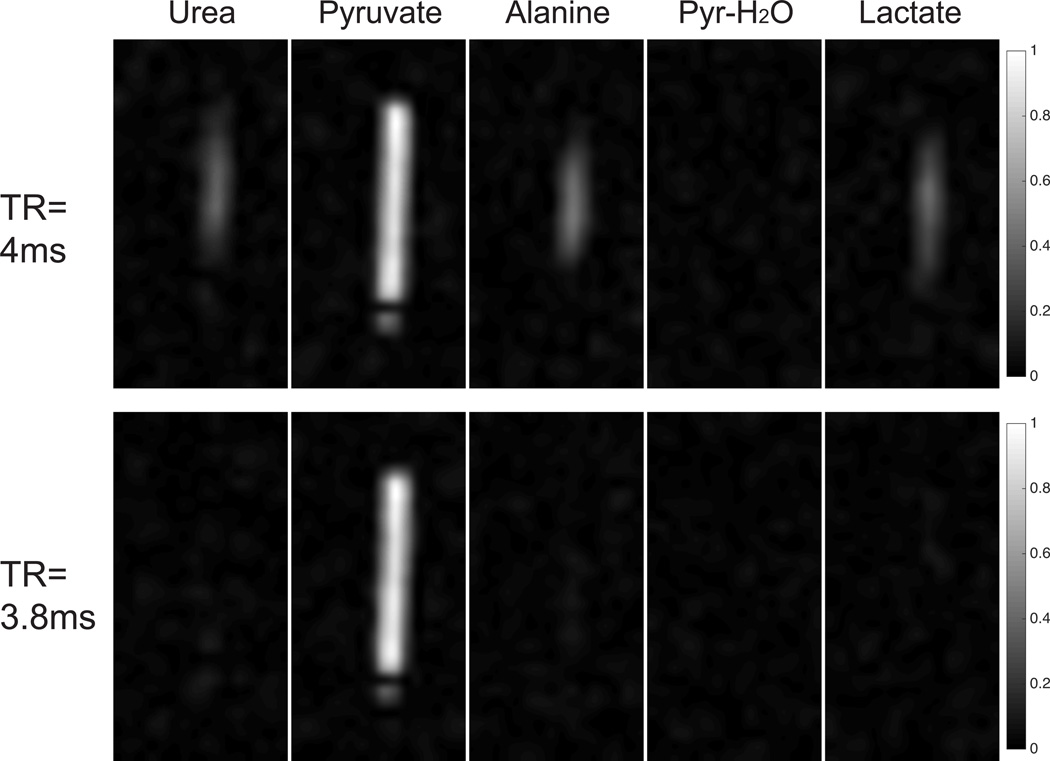
The spectral selectivity of the sequence was tested using a [1-13C]lactate phantom (at thermal equilibrium instead of HP state). To test the spectral selectivity at the resonance frequency of each metabolite without preparing a separate phantom for each metabolite, the transmitter frequency was cycled through several values so that the relative frequency of the lactate phantom corresponded to the chemical shift difference of each 13C compound at 14T, including urea, pyruvate, alanine, pyruvate hydrate, and lactate. Two values of TR were tested when exciting “pyruvate” only, as shown in Fig. 2: an optimal TR of 3.8ms that avoids excitation banding artifact, and a suboptimal TR of 4ms. A pyruvate-only RF pulse was used with flip angle of 120° and pulse duration of 1.8ms. Other sequence parameters were the same as the in vivo experiments, which will be introduced later.
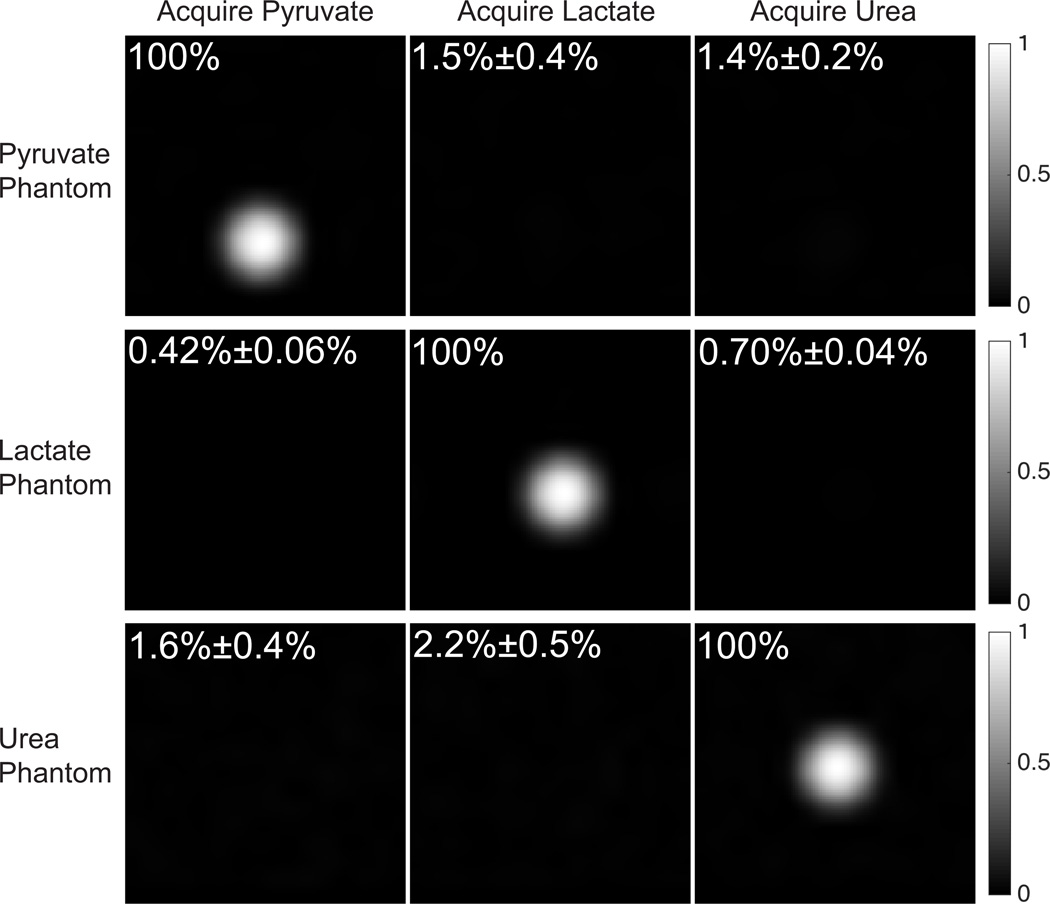
The sequence was also tested with phantoms containing HP [1-13C]pyruvate, [1-13C]lactate or [13C]urea solution individually. For each of these three compounds, the compound was individually polarized and then spectrally selective images of all three resonances were acquired. The sequence parameters were the same as the in vivo study, except with 1s delay after one cycle of pyruvate-lactate-urea acquisitions (no delay within this cycle). Spectral selectivity was measured based on image intensity and normalized among images acquired with the same HP sample. For example, the spectral selectivity of pyruvate:urea was calculated by the image intensity of pyruvate acquisition with HP urea sample over the image intensity of urea acquisition with the same HP urea sample. The spectral selectivity calculated in this way depends on flip angle and ordering of acquisition. Since the same sequence was intended for the in vivo study, this spectral selectivity provided insight as to the capability for resolving these resonances in vivo, and as to the extent of signal contamination from other metabolites in each metabolite-specific image.
In vivo Experiments
Five normal mice were imaged under a protocol approved by the UCSF Institutional Animal Care and Use Committee, as previously described (47). A 350 µL HP solution (80mM [1-13C]pyruvate + 120mM [13C, 15N2]urea, pH ~ 7.5, room temperature) was injected into the mouse tail vein catheter over 12 s with image acquisition starting at 15 s after the beginning of the injection. HP pyruvate, lactate and urea images were acquired sequentially with respiratory triggering (~1Hz) (one acquisition per respiratory cycle). Six time points were acquired (18 acquisitions in total, ~18s). The sequence parameters for pyruvate/lactate/urea acquisition included: TR = 3.362ms/3.785ms/2.617ms; TE = TR/2; flip angle = 15°/40°/20°; RF pulse duration = 1.40ms/2.04ms/1.04ms; sequence duration = 0.861s/0.969s/0.670s; readout bandwidth = 35.7kHz; FOV = 64×32×32mm3; nominal spatial resolution = 2×2×2mm3; matrix size = 32×16×16; number of echoes = 256; number of ramp up preparation pulses = 7; number of ramp down flip back pulses = 7. T2 weighted coronal multislice 1H images were also acquired for anatomical reference and overlay of 13C images. The B0 map was measured from 1H signal using a gradient echo sequence, repeated at two echo times (ΔTE = 1ms), and then converted to the off-resonance frequency distribution of 13C.
Results
Bloch simulation
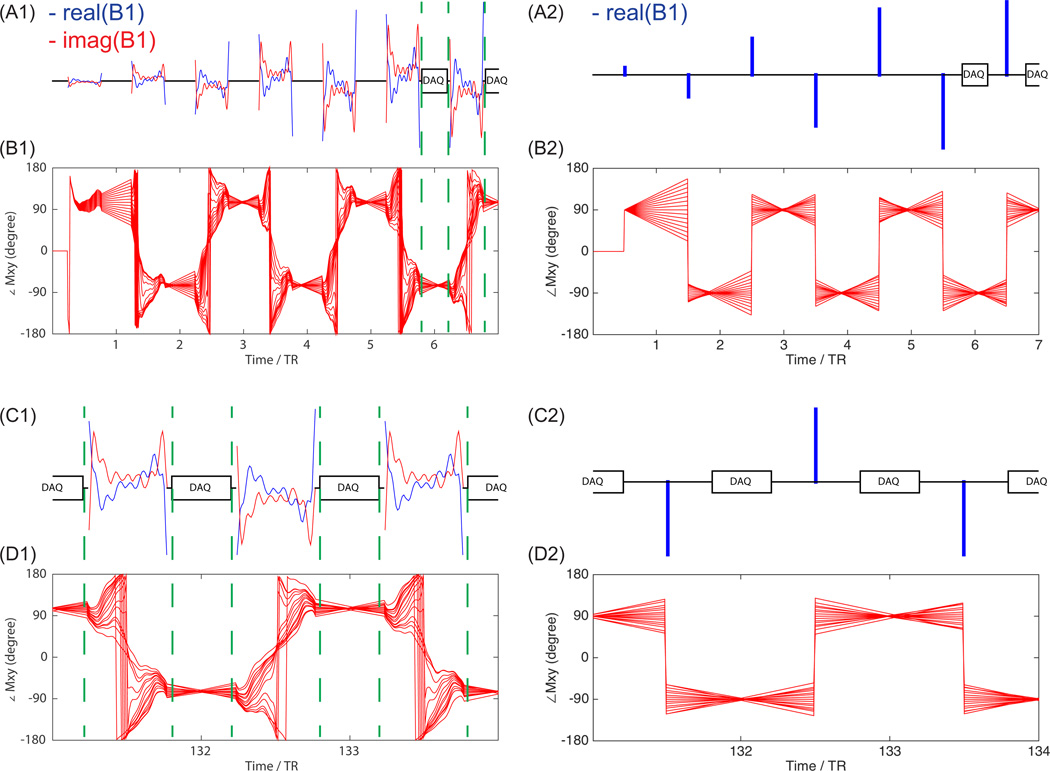
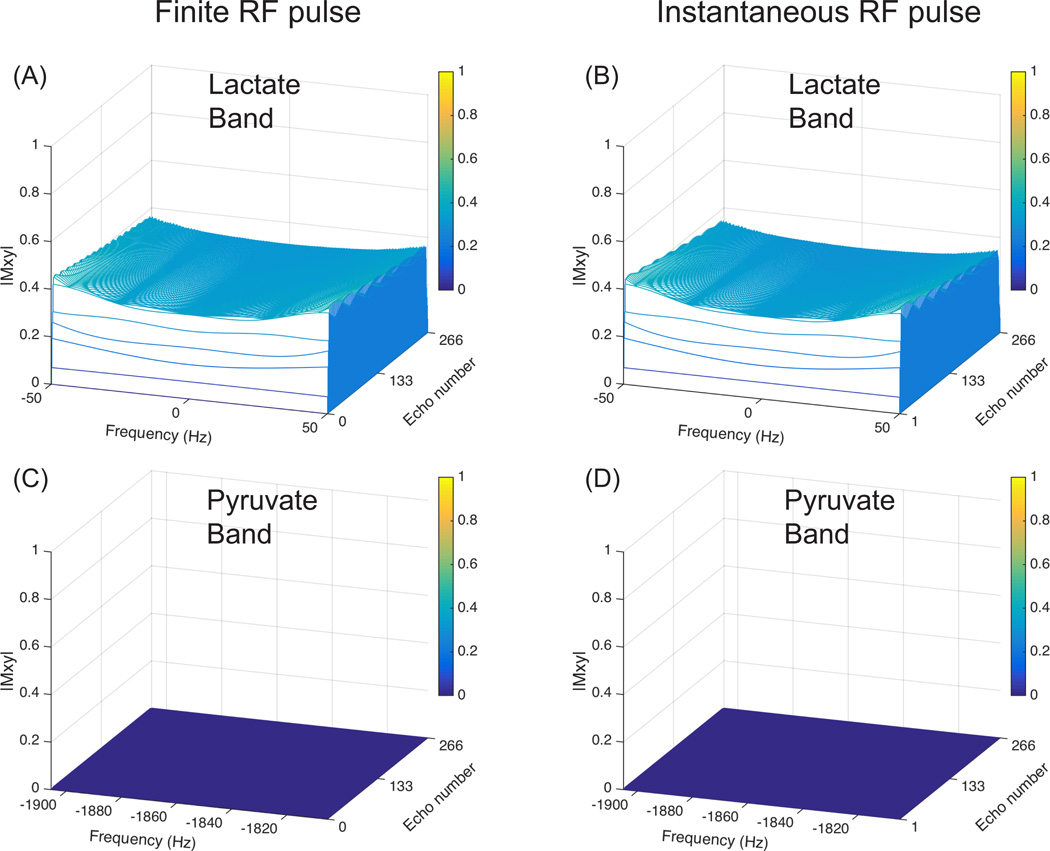
The qualitative study of the finite RF pulse effect on bSSFP transient state signal demonstrated close correspondence to the ideal case of an instantaneous RF pulse, in terms of both echo signal amplitude and refocusing performance, as shown in Fig. 4 and Fig. 5. For both cases, the echo is gradually formed during the ramp up preparation pulse and maintained during the acquisition, as shown in Fig. 4. Therefore, previous bSSFP theory can be directly applied here. This insight also applies to 1H bSSFP, which is also commonly performed at transient state to reduce waiting time required to reach the steady state, and also has RF pulses taking a considerable fraction of TR due to SAR or peak B1 limitations.
Figure 4.
Bloch simulation of bSSFP signal evolution with finite RF pulse (left) and instantaneous RF pulse (right). RF pulse train at beginning including ramp up preparation pulses (A1,A2), and the corresponding Mxy phase evolution for spins within the specified passband ([−50Hz,50Hz]) (B1,B2). Three RF pulses in the middle of acquisition (C1,C2), and the corresponding Mxy phase evolution (D1,D2). Simulation parameters included: number of echoes = 256, number of preparation pulses = 5, number of flip back pulses = 5, TR = 3.785 ms, T1 = 40s, T2 = 1s, RF pulse passband flip angle = 40°, duration = 2.04ms.
Figure 5.
Bloch simulation of bSSFP transient state echo signal within lactate passband (A,B) and pyruvate stopband (C,D). Finite RF pulses (duration = 2.04ms) are used in simulation (A,C), while instantaneous RF pulses are used in (B,D). Simulation parameters are the same as used in Fig. 4.
Phantom Measurements
Pyruvate-only acquisitions with 13C enriched phantom at the resonance frequency of multiple compounds are shown in Fig. 6. With a properly chosen TR of 3.8ms, signal is only detected at the pyruvate frequency. Such selectivity was not achieved with a poor TR choice, such as the top row with TR of 4ms, which suffers from excitation banding artifacts. This failed selectivity at urea/alanine/lactate band agrees with the simulation results in Fig. 2(C) where those bands touch the excitation banding artifact region when TR = 4ms.
Figure 6.
One coronal slice of 3D bSSFP pyruvate acquisition with 13C enriched phantom at the resonance frequency of urea/pyruvate/alanine/pyruvate-hydrate/lactate, with TR of 4ms (top row) and 3.8ms (bottom row). All images in each row are displayed with the same window-level parameters.
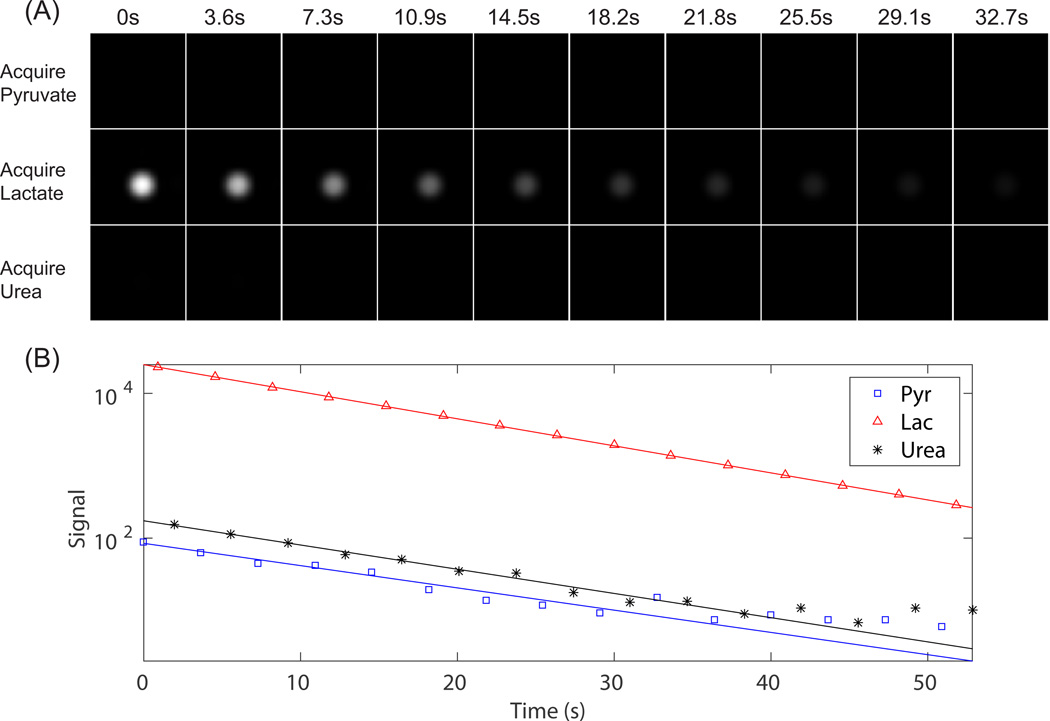
bSSFP images of HP phantoms are shown in Fig. 7, with measured spectral selectivity labeled on each image. High spectral selectivity, approximately 100:1, was achieved for bSSFP pyruvate/lactate/urea acquisition. One example of dynamic images with HP lactate phantom is shown in Fig. 8. The data fit well to exponential decay curves with time constants of 26.9s (Pyruvate), 11.6s (Lactate) and 18.6s (Urea), with R-squared value of 0.99867 (pyruvate), 0.99993 (lactate) and 0.99975 (urea).
Figure 7.
One axial slice of 3D dynamic bSSFP pyruvate/lactate/urea acquisition (at first time point) with HP pyruvate/lactate/urea phantoms individually. Measured spectral selectivity is indicated on each image. All images in each row are displayed with the same window-level parameters.
Figure 8.
For the same data in Fig. 7, pyruvate/lactate/urea dynamic acquisition with HP lactate phantom, displaying one axial slice at all time points with the same window-level (A). Measured signal plotted with a logarithmic scale (B).
In vivo Experiments
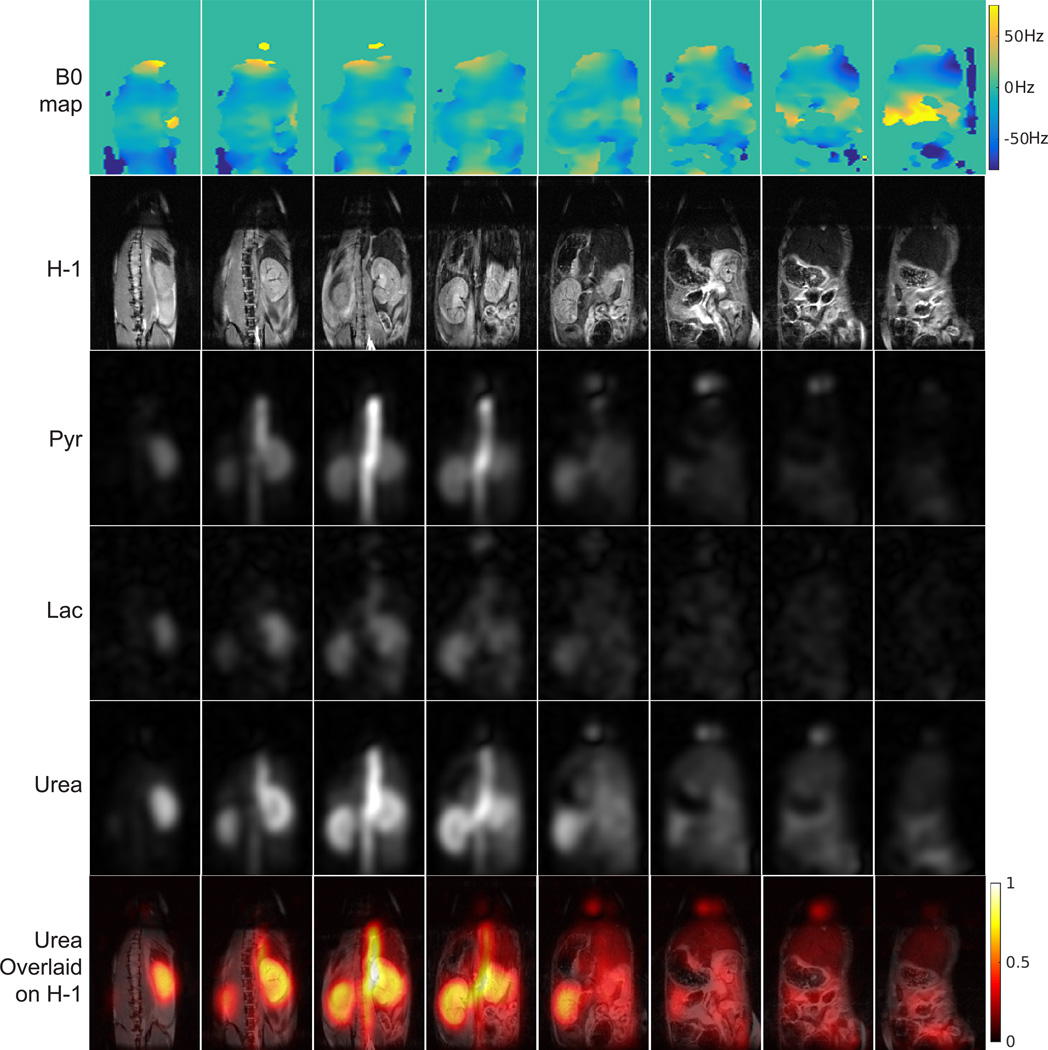
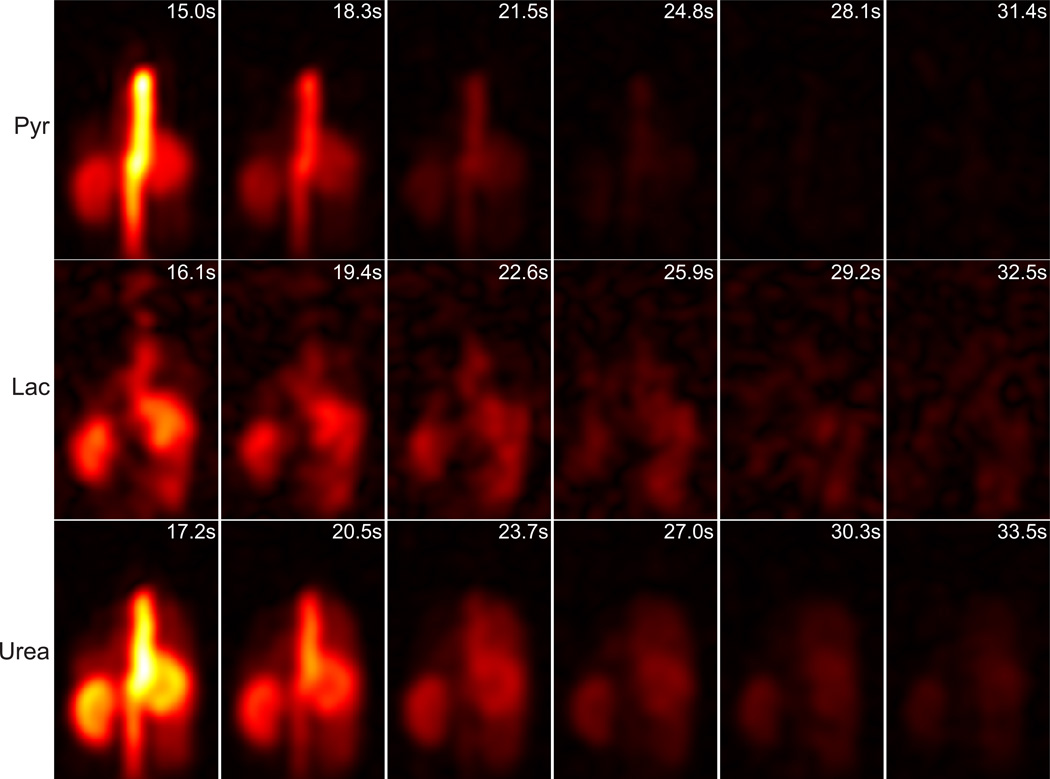
In vivo 3D dynamic bSSFP images of one mouse are shown in Fig. 9 (all coronal slices at the first time point) and Fig. 10 (all time points at one coronal slice). Metabolite dynamic curves measured in kidney and aorta are shown in the additional figure in supporting material. For injected pyruvate and urea, strong signal was observed in the aorta at early time points as expected. Urea and pyruvate also appeared in kidneys, concentrated in the cortex. Lactate, converted from pyruvate, was also observed, primarily in kidneys as expected.
Figure 9.
3D dynamic bSSFP in vivo images of HP pyruvate/lactate/urea in a normal mouse with injected co-polarized [1-13C]pyruvate and [13C]urea. Coronal slices at the first time point are displayed (3rd – 5th row), together with corresponding off-resonance frequency distribution for 13C (1st row), 1H slices for anatomical reference (2nd row), and urea images overlaid on 1H images (6th row). Slices are arranged in posterior to anterior direction from left to right. Lactate images are displayed with 2× scaling factor compared to pyruvate. Saturation bands were applied near the heart and below the kidneys in 1H acquisition to minimize flow related artifacts.
Figure 10.
Same data as in Fig. 9 but displaying all time points at one coronal slice containing kidney and aorta (third slice from left in Fig. 9). Lactate images are displayed with 3× scaling factor compared to pyruvate. The time stamps are relative to starting time of injection and estimated based on average respiratory rate of 55/min, labeled on each image.
Discussion
We have developed and tested a new bSSFP approach for spectrally selective imaging of multiple HP compounds. This sequence inherits the superior SNR efficiency and speed of bSSFP sequence, which is critical for HP 13C studies due to the non-recoverable nature of HP magnetization and the short imaging window determined by T1 decay. High spatial and/or temporal resolution can be achieved using this bSSFP sequence, since these parameters are fundamentally limited by SNR and speed. The challenge of managing the spectral selectivity of bSSFP sequence was successfully addressed in this work by utilizing novel optimized spectrally selective RF pulse with short duration (33) and carefully chosen TR to avoid excitation banding artifact. This enabled 3D dynamic metabolic imaging in vivo with higher spatiotemporal resolution than prior approaches.
Spectrally selective RF pulses are usually not used in bSSFP due to long pulse durations, which limit the minimum achievable TR. However, the advantage it provides may compensate for this limitation, including improved off-resonance insensitivity, SNR efficiency, and the flexibility of choosing a different flip angle for each compound. A wide passband is achieved in this study (±50Hz) within which uniform spectral selectivity was achieved, as shown in Fig. 5 (A, C). This can be improved further with slightly increased RF pulse duration. It enables separate excitation of individual metabolite with minimal effect on other metabolites, similar as (28,29), which simplifies the reconstruction and shortens the duration of each acquisition, compared to simultaneously exciting all compounds and separating them in reconstruction (27, 30, 32). The total scan time of this method may exceed those methods for simultaneous excitation; however, keeping each individual acquisition short reduces sensitivity to motion, flow, metabolic conversion and relaxation decay.
Choice of flip angle
When HP 13C pyruvate is used as a substrate, it is converted to 13C lactate in vivo, providing metabolic information. But lactate signal is usually much lower and more difficult to observe. A relatively small flip angle on pyruvate can provide sufficient SNR while preserving more magnetization for continued conversion to lactate, thus enabling a longer imaging window (5). A relatively larger flip angle can be applied to lactate to provide higher SNR, as lactate signal is continuously replenished by metabolic conversion from pyruvate (11). The specific values of flip angles were not optimized in this study. Optimizing these flip angles depends on specific aspects of the application, such as the duration of imaging window, and also knowledge of tissue parameters, such as T1 and T2. The choice of flip angle also affects the optimized RF pulse design, which may have different pulse duration, and further affects the choice of optimal TR. A constant flip angle was used for all dynamic time points in this study. A progressively increasing flip angle for subsequent dynamic acquisitions would be likely to extend the imaging window by allocating signal more equally over time (17). Careful design of a variable flip angle within each acquisition is also planned for future work to reduce image blurring and improve SNR (48).
Spatial and temporal resolution
There are fundamental trade-offs between spectral, spatial and temporal resolution. The spectrally selective bSSFP sequence has the limit of spectral undersampling, as only one compound is imaged at a time. A high temporal resolution is important to capture the metabolite dynamics which provide additional metabolic information besides the spatial distribution of multiple metabolites, such as perfusion and uptake rate of the injected substrates, and the time to maximum signal for metabolic products (6). Our initial implementation with a conventional sinc pulse (~5ms) requires ~2s per acquisition, within which the HP signal decay, metabolic conversion and respiratory motion will cause image blurring. By using the optimized RF pulse with shorter duration, the acquisition of each compound takes < 1s, which can be fit into one respiratory cycle, thus enabling respiratory triggering and reducing blurring. The temporal resolution of this sequence can be further modified by trading off spatial resolution. However, too fine a temporal resolution is not a good option because it expends the magnetization too rapidly. Although this bSSFP sequence can preserve and recycle transverse magnetization, HP magnetization still decays faster during each bSSFP pulse train because of mixed T1 and T2 decay compared to pure T1 decay when no RF pulse is applied (46). Note that actual spatial resolution could be slightly coarser than the nominal spatial resolution due to k-space filtering effects (48).
Future work
This method could be extended to other field strengths, like HP 13C studies at 3T for potential clinical application. At lower field, the frequency separation between multiple compounds reduces, which will increase the minimal achievable RF pulse duration, and thus minimal achievable TR. For example, a pyruvate-only RF pulse with flip angle of 15° and a bandwidth of 30 Hz can be designed for 3T to achieve a pulse duration of 4.32ms. This results in a minimal achievable TR is 9.32ms when using a readout bandwidth = 15.6kHz, spatial resolution = 2.5×2.5×2.5mm3 matrix size = 24×24×8 and clinical gradient limits of 50 mT/m (maximum amplitude) and 200 mT/m/ms (maximum slew rate). The minimal TR to avoid excitation banding artifacts is 9.54ms, and for this prescription results in sequence duration of 1.83s. Such TR and sequence duration still allows fast high resolution HP 13C studies. Temporal resolution, spatial resolution or volumetric coverage can be further improved by integration of undersampling methods, such as parallel imaging, compressed sensing and partial Fourier acquisition (6, 49).
Sequential phase encoding is used in the current implementation, and the 3D k-space center is sampled around 0.5s, which is on the order of T2 values of 13C compounds and could result in suboptimal SNR. Center out encoding could be used to further improve SNR. This method can also be applied to water-fat separation in 1H bSSFP. Previous studies have used spatial-spectral RF pulses (50,51) or binomial pulses (52) in bSSFP for water-fat separation. The alternating TR bSSFP approach is essentially equivalent to the use of binomial pulses in bSSFP (53,54). The method of choosing TR developed in this work, to place all resonance peaks (water and fat) at desired position of bSSFP frequency response profile, can be applied to 1H bSSFP to improve stopband suppression or reduce requirements on RF pulse design.
Limitations
Though this method is more B0 robust compared to other HP 13C spectrally selective bSSFP sequences (27–32), it still requires careful B0 calibration and shimming. A large B0 deviation will dislocate both passband and stopband. However this problem occurs in any spectrally selective imaging sequence because either chemical shift or B0 inhomogeneity contributes to the same off-resonance effect. Such B0 sensitivity issues will be more likely to cause banding artifacts with larger animals and humans. However, the gyromagnetic ratio of 13C is about ¼ of 1H and thus the off-resonance frequency distribution is also about ¼ given the same B0 inhomogeneity, which reduces the sensitivity to banding artifact to some extent. Another limitation is that without a spatially selective RF pulse, the current implementation excites the whole 3D volume within the sensitive region of the RF coil, and thus this entire volume must be spatially encoded in order to avoid wrap-around artifacts.
Conclusion
A spectrally selective 3D dynamic bSSFP sequence was developed for HP 13C metabolite imaging with subsecond acquisition time and 2mm isotropic resolution. High spectral selectivity (~100:1) of the bSSFP sequence was achieved by using short-duration optimized spectrally selective RF pulses and carefully choosing TR to avoid excitation banding artifacts. This sequence is expected to be useful for preclinical HP 13C studies at high field, and holds potential for clinical studies.
Supplementary Material
Supporting Figure S1 (Supporting material). Same data as in Fig. 10 but displaying dynamic curves. Pyruvate image at first time point overlaid on 1H image with labeled ROI at kidney (green) and aorta (white) (A). Measured metabolites dynamic curves at kidney (B) and aorta (C).
Acknowledgments
The authors gratefully acknowledge Dr. Brian Hargreaves for providing open-source MATLAB code for Bloch simulation. This work was supported by NIH grants P41EB013598, R01EB013427, R01CA183071, R01EB017449, and NIH K01DK099451 (CVM).
References
- 1.Ardenkjær-Larsen JH, Fridlund B, Gram A, Hansson G, Hansson L, Lerche MH, Servin R, Thaning M, Golman K. Increase in signal-to-noise ratio of >10,000 times in liquid-state NMR. Proc Natl Acad Sci USA. 2003;100:10158–10163. doi: 10.1073/pnas.1733835100. [DOI] [PMC free article] [PubMed] [Google Scholar]
- 2.Golman K, Thaning M. Real-time metabolic imaging. Proc Natl Acad Sci USA. 2006;103:11270–11275. doi: 10.1073/pnas.0601319103. [DOI] [PMC free article] [PubMed] [Google Scholar]
- 3.Nelson SJ, Kurhanewicz J, Vigneron DB, Larson PEZ, Harzstark AL, Ferrone M, van Criekinge M, Chang JW, Bok R, Park I, Reed G, Carvajal L, Small EJ, Munster P, Weinberg VK, Ardenkjaer-Larsen JH, Chen AP, Hurd RE, Odegardstuen L-I, Robb FJ, Tropp J, Murray JA. Metabolic imaging of patients with prostate cancer using hyperpolarized [1-13C] pyruvate. Sci Transl Med. 2013;5:198ra108–198ra108. doi: 10.1126/scitranslmed.3006070. [DOI] [PMC free article] [PubMed] [Google Scholar]
- 4.Kurhanewicz J, Vigneron DB, Brindle K, Chekmenev EY, Comment A, Cunningham CH, DeBerardinis RJ, Green GG, Leach MO, Rajan SS. Analysis of cancer metabolism by imaging hyperpolarized nuclei: prospects for translation to clinical research. Neoplasia. 2011;13:81–97. doi: 10.1593/neo.101102. [DOI] [PMC free article] [PubMed] [Google Scholar]
- 5.Larson PEZ, Kerr AB, Chen AP, Lustig MS, Zierhut ML, Hu S, Cunningham CH, Pauly JM, Kurhanewicz J, Vigneron DB. Multiband excitation pulses for hyperpolarized 13C dynamic chemical-shift imaging. J Magn Reson. 2008;194:121–127. doi: 10.1016/j.jmr.2008.06.010. [DOI] [PMC free article] [PubMed] [Google Scholar]
- 6.Larson PEZ, Hu S, Lustig M, Kerr AB, Nelson SJ, Kurhanewicz J, Pauly JM, Vigneron DB. Fast dynamic 3D MR spectroscopic imaging with compressed sensing and multiband excitation pulses for hyperpolarized 13C studies. Magn Reson Med. 2011;65:610–619. doi: 10.1002/mrm.22650. [DOI] [PMC free article] [PubMed] [Google Scholar]
- 7.Cunningham CH, Chen AP, Albers MJ, Kurhanewicz J, Hurd RE, Yen YF, Pauly JM, Nelson SJ, Vigneron DB. Double spin-echo sequence for rapid spectroscopic imaging of hyperpolarized 13C. J Magn Reson. 2007;187:357–362. doi: 10.1016/j.jmr.2007.05.014. [DOI] [PubMed] [Google Scholar]
- 8.Mayer D, Yen YF, Tropp J, Pfefferbaum A, Hurd RE, Spielman DM. Application of subsecond spiral chemical shift imaging to real-time multislice metabolic imaging of the rat in vivo after injection of hyperpolarized 13C1-pyruvate. Magn Reson Med. 2009;62:557–564. doi: 10.1002/mrm.22041. [DOI] [PMC free article] [PubMed] [Google Scholar]
- 9.Reeder SB, Brittain JH, Grist TM, Yen YF. Least-squares chemical shift separation for 13C metabolic imaging. J Magn Reson Imaging. 2007;26:1145–1152. doi: 10.1002/jmri.21089. [DOI] [PubMed] [Google Scholar]
- 10.Lau AZ, Chen AP, Ghugre NR, Ramanan V, Lam WW, Connelly KA, Wright GA, Cunningham CH. Rapid multislice imaging of hyperpolarized 13C pyruvate and bicarbonate in the heart. Magn Reson Med. 2010;64:1323–1331. doi: 10.1002/mrm.22525. [DOI] [PubMed] [Google Scholar]
- 11.Schulte RF, Sperl JI, Weidl E, Menzel MI, Janich MA, Khegai O, Durst Markus, et al. Saturation-recovery metabolic-exchange rate imaging with hyperpolarized [1-13C] pyruvate using spectral-spatial excitation. Magn Reson Med. 2013;69:1209–1216. doi: 10.1002/mrm.24353. [DOI] [PubMed] [Google Scholar]
- 12.Cunningham CH, Chen AP, Lustig M, Hargreaves BA, Lupo J, Xu D, Kurhanewicz J, et al. Pulse sequence for dynamic volumetric imaging of hyperpolarized metabolic products. J Magn Reson. 2008;193:139–146. doi: 10.1016/j.jmr.2008.03.012. [DOI] [PMC free article] [PubMed] [Google Scholar]
- 13.Miller JJ, Lau AZ, Teh I, Schneider JE, Kinchesh P, Smart S, Ball V, Sibson NR, Tyler DJ. Robust and high resolution hyperpolarized metabolic imaging of the rat heart at 7 t with 3d spectral-spatial EPI. Magn Reson Med. 2016;75:1515–1524. doi: 10.1002/mrm.25730. [DOI] [PMC free article] [PubMed] [Google Scholar]
- 14.Scheffler K, Lehnhardt S. Principles and applications of balanced SSFP techniques. Eur Radiol. 2003;13:2409–2418. doi: 10.1007/s00330-003-1957-x. [DOI] [PubMed] [Google Scholar]
- 15.Bieri O, Scheffler K. Fundamentals of balanced steady state free precession MRI. J Magn Reson Imaging. 2013;38:2–11. doi: 10.1002/jmri.24163. [DOI] [PubMed] [Google Scholar]
- 16.Svensson J, Månsson S, Johansson E, Petersson JS, Olsson LE. Hyperpolarized 13C MR angiography using trueFISP. Magn Reson Med. 2003;50:256–262. doi: 10.1002/mrm.10530. [DOI] [PubMed] [Google Scholar]
- 17.von Morze C, Larson PEZ, Hu S, Keshari K, Wilson DM, Ardenkjaer-Larsen JH, Goga A, Bok R, Kurhanewicz J, Vigneron DB. Imaging of blood flow using hyperpolarized [13C] urea in preclinical cancer models. J Magn Reson Imaging. 2011;33:692–697. doi: 10.1002/jmri.22484. [DOI] [PMC free article] [PubMed] [Google Scholar]
- 18.Reed GD, von Morze C, Bok R, Koelsch BL, Van Criekinge M, Smith KJ, Shang H, Larson PEZ, Kurhanewicz J, Vigneron DB. High Resolution C-13 MRI With Hyperpolarized Urea: In Vivo T2 Mapping and N15 Labeling Effects. IEEE T Med Imaging. 2014;33:362–371. doi: 10.1109/TMI.2013.2285120. [DOI] [PMC free article] [PubMed] [Google Scholar]
- 19.Reed GD, von Morze C, Verkman AS, Koelsch BL, Chaumeil MM, Lustig M, Ronen SM, et al. Imaging Renal Urea Handling in Rats at Millimeter Resolution using Hyperpolarized Magnetic Resonance Relaxometry. arXiv preprint arXiv. 2015 doi: 10.18383/j.tom.2016.00127. 1511.00200. [DOI] [PMC free article] [PubMed] [Google Scholar]
- 20.Scheffler K, Hennig J. Is TrueFISP a gradient echo or a spin echo sequence. Magn Reson Med. 2003;49:395–397. doi: 10.1002/mrm.10351. [DOI] [PubMed] [Google Scholar]
- 21.Scheffler K, Heid O, Hennig J. Magnetization preparation during the steady state: Fat-saturated 3D TrueFISP. Magn Reson Med. 2001;45:1075–1080. doi: 10.1002/mrm.1142. [DOI] [PubMed] [Google Scholar]
- 22.Hargreaves BA, Vasanawala SS, Nayak KS, Hu BS, Nishimura DG. Fat-suppressed steady-state free precession imaging using phase detection. Magn Reson Med. 2003;50:210–213. doi: 10.1002/mrm.10488. [DOI] [PubMed] [Google Scholar]
- 23.Vasanawala SS, Pauly JM, Nishimura DG. Fluctuating equilibrium MRI. Magn Reson Med. 1999;42:876–883. doi: 10.1002/(sici)1522-2594(199911)42:5<876::aid-mrm6>3.0.co;2-z. [DOI] [PubMed] [Google Scholar]
- 24.Vasanawala SS, Pauly JM, Nishimura DG. Linear combination steady-state free precession MRI. Magn Reson Med. 2000;43:82–90. doi: 10.1002/(sici)1522-2594(200001)43:1<82::aid-mrm10>3.0.co;2-9. [DOI] [PubMed] [Google Scholar]
- 25.Overall WR, Nishimura DG, Hu BS. Steady-state sequence synthesis and its application to efficient fat-suppressed imaging. Magn Reson Med. 2003;50:550–559. doi: 10.1002/mrm.10542. [DOI] [PubMed] [Google Scholar]
- 26.Absil J, Denolin V, Metens T. Fat attenuation using a dual steady-state balanced-SSFP sequence with periodically variable flip angles. Magn Reson Med. 2006;55:343–351. doi: 10.1002/mrm.20766. [DOI] [PubMed] [Google Scholar]
- 27.Leupold J, Månsson S, Petersson JS, Hennig J, Wieben O. Fast multiecho balanced SSFP metabolite mapping of 1H and hyperpolarized 13C compounds. MAGMA. 2009;22:251–256. doi: 10.1007/s10334-009-0169-z. [DOI] [PubMed] [Google Scholar]
- 28.Månsson S, Petersson JS, Scheffler K. Fast metabolite mapping in the pig heart after injection of hyperpolarized 13C-pyruvate with low-flip angle balanced steady-state free precession imaging. Magn Reson Med. 2012;68:1894–1899. doi: 10.1002/mrm.24183. [DOI] [PubMed] [Google Scholar]
- 29.von Morze C, Sukumar S, Reed GD, Larson PEZ, Bok RA, Kurhanewicz J, Vigneron DB. Frequency-specific SSFP for hyperpolarized 13C metabolic imaging at 14.1 T. Magn Reson Imaging. 2013;31:163–170. doi: 10.1016/j.mri.2012.06.037. [DOI] [PMC free article] [PubMed] [Google Scholar]
- 30.von Morze C, Bok RA, Reed GD, Ardenkjaer-Larsen JH, Kurhanewicz J, Vigneron DB. Simultaneous multiagent hyperpolarized 13C perfusion imaging. Magn Reson Med. 2014;72:1599–1609. doi: 10.1002/mrm.25071. [DOI] [PMC free article] [PubMed] [Google Scholar]
- 31.von Morze C, Reed GD, Shin P, Larson PEZ, Hu S, Bok R, Vigneron DB. Multi-band frequency encoding method for metabolic imaging with hyperpolarized [1-13C] pyruvate. J Magn Reson. 2011;211:109–113. doi: 10.1016/j.jmr.2011.04.007. [DOI] [PMC free article] [PubMed] [Google Scholar]
- 32.Varma G, Wang X, Vinogradov E, Bhatt RS, Sukhatme VP, Seth P, Lenkinski RE, Alsop DC, Grant AK. Selective spectroscopic imaging of hyperpolarized pyruvate and its metabolites using a single-echo variable phase advance method in balanced SSFP. Magn Reson Med. 2015 doi: 10.1002/mrm.26004. [DOI] [PMC free article] [PubMed] [Google Scholar]
- 33.Shang H, Larson PEZ, Kerr A, Reed G, Sukumar S, Elkhaled A, Gordon JW, Ohliger MA, Pauly JM, Lustig M, Vigneron DB. Multiband RF Pulses with Improved Performance via Convex Optimization. J Magn Reson. 2016;262:81–90. doi: 10.1016/j.jmr.2015.11.010. [DOI] [PMC free article] [PubMed] [Google Scholar]
- 34.Wilson DM, Keshari KR, Larson PEZ, Chen AP, Hu S, Van Criekinge M, Bok R, et al. Multi-compound polarization by DNP allows simultaneous assessment of multiple enzymatic activities in vivo. J Magn Reson. 2010;205:141–147. doi: 10.1016/j.jmr.2010.04.012. [DOI] [PMC free article] [PubMed] [Google Scholar]
- 35.Aronen HJ, Pardo FS, Kennedy DN, Belliveau JW, Packard SD, Hsu DW, Hochberg FH, Fischman AJ, Rosen BR. High microvascular blood volume is associated with high glucose uptake and tumor angiogenesis in human gliomas. Clin Cancer Res. 2000;6:2189–2200. [PubMed] [Google Scholar]
- 36.Komar G, Kauhanen S, Liukko K, Seppänen M, Kajander S, Ovaska J, Nuutila P, Minn H. Decreased blood flow with increased metabolic activity: a novel sign of pancreatic tumor aggressiveness. Clin Cancer Res. 2009;15:5511–5517. doi: 10.1158/1078-0432.CCR-09-0414. [DOI] [PubMed] [Google Scholar]
- 37.Mankoff DA, Dunnwald LK, Gralow JR, Ellis GK, Charlop A, Lawton TJ, Schubert EK, Tseng J, Livingston RB. Blood flow and metabolism in locally advanced breast cancer: relationship to response to therapy. J Nucl Med. 2002;43:500–509. [PubMed] [Google Scholar]
- 38.Deshpande VS, Chung YC, Zhang Q, Shea SM, Li D. Reduction of transient signal oscillations in true-FISP using a linear flip angle series magnetization preparation. Magn Reson Med. 2003;49:151–157. doi: 10.1002/mrm.10337. [DOI] [PubMed] [Google Scholar]
- 39.Le Roux P. Simplified model and stabilization of SSFP sequences. J Magn Reson. 2003;163:23–37. doi: 10.1016/s1090-7807(03)00115-0. [DOI] [PubMed] [Google Scholar]
- 40.Paul D, Hennig J. Comparison of different flip angle variation functions for improved signal behavior in SSFP sequences. Proceedings of the 12th Annual Meeting of ISMRM. 2004:2663. [Google Scholar]
- 41.Pauly J, Le Roux P, Nishimura D, Macovski A. Parameter relations for the Shinnar-Le Roux selective excitation pulse design algorithm [NMR imaging] IEEE T Med Imaging. 1991;10:53–65. doi: 10.1109/42.75611. [DOI] [PubMed] [Google Scholar]
- 42.Bieri O, Scheffler K. SSFP signal with finite RF pulses. Magn Reson Med. 2009;62:1232–1241. doi: 10.1002/mrm.22116. [DOI] [PubMed] [Google Scholar]
- 43.Jaynes ET. Matrix treatment of nuclear induction. Physical Review. 1955;98:1099. [Google Scholar]
- 44.Freeman R, Hill HDW. Phase and intensity anomalies in Fourier transform NMR. J Magn Reson. 1971;4:366–383. [Google Scholar]
- 45.Hargreaves BA, Vasanawala SS, Pauly JM, Nishimura DG. Characterization and reduction of the transient response in steady state MR imaging. Magn Reson Med. 2001;46:149–158. doi: 10.1002/mrm.1170. [DOI] [PubMed] [Google Scholar]
- 46.Scheffler K. On the transient phase of balanced SSFP sequences. Magn Reson Med. 2003;49:781–783. doi: 10.1002/mrm.10421. [DOI] [PubMed] [Google Scholar]
- 47.Albers MJ, Bok R, Chen AP, Cunningham CH, Zierhut ML, Zhang VY, Kohler SJ, Tropp J, Hurd RE, Yen YF, Nelson SJ, Vigneron DB, Kurhanewicz J. Hyperpolarized 13C Lactate, Pyruvate, and Alanine: Noninvasive Biomarkers for Prostate Cancer Detection and Grading. Cancer Res. 2008;68:8607–8615. doi: 10.1158/0008-5472.CAN-08-0749. [DOI] [PMC free article] [PubMed] [Google Scholar]
- 48.Shang H, Larson PEZ, Reed GD, Milshteyn E, von Morze C, Ong F, Gordon JW, Tamir JI, Vigneron DB. Variable Flip Angle Design for Balanced SSFP Transient State Imaging to Improve Hyperpolarized 13C MRI; Proceedings of the 23th Annual Meeting of ISMRM; 2015. p. 6677. [Google Scholar]
- 49.Milshteyn E, von Morze C, Reed GD, Shang H, Shin PJ, Zhu Z, Kurhanewicz J, Bok R, Vigneron DB. Development of High Resolution 3D Hyperpolarized 13C Imaging Techniques; In Proceedings of the 23th Annual Meeting of ISMRM; 2015. p. 4599. [Google Scholar]
- 50.Yuan J, Madore B, Panych LP. Fat–water selective excitation in balanced steady-state free precession using short spatial–spectral RF pulses. J Magn Reson. 2011;208:219–224. doi: 10.1016/j.jmr.2010.11.005. [DOI] [PMC free article] [PubMed] [Google Scholar]
- 51.Jou T, Patterson S, Pauly JM, Bowen CV. Fat-suppressed alternating-SSFP for whole-brain fMRI using breath-hold and visual stimulus paradigms. Magn Reson Med. 2016;75:1978–1988. doi: 10.1002/mrm.25797. [DOI] [PMC free article] [PubMed] [Google Scholar]
- 52.Ribot EJ, Wecker D, Trotier AJ, Dallaudière B, Lefrançois W, Thiaudière E, Franconi JM, Miraux S. Water Selective Imaging and bSSFP Banding Artifact Correction in Humans and Small Animals at 3T and 7T, Respectively. PloS one. 2015;10:e0139249. doi: 10.1371/journal.pone.0139249. [DOI] [PMC free article] [PubMed] [Google Scholar]
- 53.Leupold J, Hennig J, Scheffler K. Alternating repetition time balanced steady state free precession. Magn Reson Med. 2006;55:557–565. doi: 10.1002/mrm.20790. [DOI] [PubMed] [Google Scholar]
- 54.Çukur T. Spectrally selective imaging with wideband balanced steady-state free precession MRI. Magn Reson Med. 2016;75:1132–1141. doi: 10.1002/mrm.25700. [DOI] [PubMed] [Google Scholar]
Associated Data
This section collects any data citations, data availability statements, or supplementary materials included in this article.
Supplementary Materials
Supporting Figure S1 (Supporting material). Same data as in Fig. 10 but displaying dynamic curves. Pyruvate image at first time point overlaid on 1H image with labeled ROI at kidney (green) and aorta (white) (A). Measured metabolites dynamic curves at kidney (B) and aorta (C).


