

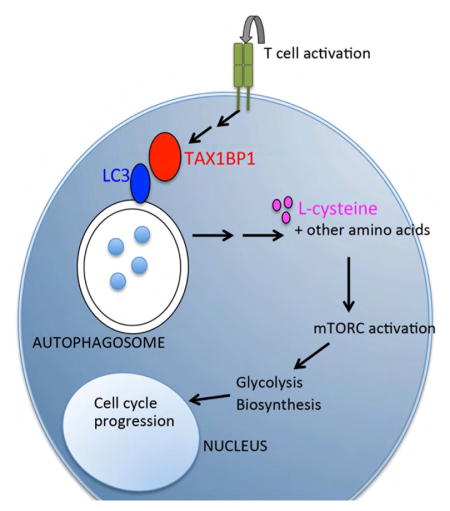
SUMMARY
During immune responses, naïve T cells transition from small quiescent cells to rapidly cycling cells. We have found that T cells lacking TAX1BP1 exhibit delays in growth of cell size and cell cycling. TAX1BP1-deficient T cells exited G0 but stalled in S phase, due to both bioenergetic and biosynthetic defects. These defects were due to deficiencies in mTOR complex formation and activation. These mTOR defects in turn resulted from defective autophagy induction. TAX1BP1 binding of LC3 and GABARAP via its LC3-interacting region (LIR), but not its ubiquitin-binding domain, supported T cell proliferation. Supplementation of TAX1BP1-deficient T cells with metabolically active L-cysteine rescued mTOR activation and proliferation but not autophagy. These studies reveal that TAX1BP1 drives a specialized form of autophagy, providing critical amino acids that activate mTOR and enable the metabolic transition of activated T cells.
eTOC blurb
Naïve T cells undergo major bioenergetic and biosynthetic metabolic transitions as they initiate proliferation in response to T cell activation. Whang et al now show that the ubiqutin binding protein TAX1BP1 is critical for autophagic flux and L-cysteine dependent activation of mTORC in newly activated T cells.
INTRODUCTION
Productive T cell immune responses require the transition of resting T cells to rapidly cycling cells. While the initial activation of T cells triggers a number of signaling cascades, the proliferation and differentiation of these cells requires a series of metabolic transitions (Fox et al., 2005; MacIver et al., 2013; Pearce et al., 2013). These transitions include bio-energetic events that generate ATP as well as biosynthetic events that accumulate building blocks required for protein, lipid and nucleic acid synthesis. While certain key steps, e.g., mTOR activation, have been described to support these transitions, the molecular processes by which activated T cells become proliferative cells are incompletely understood (Pollizzi and Powell, 2014).
TAX1BP1 is a ubiquitin binding protein that binds the human T cell leukemia virus (HTLV)-1 Tax protein, the tumor necrosis factor receptor associate factor-6 (TRAF6), and the ubiquitin editing enzyme A20 (De Valck et al., 1999; Gachon et al., 1998; Jin et al., 1997; Ling and Goeddel, 2000). TAX1BP1 inhibits TNF induced NF-κB signals and appears to perform this function by collaborating with A20 to regulate ubiquitin dependent signaling events (Iha et al., 2008; Shembade et al., 2007). Recently described Tax1bp1 mutant mice exhibit embryonic lethality or cardiac valvulitis, depending on the targeting strategy (Iha et al., 2008; Nakano et al., 2013; Shembade et al., 2007). As Tax is implicated in the transformation of human T cell lymphomas by HTLV, TAX1BP1’s identification as a Tax binding partner suggests that TAX1BP1 may have additional unique functions in T cells. However, TAX1BP1 functions in T cells have not been examined in detail. Here we show that TAX1BP1 drives autophagy early during T cell activation, providing L-cysteine and other amino acids that activate mTOR complexes and mTOR dependent biosynthetic and bioenergetic transitions.
RESULTS
TAX1BP1 Enables the Metabolic Transition Necessary for T Cell Proliferation
To understand TAX1BP1’s physiological functions, we generated TAX1BP1 deficient mice by eliminating parts of exons 6 and 7 of the Tax1bp1 gene (Figures S1A, S1B). Immunoblot analyses of T cells from these Tax1bp1−/− mice revealed the absence of TAX1BP1 protein (Figure S1C). Mating Tax1bp1−/− male mice with Tax1bp1+/− female mice yielded expected ratios of Tax1bp1+/− and Tax1bp1−/− progeny, indicating TAX1BP1 is not required for embryonic development.
Tax1bp1−/− mice developed splenomegaly and lymphadenopathy by 10 weeks of age, with modestly elevated numbers of myeloid and B cells (Figure 1A, and data not shown). The numbers of naïve and memory phenotype T cell numbers were relatively preserved (Figures 1B, 1C). To test whether TAX1BP1 regulates T cell responses, we first examined T cell receptor (TCR) induced signaling by immunoblot analysis after stimulation with agonistic anti-CD3 antibody. Tax1bp1−/− CD4+ T cells exhibited slightly enhanced initial NF-κB and JNK-dependent signaling, but not AKT signaling, suggesting that TAX1BP1 modestly restricts TCR signaling (Figure 1D). Tax1bp1−/− CD4+ T cells exhibited normal Ca2+ flux immediately after TCR activation (Figure 1E). These cells also produced normal amounts of TNF and IL-2 by intracellular cytokine staining (Figure 1F). Lastly, expression of the cell surface activation markers CD69 and CD25 were induced normally in Tax1bp1−/− T cells 24 hours after stimulation (Figure 1G). Hence, initial TCR induced activation events are preserved in Tax1bp1−/− T cells.
Figure 1. Immunophenotype of Tax1bp1−/− Mice and Proximal T Cell Functions.

(A) Quantification of total splenocytes (left panel), splenic T cells (TCRb+) and B cells (CD19+) (middle panel), and myeloid cells (Mac-1+), and NK cells (NK1.1+ CD3−) from untreated WT and Tax1bp1−/− mice. Error bars reflect mean values ± SD.
(B) Representative flow cytometry (upper panel) and quantification (lower panel) of splenic CD4+ and CD8+ T cells from WT and Tax1bp1−/− mice.
(C) Flow cytometric analysis of CD62L and CD44 expression on CD4+ (upper panels) and CD8+ T cells (lower panels) from indicated mice.
(D) Immunoblot analyses of signaling molecules from CD4+ T cells from indicated mice at indicated times after anti-CD3 stimulation.
(E) Fluorometric analysis of acute calcium signaling in CD4+ T cells from indicated mice. Data are representative of two experiments.
(F) Intracellular quantification of TNF-α (left graph) and IL-2 (right graph) production 7 h and 19 h, respectively, after anti-CD3 and anti-CD28 stimulation. Mean values ± SD.
(G) Cell surface expression of activation markers, CD69 and CD25, 24 h after anti-CD3 and anti-CD28 stimulation. Unless otherwise noted, all data presented here and hereafter are representative of at least three independent experiments. Please see also Figure S1.
To study antigen specific T cell autonomous roles of TAX1BP1 in vivo, we bred Tax1bp1−/− mice with TCR transgenic OT-I mice and adoptively co-transferred naïve WT OT-I (CD45.1+ CD45.2+) CD8+ T cells and Tax1bp1−/− OT-I (CD45.2+) CD8 T+ cells into C57BL/6 (CD45.1+) recipient mice. We immunized these recipient mice with OVA plus lipopolysaccharide (LPS) 24 h after transfer (day 0) and quantified splenic OT-I T cells from each donor genotype at various time points after immunization. As early as two days after immunization, WT OT-I T cells began to outcompete Tax1bp1−/− OT-I T cells (Figure 2A). By the peak of expansion on day 4, Tax1bp1−/− OT-I T cells comprised only 38% of total transferred OT-I cells. By day 23 after immunization, WT OT-I T cells and Tax1bp1−/− OT-I T cells represented 92.5% and 7.5% of total transferred OT-I cells, respectively (Figure 2A). As these analyses were performed on congenically marked WT and Tax1bp1−/− OT-I T cells within the same recipient mice, TAX1BP1 supports T cell expansion in a cell-autonomous fashion. Hence, Tax1bp1−/− T cells exhibit defects in proliferation, survival, or both, compared to control T cells.
Figure 2. T Cell Proliferation Defects in the Absence of TAX1BP1.

(A) Quantitation of congenically marked antigen specific WT OT-I and Tax1bp1−/− OT-I T cells after in vivo immunization. Congenically marked WT OT-I and Tax1bp1−/− OT-I T cells were adoptively co-transferred into the same congenically distinct hosts, after which mice were immunized with LPS plus ovalbumin. Mice were sacrificed at the indicated days after immunization and the percentage of total splenic CD8+ T cells that were WT OT-I and Tax1bp1−/− OT-I T cells were plotted (left graph). The relative percentage of total OT-I T cells that were either WT OT-I or Tax1bp1−/− OT-I T cells is also plotted (right graph). Data are representative of two experiments.
(B) Live cell counts of WT and Tax1bp1−/− CD4+ T cells stimulated in vitro with anti-CD3 and anti-CD28 for 2 d. Equal numbers of cells were stimulated for each genotype. Mean values ± SD. **p < 0.01 by two-tailed unpaired t-test.
(C) CFSE dilution histograms of WT and Tax1bp1−/− CD4+ T cells stimulated with anti-CD3 and anti-CD28 antibodies, PMA and ionomycin, or concanavalin A for 2 d.
(D) CFSE dilution histograms of CD4+ T cells isolated from mixed bone marrow chimera mice stimulated as in (B). WT mice were sublethally irradiated and reconstituted with both indicated congenic strains of WT and Tax1bp1−/− CD4+ T cells. T cells from these mixed radiation chimera were then stimulated together in vitro. Flow cytometric gating of three distinct genotypes of CD4+ T cells shown in left panel; CFSE dilution of the gated populations shown in right panel. Data are representative of two experiments.
(E) Immunoblot analyses of the indicated cell cycle proteins from Tax1bp1+/− and Tax1bp1−/− CD4+ T cells. Cells were stimulated as in (B), and harvested at the indicated time points for immunoblot analyses.
(F) Flow cytometric analyses of BrdU incorporation by WT and Tax1bp1−/− CD4+ T cells 24 hours after stimulation as in (B). Representative flow cytometry of BrdU and 7AAD staining shown in upper panels. Quantitation of %BrdU+ cells is shown in lower panels. Mean values ± SD. ****p < 0.0001 by two-way ANOVA with Tukey’s test. Please see also Figure S2.
To better understand why Tax1bp1−/− T cells expand poorly, we quantitated the numbers of congenically marked Tax1bp1−/− and control T cells in mixed cultures after in vitro TCR stimulation. Two days after stimulation, the numbers of Tax1bp1−/− T cells increased less than control T cells in these mixed cultures, confirming that TAX1BP1 supports T cell expansion in a cell autonomous fashion (Figure 2B). To assess whether TAX1BP1 regulates proliferation, we labeled T cells with CFSE in a 1:1 mixed culture and assayed CFSE dilution after TCR stimulation. Fewer Tax1bp1−/− T cells diluted CFSE than control cells, suggesting that TAX1BP1 supports T cell proliferation (Figure 2C). To address potential caveats associated with aberrant development, we generated mixed bone marrow chimeras by reconstituting sub-lethally irradiated C57BL/6 (CD45.1+) mice with bone marrow cells from both WT (CD45.1+ CD45.2+) and Tax1bp1−/− (CD45.2+) mice. After the two genotypes of donor T cells co-developed in the wild type recipient mice, they were harvested and stimulated in mixed cultures in vitro with plate bound anti-CD3 and anti-CD28 antibodies. Again, Tax1bp1−/− CD4+ T cells proliferated poorly compared to WT host and WT donor CD4+ T cells (Figure 2D).
TAX1BP1 protein expression was induced in both wild type CD4+ and CD8+ T cells, consistent with this protein’s function in T cells of both lineages (Figure S2A). Tax1bp1 mRNA expression decreased during T cell activation, suggesting that TAX1BP1 protein expression was at least partially regulated post-translationally (Figure S2B). As the proliferation defect of Tax1bp1−/− T cells occurred despite normal initial TCR induced NF-κB, MAP kinase, and Ca2+ signaling, we tested whether this defect would persist when TCR complexes were bypassed. Tax1bp1−/− T cells failed to proliferate normally after stimulation with PMA and ionomycin, or with conconavalin A, reinforcing the notion that TAX1BP1 supports T cell proliferation at a step downstream of initial TCR signaling (Figure 2C).
Upon TCR and CD28 co-receptor ligation, naïve T cells exit G0 to enter G1 and S cell cycle phases, where they rapidly increase cellular mass before completing mitosis. To better understand why activated Tax1bp1−/− T cells fail to proliferate as readily as control T cells, we hypothesized that these cells might fail to transition from resting cells to proliferating cells. We assessed the expression of cell cycle phase specific cyclins after TCR activation. These studies revealed that cyclins D2 and D3 were induced normally in Tax1bp1−/− T cells during the first 36 hours after T cell activation (Figure 2E). In addition, p27 was degraded normally (Figure 2E). These results indicate that TAX1BP1 is not required for the transition of T cells from Go to G1. By contrast, induction of the S phase specific cyclins, cyclin A and cyclin E, were markedly deficient in stimulated Tax1bp1−/− T cells compared to control T cells (Figure 2E and data not shown). These findings suggest that Tax1bp1−/− T cells transition normally from Go to G1, but fail to efficiently progress through S phase. S phase is characterized by the synthesis of nucleic acids, proteins, and other cellular building blocks necessary for cellular division. To assess the ability of Tax1bp1−/− T cells to synthesize new DNA during S phase, we measured the uptake and DNA content of these cells using bromodeoxyuridine (BrdU) labeling. BrdU incorporation was markedly delayed in Tax1bp1−/− T cells when compared to control T cells, indicating that TAX1BP1 is required for de novo DNA synthesis (Figure 2F). These experiments also indicated that very few dying cells, represented by sub-2N amounts of DNA, were present at these early time points (24 hours after stimulation) in WT and Tax1bp1−/− T cells. Therefore, TAX1BP1 is not required for initial TCR signaling and T cell activation, but is required for DNA synthesis and T cell transition through S phase.
In addition to replicating DNA, cells synthesize proteins, lipids, and a variety of other cellular components during S phase. Hence, the failure of Tax1bp1−/− T cells to transition through S phase could be due to defects in biosynthetic functions. The biosynthesis of cellular components causes the increase of cell size of recently activated T cells. We thus measured the size of activated T cells by flow cytometry. These experiments revealed greater than 68% increase in forward scatter area for WT CD4+ T cells but only a 33% increase for Tax1bp1−/− CD4+ T cells at 18 h after stimulation (Figure 3A). To assess biosynthetic activity in these cells, we measured the relative amounts of specific metabolites by semi-quantitative mass spectrometry 24 hours after TCR stimulation. These experiments revealed that Tax1bp1−/− T cells possessed lower amounts of nucleotides AMP and UMP (Figure 3B). These cells also possessed lower amounts of ribose-5-phosphate, a key component of the ribose phosphate shunt and nucleoside biosynthesis (Figure 3C). Thus, Tax1bp1−/− T cells possess biosynthetic deficits that compromise their progression through S phase.
Figure 3. Metabolic Defects in Tax1bp1−/− T Cells.

(A) Representative flow cytometric analysis of cell size by forward scatter area of WT and Tax1bp1−/− CD4+ T cells stimulated with anti-CD3 and anti-CD28 antibodies.
(B) Quantification of AMP and UMP in WT and Tax1bp1−/− CD4+ T cells by mass spectrometry 24 h after stimulation as in (A). (B, C, E, F) Mean values ± SEM. ns = not significant, *p < 0.05 by unpaired t-test corrected for multiple comparisons using Sidak-Bonferroni method. (B, C, E, and F) Data are representative of two experiments.
(C) Mass spectrometric quantification of ribose 5-phosphate as in (B).
(D) Seahorse assay of extracellular acidification rate of WT and Tax1bp1−/− CD4+ T cells simulated as in (A) for 24 h in the basal state and in response to sequential treatment with glucose, oligomycin and 2-DG. Mean values ± SD.
(E) Mass spectrometric quantification of lactate as in (B).
(F) Mass spectrometric quantification of glycolytic intermediates as in (B).
(G) Immunoblot analysis of Glut1 expression in plasma membrane (above) or intracellular (below) fractions of Tax1bp1+/− and Tax1bp1−/− CD4+ T cells before and 18 h after stimulation as in (A). Data are representative of two experiments.
(H) Immunoblot analyses of hexokinase 2 expression in WT and Tax1bp1−/− CD4+ T cells at indicated time points after stimulation as in (A).
In addition to synthesizing new cellular components, newly activated T cells undergo a burst of glycolytic activity to generate ATP. To determine whether TAX1BP1 is required for this bioenergetic transition, we measured glycolytic activity using Seahorse. These assays revealed that Tax1bp1−/− T cells exhibited consistently lower extracellular acidification rates (ECAR) than control T cells after glucose, reflecting lower production of lactic acid and lower glycolytic activity (Figure 3D). Consistent with this finding, semi-quantitative mass spectrometric measurement of intracellular lactate revealed reduced amounts of this metabolite (Figure 3E). Tax1bp1−/− T cells also exhibited lower glycolytic capacity after treatment with the ATP synthase inhibitor oligomycin (Figure 3D). To further evaluate glycolysis in these cells, we measured key glycolytic intermediates by mass spectrometry. These studies revealed that glucose-6-phosphate, fructose-6-phosphate, fructose-1,6-diphosphate, and pyruvate were reduced in Tax1bp1−/− T cells (Figure 3F). Therefore, TAX1BP1 supports the ability of recently activated T cells to enhance glycolysis.
Increased glycolytic activity is supported by increased cellular glucose uptake via the GLUT1 transporter, a protein that is transcriptionally induced and actively partitioned to the cell surface (MacIver et al., 2008). We thus measured the surface expression of GLUT1. Surface biotinylation and immunoblotting experiments revealed that surface GLUT1 expression was deficient in Tax1bp1−/− T cells (Figure 3G). After internalization, glucose is phosphorylated by hexokinase 2, thereby trapping it within cells. Hexokinase 2 is normally induced in T cells after TCR stimulation. Hexokinase 2 expression was induced poorly in Tax1bp1−/− T cells when compared with control T cells (Figure 3H). Hence, TAX1BP1 supports the ability of T cells to acquire and metabolize glucose.
Biosynthetic and bioenergetic defects in Tax1bp1−/− T cells could be caused by problems with mitochondrial homeostasis. We thus measured mitochondrial volume in resting and activated T cells using MitoTracker dye labeling. These assays revealed normal mitochondrial mass in resting and activated Tax1bp1−/− T cells (Figure 4A). Mitochondrial dysfunction can lead to increased mitochondrial production of reactive oxygen species (ROS). We thus measured mitochondrial ROS production by labeling T cells with MitoSOX. These experiments showed similar amounts of mitochondrial ROS in Tax1bp1−/− and control T cells before and after TCR activation (Figure 4B). Therefore, TAX1BP1 deficiency compromises the metabolic transition of T cells without grossly perturbing mitochondria.
Figure 4. TAX1BP1 Supports mTOR Signaling in T Cells.

(A) Mitochondrial content in resting and activated Tax1bp1+/− and Tax1bp1−/− CD4+ T cells assessed by MitoTracker Green labeling. Cells were stimulated with anti-CD3 and anti-CD28 antibodies. Data are representative of two experiments.
(B) Mitochondrial ROS in resting and activated WT and Tax1bp1−/− T cells assessed by MitoSOX Red labeling in cells stimulated as in (A). Mean values ± SD.
(C) Immunoblot analyses of mTOR signaling proteins in WT and Tax1bp1−/− CD4+ T cells stimulated as in (A).
(D) Real-time quantitative PCR analyses of Eif4bp1 mRNA expression normalized to Hprt mRNA in WT and Tax1bp1−/− CD4+ T cells stimulated as in (A). Mean values ± SD. Data are representative of two experiments.
(E) Immunoblot analyses of AKT phosphorylation (phospho-Thr308 AKT) from stimulated WT and Tax1bp1−/− CD4+ T cells at the indicated time points.
(F) Immunoprecipitation and immunoblot analysis of mTORC1 and mTORC2 complexes in stimulated Tax1bp1+/− and Tax1bp1−/− CD4+ T cells at the indicated time points. Please see also Figure S3.
TAX1BP1 Promotes mTORC1 Complex Formation and mTORC1 Activity
The studies above suggest that TAX1BP1 supports the biosynthesis of cellular building blocks, the import of glucose, and the bioenergetic transition to glycolysis during T cell activation. As the induction of these processes in lymphocytes is largely dependent upon mammalian TOR (mTOR) activation, we hypothesized that TAX1BP1 might support mTOR activation. We first tested the phosphorylation of AKT at serine 473, a phosphorylation target of the mTORC2 complex (Sarbassov et al., 2005). pAKTS473 was induced similarly in Tax1bp1−/− and control T cells (Figure 4C). We next tested the phosphorylation of 4EBP1, a protein that is phosphorylated by mTORC1 (Gingras et al., 1999). 4EBP1 phosphorylation relieves translational inhibition of mRNAs, mediating a major mechanism by which mTOR supports protein translation (Gingras et al., 2001). Phosphorylation of 4EBP1 at both serine 65 and threonine 37 was markedly reduced at 16 and 20 hours in activated Tax1bp1−/− cells compared to control T cells (Figure 4C). This result suggests that TAX1BP1 is important for activating mTORC1. Total 4EBP1 protein was also reduced in Tax1bp1−/− T cells, while 4EBP1 mRNA was comparable, suggesting that TAX1BP1 dependent activation of mTORC1 supports 4EBP1 protein translation (Figures 4C, 4D). Phosphorylation of S6, a substrate of the mTORC1 target S6 kinase, was relatively normal in Tax1bp1−/− T cells (Figure 4C). These findings align with prior data showing that 4EBP1, rather than S6, is the ribosomal target most critical for translational regulation by mTOR (Hsieh et al., 2010; Salmond et al., 2015). Finally, as mTORC1 activation depends on both amino acid sensing and phosphorylation of AKT threonine 308 (Inoki et al., 2002; Manning et al., 2002), we measured pAKTT308 induction in Tax1bp1−/− and control T cells. These experiments revealed relatively normal amounts of pAKTT308 in Tax1bp1−/− T cells (Figure 4E). Hence, TAX1BP1 supports mTORC1 activation and may perform this function independently of AKT activation.
Reduced mTOR activity could be due to compromised formation of mTOR complexes. We thus immunoprecipitated mTOR from stimulated T cells and immunoblotted for the presence of Raptor and Rictor, proteins that define mTORC1 and mTORC2 complexes, respectively. Tax1bp1−/− T cells contained markedly reduced mTOR-Raptor (mTORC1) complexes, while mTOR–Rictor (mTORC2) complexes were relatively preserved (Figure 4F). c-MYC has been reported to support T cell metabolism (Wang et al., 2011). However, c-MYC expression was normal in Tax1bp1−/− T cells (Figure S3), indicating that TAX1BP1 supports T cell metabolism independently of c-MYC. These findings reveal that TAX1BP1 supports the formation of mTORC1 complexes and mTORC1 dependent translation and phosphorylation of 4EBP1.
TAX1BP1 Supports Autophagy Induction in Activated T Cells
mTOR activation requires engagement of amino acid sensors, and autophagolysosomes can supply intracellular amino acids that activate mTOR in model cell lines (Beugnet et al., 2003; Shigemitsu et al., 1999). In addition, TAX1BP1 may overlap with optineurin and NDP52 in supporting autophagy, perhaps functioning as an adapter for selected cargos (Tumbarello et al., 2012). Accordingly, we hypothesized that TAX1BP1 might support autophagy mediated nutrient recycling and priming of mTOR in activated T cells. We tested the ability of activated Tax1bp1−/− T cells to perform autophagy by measuring lipidation of the autophagosomal protein LC3. These experiments revealed that Tax1bp1−/− T cells exhibited marked defects in LC3 lipidation compared to control T cells (Figure 5A). These defects persisted in the presence of the H+ ATPase inhibitor bafilomycin A1, which inhibits vacuolar acidification and prevents late steps of autophagy flux, thereby allowing direct assessment of LC3 lipidation rates (Figures 5A, 5B). Notably, LC3 lipidation defects were observed between 3–8 hours after T cell activation, time points that precede defects in mTORC1 formation (between 13–20 hours). Naïve Tax1bp1−/− T cells exhibited normal LC3 lipidation when cultured with Hank’s balanced salt solution (HBSS), with or without baflomycin (Figure 5C). Moreover, Tax1bp1−/− MEFs exhibited normal starvation induced autophagy (data not shown). Therefore, TAX1BP1 is not required for global autophagy in either naïve T cells or MEFs. Hence, TAX1BP1 is specifically required for early autophagy induction during T cell activation.
Figure 5. L-cysteine Rescues Tax1bp1−/− T Cell Size and Proliferation.

(A) Immunoblot analysis of LC3B lipidation (autophagy flux) in WT and Tax1bp1−/− CD4+ T cells stimulated with anti-CD3 and anti-CD28 for the indicated time periods. Bafilomycin A1 was added in the indicated samples during the final 20 min prior to harvest. Upper arrow indicates LC3B-I and lower arrow indicates LC3B-II.
(B) Quantification of LC3B-II lipidation normalized to Tubulin protein at 3 h after stimulation as in (A). Mean values ± SD. **p < 0.01 and ***p < 0.001 by two-way ANOVA with Tukey’s test.
(C) Immunoblot analysis of LC3B lipidation in WT and Tax1bp1−/− CD4+ T cells. Cells were cultured in HBSS for 1.5 h and Baf A1 was added in the indicated samples during the final 20 min. Data are representative of two experiments.
(D) CFSE dilution of WT or Tax1bp1−/− CD4+ T cells stimulated as in (A) in RPMI medium supplemented with additional amino acids for 2 d. Final concentration of each amino acid indicated above histograms. Data are representative of two experiments.
(E) CFSE dilution of WT and Tax1bp1−/− CD4+ T cells stimulated as in (A) with indicated concentrations of L-cys for 2 days.
(F) Representative forward scatter area analysis of WT or Tax1bp1−/− CD4+ T cells stimulated as in (A) with or without L-cys.
L-cysteine Restores mTORC1 Activity and Proliferation in T Cells Deficient for TAX1BP1 or Generalized Autophagy
To test the idea that autophagy in activated T cells provides essential amino acids to activate mTOR complexes, we examined whether supplementation with selected amino acids could rescue mTOR activation and proliferation of autophagy deficient or Tax1bp1−/− T cells. Titration of multiple amino acids was performed to determine each amino acid’s potential benefit to support proliferation without causing toxicity. Although glutamine and leucine are known to support T cell survival and proliferation, supplemental L-glutamine or L-leucine (in addition to the components present in complete RPMI media) did not restore the proliferation defect of Tax1bp1−/− T cells compared to wild type T cells at any concentration tested (Figure 5D and data not shown). By contrast, L-cysteine (L-cys), an amino acid that exists at extremely low concentrations in mammalian cells (Okayasu et al., 1997), induced a dose-dependent rescue of Tax1bp1−/− T cells (Figures 5D, 5E). Supplementation with 5 mM L-cysteine, but not D-cysteine, rescued proliferation of Tax1bp1−/− CD4+ T cells (Figure 5D). L-methionine, another sulfur-containing amino acid, did not rescue the proliferation of these cells (Figure 5D). Thus, metabolically bioavailable cysteine, rather than associated redox changes, rescues the proliferation defect in Tax1bp1−/− T cells.
To determine how L-cysteine restores the proliferative capacity of Tax1bp1−/− T cells, we studied the cellular and biochemical responses of these cells. While L-cysteine had minimal effects on control T cells, this amino acid restored the cell size expansion of activated Tax1bp1−/− T cells (Figure 5F). Moreover, L-cysteine restored defects in 4EBP1 translation and phosphorylation seen in Tax1bp1−/− T cells, reflecting normalized mTORC1 activity (Figure 6A). L-cysteine also normalized hexokinase 2 induction in these cells, reflecting mTORC1 dependent activation of glycolysis (Figure 6A). Further, L-cysteine selectively restored the induction of cyclin A and hence cell cycle progression in Tax1bp1−/− T cells (Figure 6A). Notably, L-cysteine did not correct the defects in LC3 lipidation in Tax1bp1−/− T cells, indicating that this supplemental amino acid restored mTORC1 activity, metabolic transition, and cell cycling without rescuing TAX1BP1-dependent autophagy (Figure 6B). Therefore, TAX1BP1 mediates autophagy dependent production of key amino acids including L-cysteine, and supplemental L-cysteine bypasses this autophagy defect and triggers mTORC1 activity.
Figure 6. Autohpagy Defects in Tax1bp1−/− T Cells.

(A) Immunoblot analyses of indicated proteins from Tax1bp1+/− and Tax1bp1−/− CD4+ T cells stimulated with anti-CD3 and anti-CD28 with or without L-cys.
(B) Quantification of LC3B-II protein normalized to GAPDH protein from WT and Tax1bp1−/− CD4+ T cells −/+ anti-CD3 and anti-CD28 stimulation and −/+ L-cys for 4 h and −/+ Baf A1 during final 15 min of culture (upper panel). Immunoblot shown in lower panel. Mean values ± SD. ns = not significant by one-way ANOVA with Tukey’s test.
(C) CFSE dilution of WT CD4+ T cells stimulated as in (A) with or without 3-MA or L-cys for 2 d. Data are representative of two experiments. Data are representative of two experiments.
(D) Immunoblot analysis of WT or Tax1bp1−/− CD4+ T cells stimulated as in (A) for 18 h. Data are representative of two experiments.
(E) CFSE dilution of Atg5+/+ Cd4-cre+ or Atg5flox/flox Cd4-cre+ CD4+ T cells stimulated as in (A). Please see also Figure S4.
To further examine the concept that autophagy dependent production of L-cysteine is critical for mTORC1 activation in T cells, we stimulated wild type CD4+ T cells in the presence or absence of the autophagy inhibitor 3-methyladenine (3-MA), a class III PI-3K inhibitor. Predictably, T cells cultured with 0.5 mM 3-MA proliferated poorly compared to untreated cells. Notably, this defect was reversed when L-cysteine was added in addition to 3-MA (Figure 6C). We next sought to determine whether impairment of autophagy by 3-MA in WT T cells led to decreased mTOR signaling by assessing 4EBP1 phosphorylation. Indeed, CD4+ T cells cultured with 3-MA exhibited decreased 4EBP1 phosphorylation, which was restored in T cells cultured with 3-MA and L-cys (Figure 6D). Treatment of WT T cells with another autophagy inhibitor, Vps34IN1, also suppressed early T cell proliferation, and this defect was partly rescued by L-cysteine (Supplemental Figures 4A, 4B). To further test the ability of bioavailable L-cysteine to rescue autophagy deficient T cells, we stimulated Atg5flox/flox Cd4-cre+ T cells in the presence or absence of L-cysteine and measured cell division. ATG5 deficient T cells proliferated poorly compared to wild type cells as expected (Pua et al., 2007), and L-cysteine normalized cell division of these cells (Figure 6E). Hence, autophagy dependent L-cysteine supports mTORC1 activation during early T cell activation.
The LC3 Interacting Motif (LIR) of TAX1BP1 Mediates Its Binding to LC3 and GABARAP Family Proteins and Supports T cell Proliferation
TAX1BP1 binds to the autophagy molecule LC3 and to ubiquitin, and has been postulated to function as an adaptor that bridges ubiquitinated cargos to LC3 proteins (Newman et al., 2012; Tumbarello et al., 2015). We thus investigated which of TAX1BP1’s biochemical functions are required for supporting T cell proliferation. We devised an assay to test which forms of TAX1BP1 may rescue proliferation of activated Tax1bp1−/− T cells. Stimulation of naïve T cells with anti-CD3 and anti-CD28 agonistic antibodies, followed by resting in 20 U/ml IL-2 for 6 days, led to the reduction of T cell size to that of naïve T cells. Subsequent re-activation of Tax1bp1−/− and control T cells with agonist anti-CD3 and anti-CD28 antibodies recapitulated the same defects in cell size expansion and cellular proliferation observed during the initial activation of naïve T cells (data not shown). We utilized this approach to virally transduce TAX1BP1 constructs into Tax1bp1−/− T cells during their initial activation, after which the function of these constructs could be assayed during the second stimulation.
The N-terminus of TAX1BP1 contains one atypical LC3-interacting region (LIR) sequence (LVV) and one putative LIR that is reminiscent of a canonical LIR sequence (WVGI) (Newman et al., 2012; Tumbarello et al., 2015). The center region of TAX1BP1 encodes a series of coiled-coiled (CC1-3) domains, one of which, CC2, has been shown to be important for homodimerization (Ling and Goeddel, 2000). The C-terminus contains two zinc finger motifs that orchestrate binding to ubiquitin (Iha et al., 2008; Tumbarello et al., 2015) (Figure 7A). To determine which of these regions were necessary to support TAX1BP1-dependent proliferation, we generated ΔLIR, ΔZF and ΔCC-ZF deletion mutants of TAX1BP1, introduced these mutants as well as wild type TAX1BP1 into GFP-expressing lentiviral constructs, transduced these constructs into activated Tax1bp1−/− CD4+ T cells, rested the cells for 5 days, labeled the cells with the proliferation dye eFluor670, re-activated the cells, and measured cell proliferation.
Figure 7. LC3 Interacting Region but not Ubiquitin Binding Zinc Fingers of TAX1BP11 is Essential for Normal Proliferation of T Cells.

(A) Schematic diagram of WT and mutant TAX1BP1 constructs.
(B) Representative CFSE dilution histograms of stimulated Tax1bp1−/− CD4+ T cells transduced with the indicated TAX1BP1 mutants, rested, and subsequently re-stimulated with anti-CD3 and anti-CD28 antibodies for 2 days (upper panel). Quantitation of cells ≥2 cell divisions shown (lower panel). Mean values ± SD. **p < 0.01 by one-way ANOVA with Sidak’s test.
(C and D) Immunoblot analysis of TAX1BP1 constructs expressed in 293 T cells (left panel) (C and D) and their interaction with LC3B (right panel) (C) and their interaction with ubiquitin (right panel) (D).
(E) Endogenous TAX1BP1 and p62 interactions with LC3 family proteins. Whole cell lysate from activated wild type CD4+ T cells was harvested, precipitated with the indicated GST fusion proteins of LC3 family members, and immunoblotted for TAX1BP1 or p62 expression.
Initial experiments of this nature revealed that Tax1bp1−/− T cells infected with wild type TAX1BP1 lentivirus restored the ability of these cells to initiate T cell proliferation after TCR stimulation (Figure 7B). By contrast, Tax1bp1−/− T cells transduced with a control GFP – nanoluciferase construct responded similarly to non-transduced (GFP-negative) Tax1bp1−/− cells (Figure 7B). Thus, TAX1BP1 expression in peripheral T cells (rather than a developmental problem in Tax1bp1−/− mice) accounts for TAX1BP1’s role in supporting proliferation of activated T cells. In contrast with wild type TAX1BP1, ΔLIR and ΔCC-ZF mutant forms of TAX1BP1 were incapable of augmenting proliferation of Tax1bp1−/− T cells (Figure 7B). Hence, TAX1BP1’s abilities to bind LC3 and to dimerize are important for supporting T cells. By contrast, the ΔZF mutant form of TAX1BP1, lacking ubiquitin binding motifs, retained the ability to accelerate cell division comparably to WT TAX1BP1 (Figure 7B). As controls, expression of each form of TAX1BP1 was verified in 293T cells (Figure 7C). In addition, zinc finger mediated ubiquitin binding was preserved in the ΔLIR mutant version of TAX1BP1, indicating that this mutant retains this critical function (Figure 7D). Hence, TAX1BP1 requires LC3 binding, but not ubiquitin binding, to support proliferation of activated T cells.
As the LIR motifs of TAX1BP1 are thought to interact with LC3 proteins, we tested the ability of these TAX1BP1 mutants to directly bind LC3B. ΔLIR and ΔCC-ZF forms of TAX1BP1 were unable to bind recombinant GST-LC3B in a glutathione pulldown assay, whereas TAX1BP1 ΔZF retained the ability to bind GST-LC3B (Figure 7C). These data reinforce the notion that the LIR and coiled-coil regions of TAX1BP1 are necessary for both binding to LC3B and for supporting TAX1BP1-dependent T cell proliferation. Given this central importance of LC3 binding in TAX1BP1 function, and as several LC3 family members exist in cells, we further investigated these TAX1BP1-LC3 interactions. We used GST-fusion proteins of various LC3 family members to perform pull down assays from whole cell lysates of normal activated T cells. These assays revealed that TAX1BP1 preferentially binds to LC3C, Gabarap, and GabarapL1 in normal T cells (Figure 7E). By contrast, p62, another putative autophagy adaptor expressed in T cells, exhibited preferential binding to LC3A, LC3B, LC3C, and GabarapL2 (Figure 7E). Considered together with the importance of TAX1BP1’s LIR motifs in supporting T cell proliferation, selective TAX1BP1 binding to these LC3 members provides a biochemical basis for TAX1BP1’s unique role in supporting autophagy and mTOR metabolism in stimulated T cells.
DISCUSSION
Our studies have unveiled links between the ubiquitin binding protein TAX1BP1, selective autophagy, mTORC1 activation, and the metabolic transition of activated T cells. Recent studies have highlighted the importance of a burst of glycolysis and biosynthesis in supporting the transition of small, slowly proliferating, naïve T cells into activated T cells. We have found that naïve Tax1bp1−/− T cells initially respond normally to TCR stimulation, activating multiple signaling cascades, expressing G1 phase associated cyclins, upregulating activation markers, and elaborating cytokines, but fail to coordinate the glycolytic and biosynthetic steps to support the completion of S phase and progression to G2 and mitosis. These defects were evident in semi-quantitative mass spectrometry assays, were manifest as small cells that failed to grow in size, and were accompanied by Seahorse bioenergetic defects. Thus, TAX1BP1 constitutes a critical link between initial T cell activation signals and the metabolic transformations that resting T cells undergo to begin proliferating.
We have uncovered profound defects in mTORC1 activation in Tax1bp1−/− T cells, including defective association of mTOR with Raptor and reduced 4EBP1 phosphorylation. Activation of mTORC1 requires AKT dependent activation of mTOR via heterotrimeric tuberous sclerosis complex (TSC) and the monomeric GTPase, Ras homolog enriched in brain (Rheb) (Powell et al., 2012). In addition, recent studies in model cell lines suggest that mTORC1 activation requires amino acid sensors that detect the presence of adequate amounts of these metabolites (Chantranupong et al., 2016; Wolfson et al., 2016). As we found that Tax1bp1−/− T cells exhibit defects in mTORC1 complex formation and 4EBP1 phosphorylation, but preserved pAKTT308, TAX1BP1’s role in activating mTORC1 appears to be mediated by amino acid sensing rather than via AKT activation.
We observed that defective autophagy precedes defective mTORC activation in Tax1bp1−/− T cells. Inhibiting autophagy suppressed mTOR activation in wild type T cells, suggesting that autophagy mediated recycling of intracellular organelles and/or proteins into autophagolysosomes provide amino acids to mTORC. Autophagolysosomes in T cells have been described to shift their contents from organelles to proteins during T cell activation (Hubbard et al., 2010). Our discovery that L-cysteine restores mTORC activation but not autophagy defects in Tax1bp1−/− T cells reinforces the concept that autophagy derived amino acids activate mTORC in T cells. It also raises the possibility that a specific cysteine sensor may couple this amino acid to mTORC1 activation. Hence, autophagy dependent recycling of proteins and lysosomal access to bioavailable amino acids lead to mTORC1 activation in newly activated T cells.
L-cysteine rescued metabolic and proliferative defects in ATG5 deficient T cells and 3-MA treated (autophagy deficient) T cells, indicating that L-cysteine replaces autophagy dependent amino acids that activate mTOR and facilitate T cell proliferation. L-cysteine exists at extremely low concentrations in mammalian cells (Okayasu et al., 1997). Treatment of mammalian cells with the proteasome inhibitor MG-132 selectively depletes intracellular cysteine, asparagine, and aspartate, and causes cell death. This death can be prevented with L-cysteine supplementation (Suraweera et al., 2012). Among all amino acids, L-cysteine is present at the lowest concentration in the blood plasma (Chawla et al., 1984; Eck et al., 1989; Saetre and Rabenstein, 1978). Meanwhile, activated T cells have strong transport activity for cysteine via the alanine, serine and cysteine-type amino acid transporter (ASC) but only a weak membrane transport activity for cystine (xc− system). The oxidation of cystine to cysteine by antigen presenting cells (APCs), followed by APC secretion of cysteine to T cells, may be an important mechanism by which APCs support T cell activation in vivo (Angelini et al., 2002; Gmünder et al., 1991; 1990). This mechanism could help explain why Tax1bp1−/− T cells exhibit milder metabolic deficits in vivo than in vitro (data not shown). Hence, L-cysteine joins L-glutamine and L-leucine as critical amino acids supporting T cell responses.
Although TAX1BP1 has recently been reported to support xenophagy and mitophagy, our studies in MEFs indicate that TAX1BP1 is not a global autophagy mediator akin to ATG5 (Lazarou et al., 2015; Tumbarello et al., 2015). Combined loss of TAX1BP1 with optineurin and NDP52 autophagy receptors led to global autophagy defects (Tumbarello et al., 2012), suggesting that these proteins may share partially redundant functions. By contrast, other autophagy receptors such as p62 and optineurin are expressed in T cells, so the failure to compensate for TAX1BP1 appears to reflect functional specification rather than differential expression. Indeed, while p62 decreases in model cell lines undergoing autophagy, p62 increases in T cells during T cell activation (Martin et al., 2006, and Figure S3). Together, these studies suggest that specialized forms of autophagy may regulate activating T cells distinctly from other cell types.
A20, a binding partner for TAX1BP1, has also been linked to autophagy. Like TAX1BP1 deficient T cells, A20 deficient T cells exhibit reduced autophagy (Matsuzawa et al., 2015). Hence, A20 and TAX1BP1 might collaborate to support autophagy. However, A20 expression is normal in TAX1BP1 deficient T cells, suggesting that TAX1BP1 performs this function independently of A20 (Figure S3). In addition, in marked contrast with TAX1BP1 deficient T cells, A20 deficient T cells display increased mTOR activity, and this increased mTOR activity may suppress autophagy in A20 deficient cells (Matsuzawa et al., 2015). Therefore, A20 and TAX1BP1 likely regulate mTOR activity via distinct mechanisms. The epistatic relationships between these proteins remains to be explored.
TAX1BP1 has been described as a selective autophagy receptor, a protein that bridges selected ubiquitinated cargos to autophagosome components (Birgisdottir et al., 2013; Rogov et al., 2014). However, our discovery that TAX1BP1 requires its LIR motif but not its ubiquitin binding motifs to support T cell proliferation suggests that TAX1BP1 performs this critical function in an LC3 dependent manner, but independently of ubiquitinated proteins. Hence, TAX1BP1 may support autophagosome progression beyond acting as a cargo adapter. Our findings that TAX1BP1 and p62 exhibit differential preferences in binding to LC3 family proteins could begin to explain why TAX1BP1 but not p62 supports autophagy in activated T cells (Martin et al., 2006). Finally, the HTLV-1 Tax1 protein has recently been reported to promote autophagy, suggesting that Tax1 may divert TAX1BP1 to selected autophagosomes in HTLV-1 infected T cells (Ren et al., 2015). The HTLV-2 Tax2 protein can also activate autophagy and immortalize human CD4+ T cells (Ren et al., 2012). Therefore, TAX1BP1 represents a class of autophagy inducing protein that selectively supports T cell activation. Future studies should reveal how TAX1BP1 and related proteins regulate specialized forms of autophagy.
In summary, we have discovered an unexpected function for TAX1BP1 in supporting autophagic flux, mTOR activation, and proliferation of recently activated T cells. This autophagic function triggers mTOR activation via the production of essential amino acids, and requires TAX1BP1’s LIR motifs. Hence, TAX1BP1 is a critical link between the initial TCR activation events and nutrient recycling that drives metabolic transition of activated T cells. Given the utility of the mTOR inhibitor rapamycin in suppressing immune responses in transplant patients (Calne et al., 1989; Morris, 1992), our discoveries suggest that targeting TAX1BP1 may be an important approach to modulating T cell responses.
EXPERIMENTAL PROCEDURES
Mice and in vivo experiments
Recombineering was used to generate a gene-targeting construct from a C57BL/6J bacterial artificial chromosome containing the Tax1bp1 gene (Figure S1A), and successfully targeted C57BL/6 ES cells (PRX-B6T, Primogenix) were injected into blastocysts. All animal experiments were performed in compliance with UCSF IACUC approved protocols.
Cell purification, culture, stimulation, and analyses
After red blood cell lysis, murine LN and spleen T cells were enriched to >90% purity using Dynabeads Untouched Mouse CD4 Cells Kit (Invitrogen). For some experiments, naïve cells (CD44lo CD62Lhi) were sorted using a MoFlo high-speed sorter (Beckman Coulter). Cells were analyzed on a LSR II flow cytometer (BD) and analyzed with FlowJo software (Tree Star).
For TCR proximal signaling experiments, purified T cells were stimulated with anti-CD3 mAb followed by crosslinking with goat anti-hamster IgG for the indicated times at 37°C with gentle shaking. For stimulations >1 h, purified T cells were stimulated with plate-coated anti-CD3 and anti-CD28, PMA plus ionomycin or concanavalin A as indicated. Calcium flux was measured using Fluo-4 NW (Invitrogen) according to the manufacturer’s instructions with modifications. Briefly, 4 × 10⁶ purified CD4 T cells were loaded with Fluo-4 NW dye mix for 30 min at 37°C followed by 30 min at 25°C. After labeling, cells were recorded for background fluorescence by flow cytometry before addition of anti-CD3 at 30 s and goat anti-hamster IgG at 120 s. Detailed protocols are described in Supplemental Experimental Procedures.
Mitochondria and mitochondrial ROS quantitation
Mitochondria quantitation was performed using MitoTracker Green FM by flow cytometry using the manufacturer’s instructions (Invitrogen). Mitochondrial ROS quantitation was performed using MitoSOX Red by flow cytometry using the manufacturer’s instructions (Invitrogen).
Seahorse assays
Purified CD4 T cells were stimulated with plate-bound anti-CD3 and anti-CD28 for 24 h. After stimulation, cells were analyzed using the XF Glycolysis Stress Test according to manufacturer’s instructions (Seahorse Bioscience). An XF-24 Extracellular Flux Analyzer (Seahorse Bioscience) was used to measure ECAR in response to 10 mM glucose, 1 μM oligomycin and 100 mM 2-deoxyglucose.
Molecular analyses
Cells were incubated in lysis buffer [(10mM HEPES, pH 7.4, 150mM NaCl, 0.5% NP-40 or 0.3% CHAPS) supplemented with complete EDTA-Free Protease Inhibitor Cocktail (Roche), phosphatase inhibitors (1 mM Na3VO4 and 10 mM NaF) and 10 mM N-ethylmaleimide and centrifuged for 10 min (21,000 × g at 4°C). Supernatants were used for immunoprecipitation assays, pull-down assays and immunoblotting. Semi-quantitative mass spectrometry studies were performed using five replicates as previously described (Louie et al., 2016). Quantitative real time PCR was performed using Taqman primers on an ABI 7300 (Applied Biosystems). Detailed protocols are described in Supplemental Experimental Procedures.
Lentivirus preparation and T cell transduction
Tax1bp1−/− T cells were infected with lentiviruses encoding WT and mutant TAX1BP1 constructs 24 h after activation. Culture medium was replaced with complete RPMI containing 20 U/ml rhIL-2 (Peprotech) at 1 day and 3 days post-spinfection. Five days after spinfection, cells were labeled with eFluor670 (eBioscience) and re-stimulated using anti-CD3 and anti-CD28 antibodies. Detailed protocols are described in Supplemental Experimental Procedures.
Supplementary Material
Highlights.
Tax1bp1−/− T cells exhibit biosynthetic defects, delaying initial cell cycling.
TAX1BP1 supports autophagic flux and activation of mTORC.
L-cysteine rescues mTORC activation, bypassing the need for autophagic flux.
TAX1BP1 supports T cell autophagy in response to TCR activation but not starvation.
Acknowledgments
This work was supported by cores supported by NIH P30 DK026743, P30 DK063720. M.I.W. and M.K. were partially supported by NIH T32 DK007007. We thank Kevan Shokat, Emin Maltepe, and Jeroen Roose for helpful comments and advice. We thank Priscilia Tanbun, Yenny Rosli, and Julio Barrera for general laboratory assistance.
Footnotes
Supplemental Information includes four figures and Supplemental Experimental Procedures
AUTHOR CONTRIBUTIONS
M. I. W. designed and performed the experiments and helped write the manuscript; R. M. T. generated Tax1bp1−/− mice with B.A.M., and performed initial mouse analyses; D. I. B. performed the metabolome analyses; M. G. K. contributed to lentivirus complementation experiments; R. A. assisted with breeding and mouse experiments; J. D. provided expertise and oversight for autophagy experiments; D. K. N. supervised metabolome experiments; B. A. M. supervised the overall study and helped write the manuscript; A.M. supervised the overall study and helped write the manuscript.
Publisher's Disclaimer: This is a PDF file of an unedited manuscript that has been accepted for publication. As a service to our customers we are providing this early version of the manuscript. The manuscript will undergo copyediting, typesetting, and review of the resulting proof before it is published in its final citable form. Please note that during the production process errors may be discovered which could affect the content, and all legal disclaimers that apply to the journal pertain.
References
- Angelini G, Gardella S, Ardy M, Ciriolo MR, Filomeni G, Di Trapani G, Clarke F, Sitia R, Rubartelli A. Antigen-presenting dendritic cells provide the reducing extracellular microenvironment required for T lymphocyte activation. Proc Natl Acad Sci U S A. 2002;99:1491–1496. doi: 10.1073/pnas.022630299. [DOI] [PMC free article] [PubMed] [Google Scholar]
- Beugnet A, Tee AR, Taylor PM, Proud CG. Regulation of targets of mTOR (mammalian target of rapamycin) signalling by intracellular amino acid availability. Biochem J. 2003;372:555–566. doi: 10.1042/BJ20021266. [DOI] [PMC free article] [PubMed] [Google Scholar]
- Birgisdottir ÅB, Lamark T, Johansen T. The LIR motif - crucial for selective autophagy. Journal of Cell Science. 2013;126:3237–3247. doi: 10.1242/jcs.126128. [DOI] [PubMed] [Google Scholar]
- Calne RY, Collier DS, Lim S, Pollard SG, Samaan A, White DJ, Thiru S. Rapamycin for immunosuppression in organ allografting. Lancet. 1989;2:227. doi: 10.1016/s0140-6736(89)90417-0. [DOI] [PubMed] [Google Scholar]
- Chantranupong L, Scaria SM, Saxton RA, Gygi MP, Shen K, Wyant GA, Wang T, Harper JW, Gygi SP, Sabatini DM. The CASTOR proteins are arginine sensors for the mTORC1 pathway. Cell. 2016;165:153–164. doi: 10.1016/j.cell.2016.02.035. [DOI] [PMC free article] [PubMed] [Google Scholar]
- Chawla RK, Lewis FW, Kutner MH, Bate DM, Roy RG, Rudman D. Plasma cysteine, cystine, and glutathione in cirrhosis. Gastroenterology. 1984;87:770–776. [PubMed] [Google Scholar]
- De Valck D, Jin DY, Heyninck K, Van de Craen M, Contreras R, Fiers W, Jeang KT, Beyaert R. The zinc finger protein A20 interacts with a novel anti-apoptotic protein which is cleaved by specific caspases. Oncogene. 1999;18:4182–4190. doi: 10.1038/sj.onc.1202787. [DOI] [PubMed] [Google Scholar]
- Eck HP, Gmünder H, Hartmann M, Petzoldt D, Daniel V, Dröge W. Low concentrations of acid-soluble thiol (cysteine) in the blood plasma of HIV-1-infected patients. Biol Chem Hoppe-Seyler. 1989;370:101–108. doi: 10.1515/bchm3.1989.370.1.101. [DOI] [PubMed] [Google Scholar]
- Fox CJ, Hammerman PS, Thompson CB. Fuel feeds function: energy metabolism and the T-cell response. Nat Rev Immunol. 2005;5:844–852. doi: 10.1038/nri1710. [DOI] [PubMed] [Google Scholar]
- Gachon F, Peleraux A, Thebault S, Dick J, Lemasson I, Devaux C, Mesnard JM. CREB-2, a cellular CRE-dependent transcription repressor, functions in association with Tax as an activator of the human T-cell leukemia virus type 1 promoter. J Virol. 1998;72:8332–8337. doi: 10.1128/jvi.72.10.8332-8337.1998. [DOI] [PMC free article] [PubMed] [Google Scholar]
- Gingras AC, Gygi SP, Raught B, Polakiewicz RD, Abraham RT, Hoekstra MF, Aebersold R, Sonenberg N. Regulation of 4E-BP1 phosphorylation: a novel two-step mechanism. Genes Dev. 1999;13:1422–1437. doi: 10.1101/gad.13.11.1422. [DOI] [PMC free article] [PubMed] [Google Scholar]
- Gingras AC, Raught B, Sonenberg N. Regulation of translation initiation by FRAP/mTOR. Genes Dev. 2001;15:807–826. doi: 10.1101/gad.887201. [DOI] [PubMed] [Google Scholar]
- Gmünder H, Eck HP, Dröge W. Low membrane transport activity for cystine in resting and mitogenically stimulated human lymphocyte preparations and human T cell clones. Eur J Biochem. 1991;201:113–117. doi: 10.1111/j.1432-1033.1991.tb16263.x. [DOI] [PubMed] [Google Scholar]
- Gmünder H, Eck HP, Benninghoff B, Roth S, Dröge W. Macrophages regulate intracellular glutathione levels of lymphocytes. Evidence for an immunoregulatory role of cysteine. Cellular Immunology. 1990;129:32–46. doi: 10.1016/0008-8749(90)90184-s. [DOI] [PubMed] [Google Scholar]
- Hsieh AC, Costa M, Zollo O, Davis C, Feldman ME, Testa JR, Meyuhas O, Shokat KM, Ruggero D. Genetic dissection of the oncogenic mTOR pathway reveals druggable addiction to translational control via 4EBP-eIF4E. Cancer Cell. 2010;17:249–261. doi: 10.1016/j.ccr.2010.01.021. [DOI] [PMC free article] [PubMed] [Google Scholar]
- Hubbard VM, Valdor R, Patel B, Singh R, Cuervo AM, Macian F. Macroautophagy regulates energy metabolism during effector T cell activation. The Journal of Immunology. 2010;185:7349–7357. doi: 10.4049/jimmunol.1000576. [DOI] [PMC free article] [PubMed] [Google Scholar]
- Iha H, Peloponese J, Verstrepen L, Zapart G, Ikeda F, Smith C, Starost M, Yedavalli V, Heyninck K, Dikic I, et al. Inflammatory cardiac valvulitis in TAX1BP1-deficient mice through selective NF-kappaB activation. Embo J. 2008;27:629–641. doi: 10.1038/emboj.2008.5. [DOI] [PMC free article] [PubMed] [Google Scholar]
- Inoki K, Li Y, Zhu T, Wu J, Guan K-L. TSC2 is phosphorylated and inhibited by Akt and suppresses mTOR signalling. Nat Cell Biol. 2002;4:648–657. doi: 10.1038/ncb839. [DOI] [PubMed] [Google Scholar]
- Jin DY, Teramoto H, Giam CZ, Chun RF, Gutkind JS, Jeang KT. A human suppressor of c-Jun N-terminal kinase 1 activation by tumor necrosis factor alpha. J Biol Chem. 1997;272:25816–25823. doi: 10.1074/jbc.272.41.25816. [DOI] [PubMed] [Google Scholar]
- Lazarou M, Sliter DA, Kane LA, Sarraf SA, Wang C, Burman JL, Sideris DP, Fogel AI, Youle RJ. The ubiquitin kinase PINK1 recruits autophagy receptors to induce mitophagy. Nature. 2015;524:309–314. doi: 10.1038/nature14893. [DOI] [PMC free article] [PubMed] [Google Scholar]
- Ling L, Goeddel D. T6BP, a TRAF6-interacting protein involved in IL-1 signaling. Proc Natl Acad Sci U S A. 2000;97:9567–9572. doi: 10.1073/pnas.170279097. [DOI] [PMC free article] [PubMed] [Google Scholar]
- Louie SM, Grossman EA, Crawford LA, Ding L, Camarda R, Huffman TR, Miyamoto DK, Goga A, Weerapana E, Nomura DK. GSTP1 is a driver of triple-negative breast cancer cell metabolism and pathogenicity. Cell Chem Biol. 2016;23:567–578. doi: 10.1016/j.chembiol.2016.03.017. [DOI] [PMC free article] [PubMed] [Google Scholar]
- MacIver NJ, Jacobs SR, Wieman HL, Wofford JA, Coloff JL, Rathmell JC. Glucose metabolism in lymphocytes is a regulated process with significant effects on immune cell function and survival. J Leukoc Biol. 2008;84:949–957. doi: 10.1189/jlb.0108024. [DOI] [PMC free article] [PubMed] [Google Scholar]
- MacIver NJ, Michalek RD, Rathmell JC. Metabolic regulation of T lymphocytes. Annu Rev Immunol. 2013;31:259–283. doi: 10.1146/annurev-immunol-032712-095956. [DOI] [PMC free article] [PubMed] [Google Scholar]
- Manning BD, Tee AR, Logsdon MN, Blenis J, Cantley LC. Identification of the tuberous sclerosis complex-2 tumor suppressor gene product tuberin as a target of the phosphoinositide 3-kinase/akt pathway. Mol Cell. 2002;10:151–162. doi: 10.1016/s1097-2765(02)00568-3. [DOI] [PubMed] [Google Scholar]
- Martin P, Martin P, Diaz-Meco MT, Diaz-Meco MT, Moscat J, Moscat J. The signaling adapter p62 is an important mediator of T helper 2 cell function and allergic airway inflammation. Embo J. 2006;25:3524–3533. doi: 10.1038/sj.emboj.7601250. [DOI] [PMC free article] [PubMed] [Google Scholar]
- Matsuzawa Y, Oshima S, Takahara M, Maeyashiki C, Nemoto Y, Kobayashi M, Nibe Y, Nozaki K, Nagaishi T, Okamoto R, et al. TNFAIP3 promotes survival of CD4 T cells by restricting MTOR and promoting autophagy. Autophagy. 2015;11:1052–1062. doi: 10.1080/15548627.2015.1055439. [DOI] [PMC free article] [PubMed] [Google Scholar]
- Morris RE. Rapamycins: Antifungal, antitumor, antiproliferative, and immunosuppressive macrolides. Transplantation Reviews. 1992;6:39–87. [Google Scholar]
- Nakano S, Ikebe E, Tsukamoto Y, Wang Y, Matsumoto T, Mitsui T, Yahiro T, Inoue K, Kawazato H, Yasuda A, et al. Commensal microbiota contributes to chronic endocarditis in TAX1BP1 deficient mice. PLoS ONE. 2013;8:e73205. doi: 10.1371/journal.pone.0073205. [DOI] [PMC free article] [PubMed] [Google Scholar]
- Newman AC, Scholefield CL, Kemp AJ, Newman M, McIver EG, Kamal A, Wilkinson S. TBK1 kinase addiction in lung cancer cells is mediated via autophagy of Tax1bp1/Ndp52 and non-canonical NF-κB signalling. PLoS ONE. 2012;7:e50672. doi: 10.1371/journal.pone.0050672. [DOI] [PMC free article] [PubMed] [Google Scholar]
- Okayasu T, Ikeda M, Akimoto K, Sorimachi K. The amino acid composition of mammalian and bacterial cells. Amino Acids. 1997;13:379–391. [Google Scholar]
- Pearce EL, Poffenberger MC, Chang CH, Jones RG. Fueling immunity: insights into metabolism and lymphocyte function. Science. 2013;342:1242454. doi: 10.1126/science.1242454. [DOI] [PMC free article] [PubMed] [Google Scholar]
- Pollizzi KN, Powell JD. Integrating canonical and metabolic signalling programmes in the regulation of T cell responses. Nat Rev Immunol. 2014;14:435–446. doi: 10.1038/nri3701. [DOI] [PMC free article] [PubMed] [Google Scholar]
- Powell JD, Pollizzi KN, Heikamp EB, Horton MR. Regulation of immune responses by mTOR. Annu Rev Immunol. 2012;30:39–68. doi: 10.1146/annurev-immunol-020711-075024. [DOI] [PMC free article] [PubMed] [Google Scholar]
- Pua H, Dzhagalov I, Chuck M, Mizushima N, He Y. A critical role for the autophagy gene Atg5 in T cell survival and proliferation. J Exp Med. 2007;204:25–31. doi: 10.1084/jem.20061303. [DOI] [PMC free article] [PubMed] [Google Scholar]
- Ren T, Takahashi Y, Liu X, Loughran TP, Sun SC, Wang HG, Cheng H. HTLV-1 Tax deregulates autophagy by recruiting autophagic molecules into lipid raft microdomains. Oncogene. 2015;34:334–345. doi: 10.1038/onc.2013.552. [DOI] [PMC free article] [PubMed] [Google Scholar]
- Ren T, Dong W, Takahashi Y, Xiang D, Yuan Y, Liu X, Loughran TP, Sun SC, Wang HG, Cheng H. HTLV-2 Tax immortalizes human CD4+ memory T lymphocytes by oncogenic activation and dysregulation of autophagy. Journal of Biological Chemistry. 2012;287:34683–34693. doi: 10.1074/jbc.M112.377143. [DOI] [PMC free article] [PubMed] [Google Scholar]
- Rogov V, Dötsch V, Johansen T, Kirkin V. Interactions between autophagy receptors and ubiquitin-like proteins form the molecular basis for selective autophagy. Mol Cell. 2014;53:167–178. doi: 10.1016/j.molcel.2013.12.014. [DOI] [PubMed] [Google Scholar]
- Saetre R, Rabenstein DL. Determination of cysteine in plasma and urine and homocysteine in plasma by high-pressure liquid chromatography. Anal Biochem. 1978;90:684–692. doi: 10.1016/0003-2697(78)90161-6. [DOI] [PubMed] [Google Scholar]
- Salmond RJ, Brownlie RJ, Meyuhas O, Zamoyska R. Mechanistic target of rapamycin complex 1/S6 kinase 1 signals influence T cell activation independently of ribosomal protein S6 phosphorylation. The Journal of Immunology. 2015;195:4615–4622. doi: 10.4049/jimmunol.1501473. [DOI] [PMC free article] [PubMed] [Google Scholar]
- Sarbassov DD, Guertin DA, Ali SM, Sabatini DM. Phosphorylation and regulation of Akt/PKB by the rictor-mTOR complex. Science. 2005;307:1098–1101. doi: 10.1126/science.1106148. [DOI] [PubMed] [Google Scholar]
- Shembade N, Harhaj N, Liebl D, Harhaj E. Essential role for TAX1BP1 in the termination of TNF-alpha-, IL-1- and LPS-mediated NF-kappaB and JNK signaling. Embo J. 2007;26:3910–3922. doi: 10.1038/sj.emboj.7601823. [DOI] [PMC free article] [PubMed] [Google Scholar]
- Shigemitsu K, Tsujishita Y, Hara K, Nanahoshi M, Avruch J, Yonezawa K. Regulation of translational effectors by amino acid and mammalian target of rapamycin signaling pathways. Possible involvement of autophagy in cultured hepatoma cells. J Biol Chem. 1999;274:1058–1065. doi: 10.1074/jbc.274.2.1058. [DOI] [PubMed] [Google Scholar]
- Suraweera A, Münch C, Hanssum A, Bertolotti A. Failure of amino acid homeostasis causes cell death following proteasome inhibition. Mol Cell. 2012;48:242–253. doi: 10.1016/j.molcel.2012.08.003. [DOI] [PMC free article] [PubMed] [Google Scholar]
- Tumbarello DA, Manna PT, Allen M, Bycroft M, Arden SD, Kendrick-Jones J, Buss F. The autophagy receptor TAX1BP1 and the molecular motor myosin VI are required for clearance of salmonella typhimurium by autophagy. PLoS Pathog. 2015;11:e1005174. doi: 10.1371/journal.ppat.1005174. [DOI] [PMC free article] [PubMed] [Google Scholar]
- Tumbarello DA, Waxse BJ, Arden SD, Bright NA, Kendrick-Jones J, Buss F. Autophagy receptors link myosin VI to autophagosomes to mediate Tom1-dependent autophagosome maturation and fusion with the lysosome. Nat Cell Biol. 2012;14:1024–1035. doi: 10.1038/ncb2589. [DOI] [PMC free article] [PubMed] [Google Scholar]
- Wang R, Dillon CP, Shi LZ, Milasta S, Carter R, Finkelstein D, McCormick LL, Fitzgerald P, Chi H, Munger J, et al. The Transcription Factor Myc Controls Metabolic Reprogramming upon T Lymphocyte Activation. Immunity. 2011;35:871–882. doi: 10.1016/j.immuni.2011.09.021. [DOI] [PMC free article] [PubMed] [Google Scholar]
- Wolfson RL, Chantranupong L, Saxton RA, Shen K, Scaria SM, Cantor JR, Sabatini DM. Sestrin2 is a leucine sensor for the mTORC1 pathway. Science. 2016;351:43–48. doi: 10.1126/science.aab2674. [DOI] [PMC free article] [PubMed] [Google Scholar]
Associated Data
This section collects any data citations, data availability statements, or supplementary materials included in this article.