

Abstract
BACKGROUND
Although small elevations of high sensitive cardiac troponin T (hs-cTnT) are associated with incident heart failure (HF) in the general population, the underlying mechanisms are not well defined. Evaluating the association of hs-cTnT with replacement fibrosis and progression of structural heart disease prior to symptoms is fundamental to understanding the potential of this biomarker in a HF prevention strategy.
METHODS
We measured hs-cTnT at baseline among 4,986 participants in the Multi-Ethnic Study of Atherosclerosis (MESA), a cohort initially free of overt cardiovascular disease (CVD). Cardiac magnetic resonance (CMR) imaging was performed at baseline. Repeat CMR was performed 10 years later among 2,831 participants who remained free of interim CVD events; of these 1,723 received gadolinium-enhanced CMR for characterization of replacement fibrosis by late gadolinium enhancement (LGE). Progression of subclinical CVD was defined by 10-year change in left ventricular structure and function. Associations of hs-cTnT with incident HF, CV-related mortality, and coronary heart disease were estimated using Cox regression models.
RESULTS
LGE for replacement fibrosis was detectable in 6.3% participants without interim CVD events by follow-up CMR. A graded association was observed between higher baseline hs-cTnT categories and LGE (≥7.42 ng/L vs <limit of detection [LOD: < 3 ng/L], adjusted odds ratio [OR]=2.87, 95% CI: 1.38, 5.94). Higher hs-cTnT was also associated with a greater probability of an increase in LV mass >12% (highest category vs <LOD), OR=1.50, 95% confidence interval [CI]:1.09–2.07), but not with decline in LV ejection fraction. The risk of incident HF was greater for higher hs-cTnT (≥8.81 ng/L vs <LOD, adjusted hazards ratio [HR] 5.59, 95%CI, 2.97 – 10.68).
CONCLUSIONS
hs-cTnT levels are associated with replacement fibrosis and progressive changes in LV structure in CVD free adults, findings that may precede HF symptoms by years. Minor elevations of hs-cTnT may represent a biochemical signature of early subclinical cardiac disease, providing an opportunity for targeted preventive interventions.
Keywords: Troponin T, heart failure, cardiovascular events, cardiovascular magnetic resonance imaging, epidemiology
Subject Terms: Heart Failure, Epidemiology, Magnetic Resonance Imaging, Remodeling
BACKGROUND/SIGNIFICANCE
Cardiovascular disease (CVD) is the leading cause of morbidity and mortality in the industrialized world and its impact on developing countries has made it a global epidemic.1, 2 With an aging population, incident heart failure (HF) has become an increasing common initial presentation of CVD.3 Once diagnosed, there is a rapid decline in quality of life, as well as an increase in medical expenses and mortality.4, 5 Unlike the primary prevention of atherosclerotic disease, prevention of HF has been more challenging beyond basic management of traditional risk factors, with heterogeneous progression of pathophysiology in asymptomatic individuals.
The concept of preclinical HF stages was introduced as a strategy to identify individuals at risk for future HF, in whom closer monitoring and attention to prevention are warranted.6 The presence of stage B preclinical HF findings, which includes electrocardiographic and imaging measures of left ventricular hypertrophy (LVH) and dysfunction, predicts progression to HF and death.7, 8 We and others have shown that high sensitive cardiac troponins I and T (hs-cTnI, hs-cTnT), biomarkers that can detect very small amounts of myocyte injury, are associated with structural cardiac abnormalities that define a stage B HF phenotype, most notably LVH.9–12 Moreover, small elevations in hs-cTnT and hs-cTnI predict progression to incident HF and CV death among asymptomatic individuals in the general population.9–13 However, the extent to which hs-cTn levels identify individuals at risk for progression of structural cardiac abnormalities is unknown. Moreover, it is not known if low levels of hs-cTn represent an early biochemical signature of myocyte cell loss with replacement fibrosis, indicative of an ongoing dynamic process resulting in subsequent pathophysiologic changes in cardiac structure and function. Such insight could provide targeting of preventive therapy years before detection of structural heart disease (i.e. in advance of imaging-based stage B preclinical HF) and development of symptoms by allowing early differentiation of individuals with similar traditional risk factor profiles who are at highest risk for CVD progression and death.
Therefore, the purpose of this study was to determine if hs-cTnT identifies an early phenotype for subclinical cardiac disease, as assessed by serial cardiovascular magnetic resonance imaging (CMR), and CVD outcomes, in a prospective, ethnically diverse general population cohort free from CVD at baseline.
METHODS
Study Population
Details of the Multi-Ethnic Study of Atherosclerosis (MESA) study design have been previously described.14 In short, 6814 men and women, 45 to 84 years of age and of 4 self-reported race/ethnicities (non-Hispanic white, African-American, Hispanic, and Chinese) who were free of known CVD (including a history of HF) were enrolled in 6 participating centers in the United States. Upon entry, all participants underwent extensive evaluations, including questionnaires, physical examination, and laboratory tests. For these analyses, we included individuals who had a complete CMR evaluation done at exam 1; for further analyses of changes in subclinical CVD we included those participants with complete CMR at both exam 1 and exam 5 and who remained free of interim clinically overt CVD, as described below. All participants provided informed consent for participation. MESA was approved by the Institutional Review Boards of the University of Washington and the participating sites; the measurement of hs-cTnT and this analysis were approved by the Institutional Review Board of the University of Maryland, Baltimore.
Biomarker Assay Measurements
hs-cTnT was measured in EDTA plasma collected at baseline (Exam 1, 2000–2002). Sequential biomarker measures of amino-terminal B-type natriuretic peptide (NT-proBNP) were also performed on blood samples collected at Exam 1 and 3 (2003–2005). NT-proBNP had already been measured in 5597 participants at baseline (Exam 1)15 and 4996 participants at Exam 3, but was measured in all additional participants at both time points with available plasma who were without a prior measure. All hs-cTnT at Exam 1, plus additional NT-proBNP levels at Exams 1 and 3, were measured at the University of Maryland using the Cobas e601 (Roche Diagnostics, Indianapolis, IN) A 250 μl EDTA plasma sample previously unthawed or only thawed once was used for analysis. For hs-cTnT, the inter-assay coefficient of variation (CVs) observed for the MESA cohort measurements were 3.6% at 28 ng/L and 2.0% at 2154 ng/L. The Cobas e601 instrument used in this study is superior for low-end measurement of hs-cTnT due to an additional wash step that improves the assay’s signal-to-noise ratio compared to the Cobas e411. This translates into better performance; by comparison the 10%CV is 4.3 ng/L for e601 compared to 8 ng/L for e411, and the LoQ (20% CV) is 5.6 ng/L for e411 and 2.5 ng/L on the e601 (personal communication, Amy Sanger, PhD, Roche Diagnostics, June 6, 2015). Thus measurements at the 3 ng/L, defined as the limit of detection (LOD) as the lowest reported value from the instrument, were well within the reportable range for the hs-cTnT used in this study. Details for NT-proBNP have previously been reported.15 In total, 4986 (99.7%) of those with CMR completed at Exam 1 had hs-cTnT measured at exam 1, and 4991 (99.8%) had NT-proBNP measured.
CMR Imaging and Image Analysis
CMR exams at Exam 1 and 5 were performed as previously described.16 To account for the different pulse MRI sequences and subsequent variances in measurements, correction equations were used to convert fast gradient echo MRI pulse (FGRE) sequence measurements (Exam 1) into steady-state free precession (SSFP) measurements (exam 5) for longitudinal measurement analyses.17 Contrast enhanced CMR studies using LGE were performed during Exam 5 only, among those without contraindications for gadolinium. LGE images were acquired 10 to 15 min after intravenous administration of 0.15 mmol/kg gadolinium-DTPA (Magnevist, Schering, Berlin, Germany) with breath-held segmented inversion-recovery sequence, and acquired in the same orientations as the cine images. Inversion times were adjusted to null normal myocardium. Myocardial scar (replacement fibrosis) was defined as focal late gadolinium enhancement (LGE) either in 2 adjacent short-axis slices or in 1 short-axis and a long-axis image at a corresponding location using QMass (version 7.2, Medis). Myocardial scars that involved subendocardium in a coronary artery distribution were defined as “typical” scar. Myocardial scars predominantly affecting midwall or subepicardium without subendocardial involvement in a non-coronary artery distribution were defined as an “atypical” scar.18
Clinical Follow-Up and Cohort Surveillance
MESA study clinical event endpoints considered in this analysis included: HF hospitalization; acute myocardial infarction and other forms of incident coronary heart disease (CHD); and CV mortality. Events were adjudicated by the MESA study group as previously described.15, 19 Incident HF and CHD events were ascertained by participant interview at semi-annual study visits. Incident HF for this analysis comprised events adjudicated as probable or definite. CV death was defined as death related to atherosclerotic heart disease (fatal myocardial infarction and definite and possible fatal coronary heart disease), death following cerebrovascular disease (fatal stroke) or death from other atherosclerotic and cardiovascular diseases, as described in detail previously.14
Candidate Covariates
Clinical characteristics and CV risk factors were obtained as described previously.14 The following candidate covariates for this analysis included: age, sex, ethnicity, smoking status (current/former/never), hypertension medication use, systolic and diastolic blood pressure, weight, height, diabetes, lipid levels, and renal function at Exam 1. Hypertension was defined as systolic blood pressure ≥140 mm Hg, diastolic blood pressure ≥90 mm Hg, or treatment for hypertension. Individuals with diabetes were defined as either having fasting plasma glucose ≥126 mg/dL or receiving treatment for diabetes mellitus. Estimated glomerular filtration rate (eGFR) was calculated from serum creatinine using the CKD-Epi equation.20
Statistical Analysis
We examined hs-cTnT as a predictor variable using two complementary methods: First, we pre-defined five categories of hs-cTnT concentration. The lowest category consisted of those participants with concentrations below the LOD (i.e. <3 ng/L: category 1), and the remaining distribution of measurable hs-cTnT were divided into 4 categories of equal numbers of participants (categories 2–5). Second, we modeled hs-cTnT as a continuous log-linear form, after taking the natural log of hs-cTnT values; values <LOD were imputed at 1.5 ng/L (i.e., 50% of the lowest detectable value).
Baseline demographic, clinical and laboratory characteristics were compared across the five categories of hs-cTnT using ANOVA, or Cuzik’s test for trend, as appropriate.21 The relationship of hs-cTnT and NT-proBNP with aging was examined by robust locally weighted regression of each biomarker vs. age, and displayed graphically separately among males and females.22 To identify factors independently associated with greater hs-cTnT, we performed multiple logistic regression with the highest category of hs-cTnT as the dependent variable, and the baseline patient characteristics as independent variables.
We used multiple linear regression to examine cross-sectional relations of hs-cTnT categories with continuous measures of subclinical CVD: LV mass (LVM), LV end-diastolic volume (LVEDV), and LV ejection fraction (LVEF). As associations with continuous measures of cardiac structure and function may fail to adequately describe relationships with subclinical cardiac disease, we additionally examined associations of hs-cTnT with abnormal LVM and LVEF with logistic regression, using previously established cut-points to define LV hypertrophy (LVH)23 and abnormal LVEF (<50%). For all regression models, adjustment was made for demographic factors (age, gender, and race/ethnicity), traditional CVD risk factors (systolic and diastolic blood pressure, use of anti-hypertensive medications, diabetes, smoking), height and weight, and for eGFR.
The association between baseline hs-cTnT and change in each CMR measure was examined through multiple linear regression models, with the follow-up CMR measure (LVM, LVEDV, and LVEF) as dependent variables, hs-cTnT as the primary independent variable, and adjustment variables including the initial CMR measure, demographics, traditional CVD risk factors, and eGFR as defined above. Robust estimates of standard errors were used to provide non-biased estimates in the setting of heteroscedasticity. For these analyses, only those subjects with both initial and follow-up CMR measures, and without incident CHD and HF between these visits, were included; separate categorization of hs-cTnT levels as described above was performed among this study sample. Each type of follow-up CMR measure was initially considered as a continuous outcome. Since continuous measures of change may fail to fully characterize the relation of hs-cTnT with changes in subclinical CVD, we also defined a priori cut-points indicating “clinically significant” longitudinal changes for each CMR measure defined as a binary outcome (progression vs. no progression). Cut-points defining significant progression included: a) for LVEF, >10% relative decrease; b) for LVM, >12% increase; c) for LVEDV, >8% increase. These cut points define a change more than twice the technical error of the mean (analogous to the coefficient of variation) for inter observer variability for each measure, using previously reported data.16 Change in each measure greater than these thresholds can be considered as highly unlikely to represent merely measurement error. We furthermore examined changes in subclinical CVD as characterized by longitudinal increases in NT-proBNP, as defined previously by a >25% increase to a level >=80 ng/L.24 Associations between baseline hs-cTnT and these “significant” changes in CMR measures and NT-proBNP were examined using logistic regression, adjusting for baseline NT-proBNP and additional covariates as described above.
The frequency and subtype (ischemic vs. non-ischemic) of LGE pattern on follow-up MRI were compared across categories of baseline hs-cTnT with the chi-squared test. The adjusted association between hs-cTnT and LGE were examined using logistic regression, adjusting for the demographic and CVD risk factors described above, and in addition for LV mass and LV ejection fraction. These analyses were performed among those with complete contrast-enhanced CMR at visit 5 who remained free of HF and CVD events, with categories of hs-cTnT defined among this study sample as described above.
The incidence of HF, CHD, and CV mortality were compared across hs-cTnT categories using the Kaplan-Meier method and the log-rank test, with follow-up time defined as time from the baseline study visit, with censoring on death (or - for the outcome of CV mortality – death from non-CV causes) or the date of the last study visit. Adjusted associations were estimated using Cox survival regression models. Adjustment covariates included the demographic and CVD risk factors described above. The study sample for these analyses included those with complete CMR measures and hs-cTnT measures at Exam 1. Tests of Schoenfeld residuals and -ln(-ln) plots were used to verify the proportional hazards assumption. All analyses were performed with Sata SE v12.1 (Statacorp, College Station, TX).
RESULTS
Study Population
Among 4986 participants with complete CMR and hs-cTnT at Exam 1, an hs-cTnT level above the LOD was present in 3341(67%) of participants. Increasing levels of hs-cTnT were associated with older age, male gender, Caucasian race, diabetes, renal dysfunction, greater BMI, higher NT-proBNP, lower proportion of good-excellent self-reported health, and a history of hypertension and smoking (Table 1). Factors independently associated with elevated hscTnT (≥8.81 ng/L, highest category) were older age, male gender, African-American ethnicity, diabetes and impaired fasting glucose, greater BMI, lower eGFR, higher NT-proBNP, and use of diuretics (Supplemental Table 1)
Table 1.
Characteristics of Study Population, by concentration of hs-cTnT
| Below LOD | 3.0–4.25 ng/L | 4.26–5.87ng/L | 5.88–8.80 ng/L | ≥8.81 ng/L | Test for trend | |
|---|---|---|---|---|---|---|
| N | 1645 | 825 | 843 | 837 | 836 | |
| Range (ng/L) | <3.0 | 3.0–4.25 | 4.26–5.87 | 5.88–8.8 | 8.81+ | |
| Age | 56.8 (8.5) | 59.7 (9.5) | 62.1 (9.6) | 64.9 (9.4) | 68.7 (9.4) | <.001 |
| Male | 440 (26.8%) | 367 (44.5%) | 434 (51.5%) | 308 (36.8%) | 605 (72.4%) | <.001 |
| Ethnicity | <.001 | |||||
| Caucasian | 579 (35.2%) | 324 (39.3%) | 333 (39.5%) | 366 (43.7%) | 347 (41.5%) | |
| Chinese | 273 (16.6%) | 126 (15.3%) | 108 (12.8%) | 89 (10.6%) | 56 (6.7%) | |
| African-Am | 402 (24.4%) | 185 (22.4%) | 195 (23.1%) | 219 (26.2%) | 278 (33.3%) | |
| Hispanic | 391 (23.8%) | 190 (23.0%) | 207 (24.6%) | 163 (19.5%) | 155 (18.5%) | |
| Hypertension | 460 (28.0%) | 306 (37.1%) | 387 (45.9%) | 443 (52.9%) | 516 (61.7%) | <.001 |
| SBP (mm Hg) | 119.3 (19.2) | 122.6 (19.6) | 126.8 (20.8) | 130.4 (21.0) | 133.7 (23.2) | <.001 |
| DBP (mm Hg) | 69.9 (9.9) | 71.3 (10.4) | 72.8 (10.0) | 73.7 (10.0) | 73.3 (10.9) | <.001 |
| Diabetes Status | <.001 | |||||
| Normal | 1353 (82.4%) | 658 (79.9%) | 654 (77.7%) | 602 (72.2%) | 488 (58.4%) | |
| IFG | 180 (11.0%) | 108 (13.1%) | 94 (11.2%) | 117 (14.0%) | 146 (17.5%) | |
| Untreated DM | 28 (1.7%) | 13 (1.6%) | 26 (3.1%) | 21 (2.5%) | 34 (4.1%) | |
| Treated DM | 82 (5.0%) | 45 (5.5%) | 68 (8.1%) | 94 (11.3%) | 167 (20.0%) | |
| BMI (kg/m2) | 27.4 (5.2) | 27.5 (4.8) | 27.7 (4.9) | 28.2 (4.8) | 28.3 (4.8) | <.001 |
| Smoking | ||||||
| Never | 928 (56.5%) | 424 (51.5%) | 435 (51.7%) | 397 (47.7%) | 373 (44.8%) | <.001 |
| Former | 497 (30.3%) | 288 (35.0%) | 300 (35.6%) | 342 (41.1%) | 355 (42.7%) | |
| Current | 217 (13.2%) | 111 (13.5%) | 107 (12.7%) | 94 (11.3%) | 104 (12.5%) | |
| eGFR(CKD-Epi) | 84.3 (14.0) | 80.1 (14.5) | 77.6 (14.5) | 74.0 (14.5) | 69.9 (18.6) | <.001 |
| eGFR <60 mL/min/1.73m2 | 57 (3.5%) | 64 (7.8%) | 96 (11.4%) | 144 (17.3%) | 246 (29.5%) | <.001 |
| LDL-C (mg/dL) | 117.7 (31.0) | 116.9 (31.8) | 119.4 (31.1) | 1117.5 (30.4) | 113.6 (31.9) | .03 |
| HDL-C (mg/dL) | 53.1 (14.8) | 51.7 (15.7) | 51.2 (15.2) | 49.6 (14.0) | 48.6 (14.9) | <.001 |
| NT-proBNP (pg/mL) | 44.5 [20.4–79.6] | 43.3 [19.5–87.4] | 47.9 [21.2–94.9] | 55.9 [24.5– 13.4] | 84.2 [39.7–202.3] | <.001 |
| Very Good or Excellent Self-reported health | 880 (53.5%) | 427 (51.8%) | 399 (47.3%) | 413 (49.3%) | 382 (45.7%) | .001 |
| Medications: | ||||||
| Beta-blocker | 108 (6.6%) | 69 (8.4%) | 75 (8.9%) | 86 (10.3%) | 115 (13.8%) | <.001 |
| Diuretic | 108 (6.6%) | 107 (13.0%) | 94 (11.2%) | 127 (15.2%) | 173 (20.7%) | <.001 |
| ACEI or ARB | 143 (8.7%) | 96 (11.6%) | 139 (16.5%) | 151 (18.0%) | 221 (26.4%) | <.001 |
SBP: Systolic blood pressure; DBP: Diastolic blood pressure; IFG: Impaired fasting glucose; BMI: Body mass index; eGFR: Estimated Glomerular filtration rate
To better understand the influence of age on hs-cTnT, we plotted lowess-estimated medians by age separately by sex and contrasted this with NT-proBNP, the other cardiac specific biomarker measured in the cohort (figures 1a and 1b for males and females respectively). In men, there is predominantly a linear rise in hs-cTnT with advancing age with about a 4-fold increase from the late 40’s to the mid 80’s, in contrast to NT-proBNP which changes minimally until the mid-60’s, with a sharp inflection and steep rise over the next 20 years of life. For women, the pattern is different. hs-cTnT levels are lower than in men and gradually increase with a rate of rise then continues to increase over 40 years.
Figure 1.

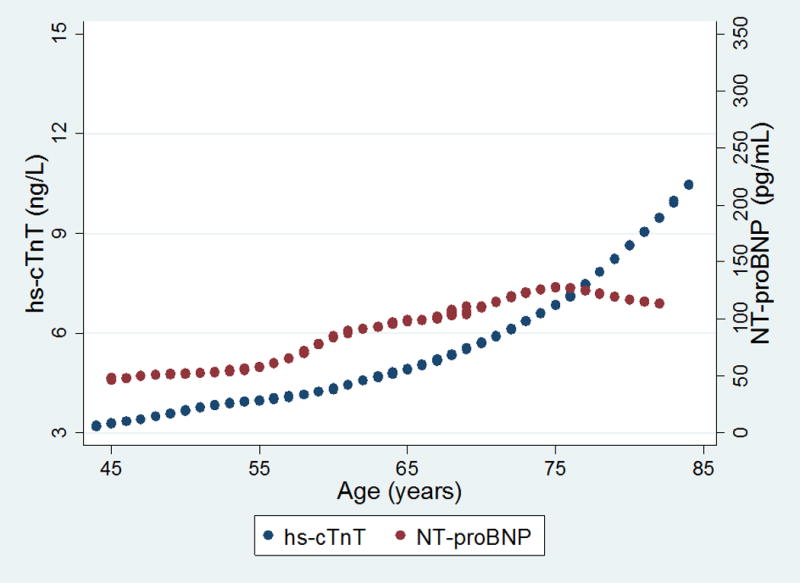
Relationship between hs-cTnT and NT-proBNP with age among (a) males and (b) females. Circles represent lowess-smoothed values of either NT-proBNP (blue) or hs-cTnT (maroon) as a function of age. The y-axis origin for hs-cTnT terminates at 3 ng/L as this is the lowest level of detection for this assay. Levels below detection were imputed at 2.99 ng/L.
Lastly, we compared participants who did not have a CMR exam to those who did. Participants without CMR were older, had a greater prevalence of traditional risk factors, poorer self-reported health and modestly higher hs-cTnT and NT-proBNP values (supplemental table 2).
hs-cTnT and CMR determined left ventricular structure and function
Cross-sectional associations of hs-cTnT with subclinical CVD
Progressively higher hs-cTnT concentrations were associated with greater LV mass and a higher prevalence of LVH for both men and women (table 2). These trends remained significant after adjustment for demographics, traditional CVD risk factors, and renal function, with a more than 5-fold greater odds of LVH among those in the highest category of hs-cTnT (OR=5.23, 95% CI: 3.67, 7.46; supplemental table 3). Baseline LVEDV did not differ for either sex across categories of hs-cTnT. Mean LVEF was minimally but significantly lower across higher hs-cTnT for males but not for females; however, the prevalence of an abnormal LVEF (<50%) was notably higher across progressively higher hs-cTnT categories for both sexes (table 2). After adjustment for demographics, CV risk factors, and eGFR, those in the highest category of hs-cTnT were markedly more likely to have low LVEF compared to those with hs-cTnT below the LOD (OR=2.97; 95% CI: 1.68, 5.24), with a linear relation of ln(hs-cnT) and abnormal LVEF (supplemental table 4).
Table 2.
Cardiac Magnetic Resonance measures of subclinical CVD at baseline, by hs-cTnT category
| Subclinical CVD Measure | <LOD | 3.0–4.25 ng/L | 4.26–5.87ng/L | 5.88–8.80 ng/L | ≥8.81 ng/L | test for trend | |
|---|---|---|---|---|---|---|---|
| LVM (g) | Males | 130.5 (22.1) | 132.4 (24.4) | 135.9 (24.6) | 138.9 (25.4) | 148.3 (33.6) | <.001 |
| Females | 101.3 (18.3) | 103.5 (18.8) | 105.0 (20.2 | 108.2 (21.9) | 115.3 (28.1) | <.001 | |
| LVH Prevalence | Males | 13 (3.0%) | 23 (6.3%) | 30 (6.9%) | 32 (6.1%) | 110 (18.2%) | <.001 |
| Females | 85 (7.1%) | 51 (11.1%) | 49 (12.0%) | 47 (15.3%) | 64 (27.7%) | <.001 | |
| LVEDV (mL) | Males | 140.0 (26.2) | 142.1 (29.0) | 142.0 (29.9) | 143.0 (31.0) | 142.6 (35.9) | 0.2 |
| Females | 116.4 (22.3) | 117.9 (23.4) | 115.3 (23.3) | 117.1 (24.7) | 117.0 (27.8) | 0.9 | |
| LVEF (%) | Males | 61.0 (5.6) | 61.9 (5.9) | 61.5 (5.8) | 61.0 (6.2) | 60.4 (7.7) | .006 |
| Females | 63.5 (5.2) | 63.9 (6.0) | 63.8 (5.5) | 63.9 (6.0) | 63.0 (6.7) | 0.2 | |
| LVEF<50% | Males | 15 (3.4%) | 12 (3.3%) | 14 (3.2%) | 24 (4.5%) | 51 (8.4%) | <.001 |
| Females | 14 (1.2%) | 6 (1.3%) | 7 (1.7%) | 8 (2.6%) | 10 (4.3%) | <.001 |
Values are mean (standard deviation) and N (%).
hs-cTnT and longitudinal changes in CMR-defined LV structure and function
There were 2831 participants with CMR exams at Exam 1 and 5, available plasma for hs-cTnT measurement and without intervening CHD or HF events; among these, 668 (23.5%) had >12% increase in LVM from baseline to follow-up CMR, 387 (13.7%) with >8% increase in EDV, and 570 (20.1%) with a relative decline in EF>10%. The proportion with increased LVM was greater among those with higher baseline hs-cTnT (table 3). After adjustment for baseline LVM, demographics, and traditional CVD risk factors, those in the highest hs-cTnT category were more likely to have a >12% increase in LV mass compared to participants with undetectable levels (OR=1.50, 95% CI: 1.09, 2.07; table 3). The proportion of participants with an LVEDV increase of > 8% was also greater with higher categories of hs-cTnT levels, after adjustment for baseline LVEDV and CVD risk factors (p=.006 for trend across hs-cTnT categories, Table 3). In contrast, for a decline in LVEF > 8%, there was no significant association with higher baseline hs-cTnT categories after covariate adjustment (table 3). When examined as continuous measures of longitudinal LV changes (defined as follow-up measures adjusted for baseline), there were modest though significant adjusted associations of greater hs-cTnT with greater follow-up LVM and LVEDV, but associations with lower LVEF were not significant after adjustment for CV risk factors (supplemental table 5). Lastly, among 4290 participants with baseline and follow-up (Exam 3) NT-proBNP levels and who remained free of CHD and HF, the incidence of an increase in NT-proBNP > 25% to > 80 pg.ml ranged from 18% for participants with hs-cTnT levels below the LOD to 37% for those with hs-cTnT levels in in the 5th category (supplemental figure 1). These associations remained significant after adjustment for baseline NT-proBNP and CV risk factors (supplemental table 6).
Table 3.
Association of baseline hs-cTnT with odds of significant change in cardiac structure and function*
| Subclinical CVD Measure | LV Mass | LV End-Diastolic Volume | LV Ejection Fraction | |||
|---|---|---|---|---|---|---|
| Unadjusted | + Risk factors | Unadjusted | + Risk factors | Unadjusted | + Risk Factors | |
| hs-cTnT category (ng/L)† | ||||||
| <LOD | Reference | Reference | Reference | Reference | Reference | Reference |
| 3.0–4.05 | 1.22 (0.996, 1.49) |
1.25 (0.94, 1.66) |
0.69 (0.47, 1.02) |
0.68 (0.44, 1.03) |
1.11 (0.84, 1.48) |
0.90 (0.67, 1.23) |
| 4.06–5.42 | 1.06 (0.86, 1.31) |
0.86 (0.63, 1.16) |
1.29 (0.93, 1.79) |
1.17 (0.81, 1.70) |
1.04 (0.78, 1.38) |
0.86 (0.63, 1.18) |
| 5.43–7.67 | 1.28 (1.05, 1.55) |
1.24 (0.92, 1.68) |
1.69 (1.25, 2.30) |
1.65 (1.14, 2.39) |
1.51 (1.15, 1.97) |
1.21 (0.88, 1.65) |
| ≥7.68 | 1.59 (1.33, 1.90) |
1.50 (1.09, 2.07) |
1.89 (1.40, 2.55) |
1.39 (0.93, 2.05) |
1.52 (1.16, 1.98) |
1.06 (0.76, 1.48) |
| Test for trend | p<.001 | p=.04 | p<.001 | p=.006 | p<.001 | p=0.4 |
| ln(hs-cTnT) | 1.17 (1.05, 1.32) |
1.16 (1.00, 1.34) |
1.38 (1.20, 1.59) |
1.19 (0.99, 1.43) |
1.21 (1.08, 1.37) |
1.03 (0.88, 1.19) |
Significant changes defined as: 1) >12% increase in LV mass; 2) >8% increase in LVEDV; 3) >10% relative decline in LVEF;
Categories based on distribution of hs-cTnT among subjects with both baseline and follow-up CMR.
Cell values represent Odds Ratios and respective 95% CIs.
Risk factors: Age, gender, race, SBP, DBP, anti-hypertensive medications, diabetes, smoking, lipids levels, height, weight, estimated GFR, and baseline CMR measure.
Association of hs-cTnT with LGE
LGE was identified in 113 (6.3%) of 1753 participants with gadolinium-enhanced CMR at exam 5 who were also without an interim CVD event prior to the exam. LGE pattern distribution were classified as ‘typical’ and likely due to ischemia in 38 (33.6%) of these participants, while 75 (66.4%) participants were classified as ‘atypical’ scar and likely not due to coronary artery disease. The prevalence of participants with LGE is shown for the entire cohort in figure 2 and by sex across progressive baseline hs-cTnT categories for males and females in supplemental figures 2a and 2b respectively. Overall, the proportion with LGE is as low as 1% for women with hs-cTnT below the LOD to 17% percent for men with hs-cTnT levels in the highest category. The majority of LGE scar types was classified as atypical in all hs-cTnT categories and did not differ across such categories. The odds of LGE scar among participants in the highest category of hs-cTnT were nearly 2.5 times as great as those with undetectable hs-cTnT, after adjustment for demographics, CVD risk factors, eGFR, LVH, and LVEF (OR: 2.41, 95% CI: 1.15–5.06) respectively (table 4). There was also a significant linear relationship between hs-cTnT level and odds of LGE scar (table 4).
Figure 2.

Frequency and subtype of left ventricular scar, by hs-cTnT category
Table 4.
Association between baseline hs-cTnT and myocardial scar at follow-up, among those with gadolinium-enhanced CMR at follow-up (N=1723)
| hs-cTnT category (ng/L)* | Unadjusted | Age, sex, race | + risk factors†, LV mass, and LVEF |
|---|---|---|---|
| <LOD | Reference | Reference | Reference |
| 3.0–3.97 | 1.68 (0.75, 3.77) | 1.31 (0.57, 3.02) | 1.29 (0.54, 3.09) |
| 3.98–5.32 | 2.67 (1.30, 5.48) | 1.86 (0.88, 3.95) | 1.77 (0.80, 3.88) |
| 5.33–7.41 | 5.34 (2.85, 10.02) | 3.31 (1.68, 6.54) | 2.49 (1.20, 5.15) |
| ≥7.42 | 6.68 (3.63, 12.28) | 3.26 (1.63, 6.51) | 2.41 (1.15, 5.06) |
| Test for trend | <.001 | <.001 | .007 |
| ln(hs-cTnT) | 2.77 (2.11, 3.63) | 1.87 (1.38, 2.54) | 1.57 (1.12, 2.17) |
Categories based on distribution of hs-cTnT among those with gadolinium-enhanced-CMR at visit 5
SBP, DBP, anti-hypertensive medications, diabetes (normal/DM), smoking, lipids, height, weight, and estimated GFR.
Cell Values represent Odds Ratios and 95% CI
Association of hs-cTnT with incident HF, CHD events and CV-death
Participants with baseline CMR and hs-cTnT measurements were followed for a median of 12.2 years with a total of 177 definite or probable incident HF events, 234 CHD events, and 141 CV deaths. Cumulative hazard curves are shown for incident HF, CHD and CV death in figure 3 and supplemental figures 3 and 4, respectively. For each event type, progressively higher levels of hs-cTnT were associated with a greater risk of each event. For incident HF, the unadjusted hazard ratio for those in the highest category of hs-cTnT versus those <LOD was 14.13 (95%CI 8.18–24.42); risk-factor adjustment diminished these associations moderately, but they remained significant, and even after additional adjustment for LVM, LVEF and NT-proBNP (table 5). Associations were very similar after excluding patients with LVH or abnormal LVEF at baseline (per 1-ln increase in hs-cTnT, adjusted HR=2.01, 95%CI: 1.52–2.76). Similar associations were present for CHD events, though with weaker associations compared to incident HF and CV death (supplemental table 7).
Figure 3.
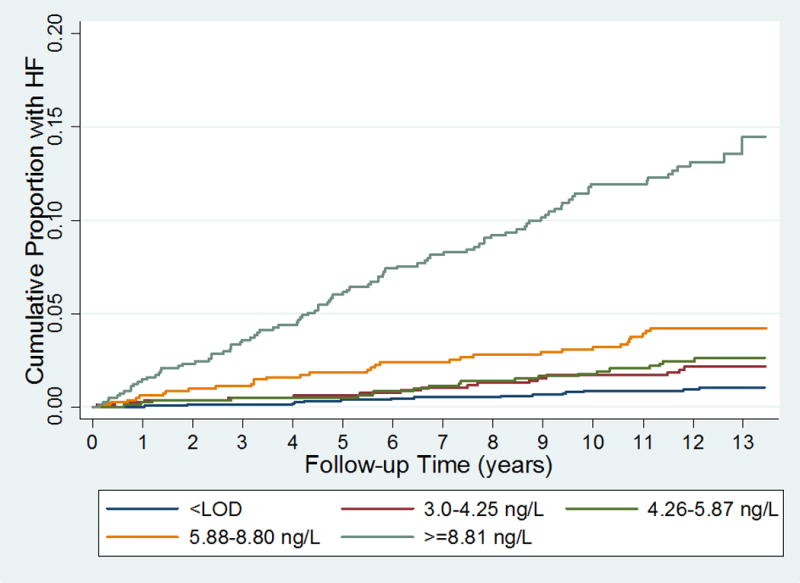
Cumulative Incidence of heart failure, by hs-cTnT category
Table 5.
Association of hs-cTnT with incident HF
| Categories of hs-cTnT (ng/L) | Event Rate (/1000 p-yrs) | Unadjusted Hazard Ratios | Demographic adjusted | + risk factors* | + LVM & LVEF | +NT-proBNP |
|---|---|---|---|---|---|---|
| <LOD | Reference | Reference | Reference | Reference | Reference | |
| 3.0–4.25 | 0.8 (0.5, 1.3) | 1.72 (0.82, 3.61) |
1.32 (0.62, 2.79) |
1.75 (0.85, 3.62) |
1.60 (0.78, 3.30) |
1.60 (0.77, 3.29) |
| 4.26–5.87 | 1.7 (1.0, 2.8) | 2.61 (1.34, 5.10) |
1.75 (0.88, 3.47) |
1.74 (0.86, 3.50) |
1.53 (0.76, 3.10) |
1.57 (0.77, 3.17) |
| 5.88–8.80 | 2.1 (1.3, 3.2) | 5.38 (2.96, 9.75) |
2.98 (1.60, 5.58) |
2.27 (1.18, 4.44) |
1.75 (0.90, 3.42) |
1.70 (0.87, 3.34) |
| ≥8.81 | 11.7 (9.6, 14.3) |
14.13 (8.18, 24.4) |
6.45 (3.54, 11.79) |
5.59 (2.97, 10.68) |
3.47 (1.80, 6.68) |
2.93 (1.50, 5.67) |
| Test for trend | <.001 | <.001 | <.001 | <.001 | <.001 | .001 |
| ln(hs-cTnT) | N/A | 3.12 (2.69, 3.63) |
2.59 (2.15, 3.13) |
2.35 (2.00, 2.78) |
1.88 (1.50, 2.35) |
1.55 (1.23, 1.95) |
Risk factors: SBP, DBP, anti-hypertensive medications, diabetes (normal/DM), smoking, lipids, height, weight, and estimated GFR.
Cell values represent Hazard Ratios (95% CI).
DISCUSSION
Our results from the MESA cohort, incorporating a high sensitivity assay for cTnT, and using repeated CMR with LGE, provide several novel insights regarding the mechanisms of chronic cardiac injury in the general population. First, baseline levels of hs-cTnT are strongly associated with longitudinal changes in LV structure consistent with early adverse remodeling, represented by a measurable increase in LV mass and end-diastolic volume by CMR, as well as increased hemodynamic strain represented by a rise in NT-proBNP. This latter finding is also supported by the observation that cTnT is initially elevated at a younger age compared to NT-proBNP, particularly in men. Progressive remodeling of LV structure associated with higher hs-cTnT levels occurred in the absence of intervening cardiovascular events and independent of initial LV mass, LVEDV, and NT-proBNP. Second, unique to this study is the strong association of biochemical evidence of myocyte injury with subsequent imaging evidence of replacement fibrosis in the form of CMR LGE. LGE has consistently been associated with a poor outcome in multiple cardiovascular diseases as well as diabetics and older adult general populations.25–27 Consistent with a probable non-ischemic etiology to account for measurable hs-cTnT, there is no trend in the pattern of “ischemic”-type LGE with higher levels of hs-cTnT. Despite these consistent associations of greater baseline hs-cTnT with replacement fibrosis, measurable progression of LV mass and LVEDV by CMR, and early rise in NT-proBNP, we noted no relationship with longitudinal decline of systolic function as reflected by LVEF. This lack of association is all the more remarkable in that a decreased LVEF is the one structural indication for treatment of asymptomatic patients to prevent HF, though it represents an insensitive and late manifestation in the progression of sub-clinical disease.8, 28 Our results support the hypothesis that - at least in the 10 years of follow-up in these MESA participants free of symptomatic cardiac disease – biochemical evidence of subclinical myocardial injury is a greater marker for increasing LV mass and LV dilatation than for declining systolic function. Alternatively, those with long-term decline in LVEF may have been more likely to progress to symptomatic heart failure and thus were excluded from our analysis of subclinical changes in LV function.
Our findings also confirm cross-sectional structural abnormalities on baseline CMR including increased LV mass and an abnormal LVEF with higher levels of hs-cTnT.11, 12 However, in light of the novel findings here that hs-cTnT levels associate with progression of structural abnormalities independent of the initial exam 1 CMR findings, cross sectional imaging abnormalities could now be interpreted as relatively late pre-clinical findings in the course of cardiovascular disease. Finally, we found strong associations of even very minor elevations of hs-cTnT with an independent risk for incident HF, CHD events and cardiovascular death, for the first time demonstrating that these associations persist after accounting for CMR measurements of LV structure and function. Accounting for these measures in a multivariate model for outcomes supports the hypothesis that hs-cTnT levels provides a unique biochemical signature that is independent of even the most precise measures of cardiac structure.
LGE measured by CMR can be indicative of a prior myocardial infarction, but is also present in many non-ischemic heart diseases.29 LGE has been reported in nearly two thirds of patients with severe aortic stenosis and half of patients with hypertension with left ventricular hypertrophy.30 LGE is typically associated with myocyte cell loss and replacement fibrosis.29 Its presence is also associated with a poor prognosis.25 In older Icelandic community-dwelling adults, an LGE pattern most consistent with an MI was found in 17% who had no prior history of an MI and was associated with a worse prognosis compared to those without LGE.27 More recently, in the MESA study, unrecognized scar was reported in 6.2% of participants of whom 62% were classified as “atypical” for myocardial infarction.18 The prevalence of scar in the current study was slightly different from the prior publication as individuals with an incident HF event prior to exam 5 were excluded in the present analysis. The lower prevalence of LGE, and particularly “typical” scar compared with prior non-MESA general population studies is likely based on the initial exclusion in MESA of known CVD, the race/ethnic heterogeneity of the cohort (with whites having the highest prevalence of LGE) and younger age of MESA participants. A prior study of older adults did not find an association between troponin and LGE, but this study focused only on subendocardial ischemic LGE patterns and did not utilize a high sensitive troponin assay.31 Studies measuring hs-cTn in symptomatic non-ischemic heart disease populations including non-ischemic cardiomyopathy, hypertrophic cardiomyopathy and severe aortic stenosis, all identified significant associations between the hs-cTn levels and the presence of LGE, most of which was “atypical” in location.32–34 We expand these findings by showing that hs-cTnT may represent a biomarker surrogate for early myocardial fibrosis in an asymptomatic lower-risk general population free of known cardiovascular disease.
By showing that hs-cTnT levels identify individuals at highest risk for adverse remodeling with changes still within the normal measurement range as well as progression to symptomatic disease and death, we identify that hs-cTnT levels represent a biochemical signature of subclinical cardiac disease that could be potentially used to target preventive interventions to at-risk individuals. Greater habitual physical activity has been associated with attenuation in the rise in hs-cTnT levels over follow-up, suggesting a potential preventive intervention.35 Furthermore, given the strong association of hs-cTnT with imaging evidence of fibrosis and the findings by others that hs-cTnI is also strongly associated with LGE in severe aortic stenosis34, trials with therapies targeting remodeling and fibrosis could also be considered as an early intervention to prevent progression to symptomatic HF based on hs-cTnT levels.
Limitations
There are several limitations of this study. Follow-up CMR was not available in approximately 40% of participants. In general, participants who did not complete CMR measures were older and less healthy than those who had a complete CMR. While the CMR technology was contemporaneous for its time during each MESA exam period, the sequences were different as technology improved, became faster, and more efficient. These differences required a correction factor in order to compare changes in measurements for longitudinal analyses and thereby would potentially result in small errors (addressed previously in prior MESA CMR analyses).17 There is no consensus on the degree of change in CMR-based measures of LV structure and function which identifies clinically important progression. We selected thresholds of change which were unlikely to represent measurement error only, but other thresholds may be more useful clinically. Only CMRs performed at Exam 5 used contrast enhancement to assess fibrosis, with only 1839 (61%) receiving gadolinium. LGE sequences, while excellent at detecting small scar/fibrosis, may miss scar < 1 gram. Additionally, due to the way LGE sequences are acquired and evaluated (scar is detected when compared to normal myocardium), it may miss diffuse myocardial fibrosis. Measures of LGE-defined replacement fibrosis were not contemporaneous with measures of cTnT. Lastly, nearly a third of the MESA cohort with CMR had an hs-cTnT level below the LOD. The assay system used is technically superior and provided hs-cTnT measurements that were ~2-fold more sensitive and precise that earlier versions of the hs-cTnT analyzer. Such a technical advantage translates into less misclassification of subjects with regards to hs-cTnT, but we were still unable to classify all subjects in this study with a measurable hs-cTnT level. Nevertheless, as a group those with hs-cTnT less than the LOD remained at very low risk for HF, CVD events or CV death.
Conclusions
Among adults without clinically overt CVD, higher hs-cTnT levels associate with myocardial pathology identified by CMR, and with pathological cardiac remodeling. Moreover, hs-cTnT identifies individuals with imaging evidence of non-ischemic replacement fibrosis. The association of measurable hs-cTnT with subsequent LV remodeling and progression to symptomatic HF and cardiovascular death suggests that hs-cTnT levels could biochemically define early subclinical cardiac disease. Moving forward, clinical studies of lifestyle changes or pharmacologic therapy may consider using hs-cTnT levels in middle age and older adults to identify those most likely to benefit from specific therapy to prevent remodeling and fibrosis.
Supplementary Material
CLINICAL PERSPECTIVE.
What Is New?
This is the first study demonstrating, in a contemporary multi-ethnic population free of known cardiovascular disease, that a mild elevation of high sensitive cardiac troponin T (hs-cTnT) identifies subjects at highest risk for an increase in left ventricular mass and end-diastolic volume over the next 10-years.
Higher hs-cTnT levels also associate with an increased incidence of replacement fibrosis, but with no differentiation between ischemic or non-ischemic fibrosis patterns.
hs-cTnT level remains an independent predictor for incident heart failure, coronary heart disease events and cardiovascular events, independent of underlying LVH or ejection fraction.
What are the clinical Implications?
Subtle biochemical evidence of myocyte injury precedes imaging evidence of increasing LV mass and dilation, replacement fibrosis and clinical cardiovascular events.
Myocyte injury, measured with a high sensitive cardiac specific troponin assay, may ultimately be an important early signal used to target therapy to prevent or delay left ventricular remodeling and progression to heart failure symptoms and death.
Acknowledgments
The authors thank the other investigators, the staff, and the participants of the MESA study for their valuable contributions. A full list of participating MESA investigators and institutions can be found at http://www.mesa-nhlbi.org.
SOURCES OF FUNDING
This research was supported by contracts HHSN268201500003I, N01-HC-95159, N01-HC-95160, N01-HC-95161, N01-HC-95162, N01-HC-95163, N01-HC-95164, N01-HC-95165, N01-HC-95166, N01-HC-95167, N01-HC-95168 and N01-HC-95169 from the National Heart, Lung, and Blood Institute and by grants UL1-TR-000040 and UL1-TR-001079 from the National Center for Research Resources. Roche Diagnostics supported the measurement of hs-cTnT and additional NT-proBNP through an investigator initiated grant (PI: deFilippi).
Footnotes
CONFLICT OF INTEREST DISCLOSURES
Christopher deFilippi receives grant support from Roche Diagnostics and Abbott Diagnostics, consulting for Roche Diagnostics, Siemens Healthcare Diagnostics and Ortho Diagnostics Stephen Seliger has received grant support from Roche Diagnostics.
James de Lemos has received grant support and consulting income from Roche Diagnostics and Abbott Diagnostics.
Susie Hong has received research support from Roche Diagnostics.
Robert Christenson has received research support and consulting income from from Roche Diagnostics; consulting income from Siemens Diagnostics, BD Life Sciences and Phillips; and has served on speakers bureaus for Roche Diagnostics and Siemens Diagnostics
Lori Daniels has received research support from Siemens Healthcare; consulting income from diaDexus; and has served on speakers bureau for Roche Diagnostics
Alain Bertoni reports none
References
- 1.Lopez AD, Mathers CD, Ezzati M, Jamison DT, Murray CJ. Global and regional burden of disease and risk factors, 2001: systematic analysis of population health data. Lancet. 2006;367:1747–1757. doi: 10.1016/S0140-6736(06)68770-9. [DOI] [PubMed] [Google Scholar]
- 2.Celermajer DS, Chow CK, Marijon E, Anstey NM, Woo KS. Cardiovascular disease in the developing world: prevalences, patterns, and the potential of early disease detection. J Am Coll Cardiol. 2012;60:1207–1216. doi: 10.1016/j.jacc.2012.03.074. [DOI] [PubMed] [Google Scholar]
- 3.Mozaffarian D, Benjamin EJ, Go AS, Arnett DK, Blaha MJ, Cushman M, Das SR, de Ferranti S, Després J-P, Fullerton HJ, Howard VJ, Huffman MD, Isasi CR, Jiménez MC, Judd SE, Kissela BM, Lichtman JH, Lisabeth LD, Liu S, Mackey RH, Magid DJ, McGuire DK, Mohler ER, Moy CS, Muntner P, Mussolino ME, Nasir K, Neumar RW, Nichol G, Palaniappan L, Pandey DK, Reeves MJ, Rodriguez CJ, Rosamond W, Sorlie PD, Stein J, Towfighi A, Turan TN, Virani SS, Woo D, Yeh RW, Turner MB. Heart Disease and Stroke Statistics—2016 Update: A Report From the American Heart Association. Circulation. 2016;133:e38–e360. doi: 10.1161/CIR.0000000000000350. [DOI] [PubMed] [Google Scholar]
- 4.Dunlay SM, Redfield MM, Weston SA, Therneau TM, Hall Long K, Shah ND, Roger VL. Hospitalizations after heart failure diagnosis a community perspective. J Am Coll Cardiol. 2009;54:1695–1702. doi: 10.1016/j.jacc.2009.08.019. [DOI] [PMC free article] [PubMed] [Google Scholar]
- 5.Heidenreich PA, Albert NM, Allen LA, Bluemke DA, Butler J, Fonarow GC, Ikonomidis JS, Khavjou O, Konstam MA, Maddox TM, Nichol G, Pham M, Pina IL, Trogdon JG. Forecasting the impact of heart failure in the United States: a policy statement from the American Heart Association. Circ Heart Fail. 2013;6:606–619. doi: 10.1161/HHF.0b013e318291329a. [DOI] [PMC free article] [PubMed] [Google Scholar]
- 6.Hunt SA, Abraham WT, Chin MH, Feldman AM, Francis GS, Ganiats TG, Jessup M, Konstam MA, Mancini DM, Michl K, Oates JA, Rahko PS, Silver MA, Stevenson LW, Yancy CW, Antman EM, Smith SC, Jr, Adams CD, Anderson JL, Faxon DP, Fuster V, Halperin JL, Hiratzka LF, Jacobs AK, Nishimura R, Ornato JP, Page RL, Riegel B. ACC/AHA 2005 Guideline Update for the Diagnosis and Management of Chronic Heart Failure in the Adult: a report of the American College of Cardiology/American Heart Association Task Force on Practice Guidelines (Writing Committee to Update the 2001 Guidelines for the Evaluation and Management of Heart Failure): developed in collaboration with the American College of Chest Physicians and the International Society for Heart and Lung Transplantation: endorsed by the Heart Rhythm Society. Circulation. 2005;112:e154–235. doi: 10.1161/CIRCULATIONAHA.105.167586. [DOI] [PubMed] [Google Scholar]
- 7.Ammar KA, Jacobsen SJ, Mahoney DW, Kors JA, Redfield MM, Burnett JC, Rodeheffer RJ. Prevalence and Prognostic Significance of Heart Failure Stages: Application of the American College of Cardiology/American Heart Association Heart Failure Staging Criteria in the Community. Circulation. 2007;115:1563–1570. doi: 10.1161/CIRCULATIONAHA.106.666818. [DOI] [PubMed] [Google Scholar]
- 8.Effect of enalapril on mortality and the development of heart failure in asymptomatic patients with reduced left ventricular ejection fractions. The SOLVD Investigattors. N Engl J Med. 1992;327:685–691. doi: 10.1056/NEJM199209033271003. [DOI] [PubMed] [Google Scholar]
- 9.McKie PM, AbouEzzeddine OF, Scott CG, Mehta R, Rodeheffer RJ, Redfield MM, Burnett JC, Jr, Jaffe AS. High-sensitivity troponin I and amino-terminal pro–B-type natriuretic peptide predict heart failure and mortality in the general population. Clin Chem. 2014;60:1225–1233. doi: 10.1373/clinchem.2014.222778. [DOI] [PMC free article] [PubMed] [Google Scholar]
- 10.Saunders JT, Nambi V, de Lemos JA, Chambless LE, Virani SS, Boerwinkle E, Hoogeveen RC, Liu X, Astor BC, Mosley TH, Folsom AR, Heiss G, Coresh J, Ballantyne CM. Cardiac troponin T measured by a highly sensitive assay predicts coronary heart disease, heart failure, and mortality in the Atherosclerosis Risk in Communities Study. Circulation. 2011;123:1367–1376. doi: 10.1161/CIRCULATIONAHA.110.005264. [DOI] [PMC free article] [PubMed] [Google Scholar]
- 11.deFilippi CR, de Lemos JA, Christenson RH, Gottdiener JS, Kop WJ, Zhan M, Seliger SL. Association of Serial Measures of Cardiac Troponin T Using a Sensitive Assay With Incident Heart Failure and Cardiovascular Mortality in Older Adults. JAMA. 2010;304:2494–2502. doi: 10.1001/jama.2010.1708. [DOI] [PMC free article] [PubMed] [Google Scholar]
- 12.de Lemos JA, Drazner MH, Omland T, Ayers CR, Khera A, Rohatgi A, Hashim I, Berry JD, Das SR, Morrow DA, McGuire DK. Association of troponin T detected with a highly sensitive assay and cardiac structure and mortality risk in the general population. JAMA. 2010;304:2503–2512. doi: 10.1001/jama.2010.1768. [DOI] [PMC free article] [PubMed] [Google Scholar]
- 13.Parikh RH, Seliger SL, de Lemos J, Nambi V, Christenson R, Ayers C, Sun W, Gottdiener JS, Kuller LH, Ballantyne C, deFilippi CR. Prognostic Significance of High-Sensitivity Cardiac Troponin T Concentrations between the Limit of Blank and Limit of Detection in Community-Dwelling Adults: A Metaanalysis. Clin Chem. 2015;61:1524–1531. doi: 10.1373/clinchem.2015.244160. [DOI] [PubMed] [Google Scholar]
- 14.Bild DE, Bluemke DA, Burke GL, Detrano R, Diez Roux AV, Folsom AR, Greenland P, Jacob DR, Jr, Kronmal R, Liu K, Nelson JC, O’Leary D, Saad MF, Shea S, Szklo M, Tracy RP. Multi-Ethnic Study of Atherosclerosis: objectives and design. Am J Epidemiol. 2002;156:871–881. doi: 10.1093/aje/kwf113. [DOI] [PubMed] [Google Scholar]
- 15.Choi EY, Bahrami H, Wu CO, Greenland P, Cushman M, Daniels LB, Almeida AL, Yoneyama K, Opdahl A, Jain A, Criqui MH, Siscovick D, Darwin C, Maisel A, Bluemke DA, Lima JA. N-terminal pro-B-type natriuretic peptide, left ventricular mass, and incident heart failure: Multi-Ethnic Study of Atherosclerosis. Circ Heart Fail. 2012;5:727–734. doi: 10.1161/CIRCHEARTFAILURE.112.968701. [DOI] [PMC free article] [PubMed] [Google Scholar]
- 16.Natori S, Lai S, Finn JP, Gomes AS, Hundley WG, Jerosch-Herold M, Pearson G, Sinha S, Arai A, Lima JA, Bluemke DA. Cardiovascular function in multi-ethnic study of atherosclerosis: normal values by age, sex, and ethnicity. AJR Am J Roentgenol. 2006;186:S357–S365. doi: 10.2214/AJR.04.1868. [DOI] [PubMed] [Google Scholar]
- 17.Ambale VB, Volpe GJ, Donekal S, Mewton N, Liu CY, Shea S, Liu K, Burke G, Wu C, Bluemke DA, Lima JA. Association of longitudinal changes in left ventricular structure and function with myocardial fibrosis: the Multi-Ethnic Study of Atherosclerosis study. Hypertension. 2014;64:508–515. doi: 10.1161/HYPERTENSIONAHA.114.03697. [DOI] [PMC free article] [PubMed] [Google Scholar]
- 18.Turkbey EB, Nacif MS, Guo M, McClelland RL, Teixeira PB, Bild DE, Barr RG, Shea S, Post W, Burke G, Budoff MJ, Folsom AR, Liu CY, Lima JA, Bluemke DA. Prevalence and Correlates of Myocardial Scar in a US Cohort. JAMA. 2015;314:1945–1954. doi: 10.1001/jama.2015.14849. [DOI] [PMC free article] [PubMed] [Google Scholar]
- 19.Folsom AR, Kronmal RA, Detrano RC, O’Leary DH, Bild DE, Bluemke DA, Budoff MJ, Liu K, Shea S, Szklo M, Tracy RP, Watson KE, Burke GL. Coronary artery calcification compared with carotid intima-media thickness in the prediction of cardiovascular disease incidence: The multi-ethnic study of atherosclerosis (MESA) Arch Int Med. 2008;168:1333–1339. doi: 10.1001/archinte.168.12.1333. [DOI] [PMC free article] [PubMed] [Google Scholar]
- 20.Levey AS, Stevens LA, Schmid CH, Zhang YL, Castro AF, 3rd, Feldman HI, Kusek JW, Eggers P, Van Lente F, Greene T, Coresh J, CKD-EPI (Chronic Kidney Disease Epidemiology Collaboration) A new equation to estimate glomerular filtration rate. Ann Intern Med. 2009;150:604–612. doi: 10.7326/0003-4819-150-9-200905050-00006. [DOI] [PMC free article] [PubMed] [Google Scholar]
- 21.Cuzick J. A Wilcoxon-type test for trend. Statistics in medicine. 1985;4:87–90. doi: 10.1002/sim.4780040112. [DOI] [PubMed] [Google Scholar]
- 22.Cleveland WS. Robust locally weighted regression and smoothing scatterplots. J Am Stat Assoc. 1979;74:829–836. [Google Scholar]
- 23.Moran A, Katz R, Jenny NS, Astor B, Bluemke DA, Lima JA, Siscovick D, Bertoni AG, Shlipak MG. Left ventricular hypertrophy in mild and moderate reduction in kidney function determined using cardiac magnetic resonance imaging and cystatin C: the multi-ethnic study of atherosclerosis (MESA) Am J Kidney Dis. 2008;52:839–848. doi: 10.1053/j.ajkd.2008.06.012. [DOI] [PMC free article] [PubMed] [Google Scholar]
- 24.Daniels LB, Clopton P, deFilippi CR, Sanchez OA, Bahrami H, Lima JA, Tracy RP, Siscovick D, Bertoni AG, Greenland P, Cushman M, Maisel AS, Criqui MH. Serial measurement of N-terminal pro-B-type natriuretic peptide and cardiac troponin T for cardiovascular disease risk assessment in the Multi-Ethnic Study of Atherosclerosis (MESA) Am Heart J. 2015;170:1170–1183. doi: 10.1016/j.ahj.2015.09.010. [DOI] [PMC free article] [PubMed] [Google Scholar]
- 25.Mewton N, Liu CY, Croisille P, Bluemke D, Lima JA. Assessment of myocardial fibrosis with cardiovascular magnetic resonance. J Am Coll Cardiol. 2011;57:891–903. doi: 10.1016/j.jacc.2010.11.013. [DOI] [PMC free article] [PubMed] [Google Scholar]
- 26.Kwong RY, Sattar H, Wu H, Vorobiof G, Gandla V, Steel K, Siu S, Brown KA. Incidence and prognostic implication of unrecognized myocardial scar characterized by cardiac magnetic resonance in diabetic patients without clinical evidence of myocardial infarction. Circulation. 2008;118:1011–1020. doi: 10.1161/CIRCULATIONAHA.107.727826. [DOI] [PMC free article] [PubMed] [Google Scholar]
- 27.Schelbert EB, Cao JJ, Sigurdsson S, Aspelund T, Kellman P, Aletras AH, Dyke CK, Thorgeirsson G, Eiriksdottir G, Launer LJ, Gudnason V, Harris TB, Arai AE. Prevalence and prognosis of unrecognized myocardial infarction determined by cardiac magnetic resonance in older adults. JAMA. 2012;308:890–896. doi: 10.1001/2012.jama.11089. [DOI] [PMC free article] [PubMed] [Google Scholar]
- 28.Yancy CW, Jessup M, Bozkurt B, Butler J, Casey DE, Jr, Drazner MH, Fonarow GC, Geraci SA, Horwich T, Januzzi JL, Johnson MR, Kasper EK, Levy WC, Masoudi FA, McBride PE, McMurray JJ, Mitchell JE, Peterson PN, Riegel B, Sam F, Stevenson LW, Tang WH, Tsai EJ, Wilkoff BL. 2013 ACCF/AHA guideline for the management of heart failure: a report of the American College of Cardiology Foundation/American Heart Association Task Force on practice guidelines. Circulation. 2013;128:e240–319. doi: 10.1161/CIR.0b013e31829e8776. [DOI] [PubMed] [Google Scholar]
- 29.Ambale-Venkatesh B, Lima JA. Cardiac MRI: a central prognostic tool in myocardial fibrosis. Nature reviews Cardiology. 2015;12:18–29. doi: 10.1038/nrcardio.2014.159. [DOI] [PubMed] [Google Scholar]
- 30.Rudolph A, Abdel-Aty H, Bohl S, Boye P, Zagrosek A, Dietz R, Schulz-Menger J. Noninvasive detection of fibrosis applying contrast-enhanced cardiac magnetic resonance in different forms of left ventricular hypertrophy relation to remodeling. J Am Coll Cardiol. 2009;53:284–291. doi: 10.1016/j.jacc.2008.08.064. [DOI] [PubMed] [Google Scholar]
- 31.Themudo RE, Lindahl B, Johansson L, Venge P, Ahlstrom H, Ebeling Barbier C, Eggers KM, Lind L, Bjerner T. Unrecognized myocardial scars detected by delayed-enhanced MRI are associated with increased levels of NT-proBNP. Coronary artery disease. 2011;22:158–164. doi: 10.1097/MCA.0b013e328342c72e. [DOI] [PubMed] [Google Scholar]
- 32.Takashio S, Yamamuro M, Uemura T, Utsunomiya D, Morita K, Izumiya Y, Sugiyama S, Kojima S, Yamamoto E, Tsujita K, Tanaka T, Tayama S, Kaikita K, Hokimoto S, Yasuda O, Yamashita Y, Ogawa H. Correlation between extent of myocardial fibrosis assessed by cardiac magnetic resonance and cardiac troponin T release in patients with nonischemic heart failure. Am J Cardiol. 2014;113:1697–1704. doi: 10.1016/j.amjcard.2014.02.029. [DOI] [PubMed] [Google Scholar]
- 33.Kawasaki T, Sakai C, Harimoto K, Yamano M, Miki S, Kamitani T. Usefulness of high-sensitivity cardiac troponin T and brain natriuretic peptide as biomarkers of myocardial fibrosis in patients with hypertrophic cardiomyopathy. Am J Cardiol. 2013;112:867–872. doi: 10.1016/j.amjcard.2013.04.060. [DOI] [PubMed] [Google Scholar]
- 34.Chin CW, Messika-Zeitoun D, Shah AS, Lefevre G, Bailleul S, Yeung EN, Koo M, Mirsadraee S, Mathieu T, Semple SI, Mills NL, Vahanian A, Newby DE, Dweck MR. A clinical risk score of myocardial fibrosis predicts adverse outcomes in aortic stenosis. Eur Heart J. 2016;37:713–723. doi: 10.1093/eurheartj/ehv525. [DOI] [PMC free article] [PubMed] [Google Scholar]
- 35.deFilippi CR, de Lemos JA, Tkaczuk AT, Christenson RH, Carnethon MR, Siscovick DS, Gottdiener JS, Seliger SL. Physical activity, change in biomarkers of myocardial stress and injury, and subsequent heart failure risk in older adults. J Am Coll Cardiol. 2012;60:2539–2547. doi: 10.1016/j.jacc.2012.08.1006. [DOI] [PMC free article] [PubMed] [Google Scholar]
Associated Data
This section collects any data citations, data availability statements, or supplementary materials included in this article.