

Abstract
Aims
To describe the prevalence of overweight and obesity in adolescents with type 1 diabetes (T1D) and to examine the associations among socio-demographic, clinical, and self-management factors by weight status.
Methods
We analyzed baseline data obtained from 5,529 adolescents with T1D (mean age=15.4±1.4 years, 51.8% male, 77.9% white, mean HbA1c=8.7±1.8%; 72 mmol/mol) from the T1D Exchange Clinic Registry. We examined correlates of weight status using multinomial logistic regression analyses.
Results
Overweight (22.9%) and obesity (13.1%) were prevalent in the overall sample and was highest among girls (40.8%) and adolescents of Hispanic/Latino race/ethnicity (46.1%). Female gender, older age, annual household income <$35,000 (vs. ≥$200,000), high school parental educational attainment (vs. ≥graduate degree), lower HbA1c, longer duration of T1D, higher amount of insulin, and a recent visit with an allied healthcare provider were independently and significantly associated with higher odds of overweight or obesity. Adolescents who self-rated their health as fair/poor (vs. excellent) had the highest odds of obesity (OR 3.92, 95% CI 2.53–6.06).
Conclusions
Overweight/obesity is prevalent among adolescents with T1D, especially among girls and those of diverse race/ethnicity. Some of these factors may be amenable to remediation and point to subgroups that can benefit from obesity prevention and management efforts.
Keywords: Overweight, Obesity, Diabetes Mellitus, Type 1, Behavioral Medicine
1.1 Introduction
Childhood obesity has been identified as the major public health problem of this century.[1] A significant proportion of today’s adolescents are overweight (14.0%) or obese (20.5%),[2] and the prevalence of obesity has tripled during the past three decades.[2, 3] A similar trend has been observed among adolescents with type 1 diabetes (T1D).[4] Recent international and domestic studies reported overweight/obesity ranges from 24.2% to 39.0% among adolescents with T1D.[4–9]
Overweight and obesity are of particular concern for adolescents with T1D. The complications associated with T1D, in addition to those that are attributable to overweight and obesity, can result in serious cardiovascular, neuropathic, nephropathic, and cardiometabolic consequences.[10, 11] This combination of T1D and excess weight may also result in deleterious health outcomes, such as insulin resistance, coronary artery disease, and stroke.[12]
Many clinical, lifestyle, and socio-demographic factors may be associated with overweight and obesity among adolescents with T1D. In the Diabetes Control and Complications Trial (DCCT), intensive insulin therapy that resulted in achieving target HbA1c levels reduced neuropathic and microvascular complications.[13] However, intensive insulin therapy was also associated with untoward weight gain.[14] For example, the group on intensive insulin therapy experienced twice the increase in body mass index (BMI) compared to the usual care group.[15] Results from other studies have validated the association of intensive insulin therapy, now the standard of care, with overweight/obesity.[16, 17] Similarly, other clinical approaches that are associated with tighter metabolic control, such as insulin pump therapy, higher daily insulin doses,[18] and frequent visits to healthcare providers for diabetes education and management,[19] may also be associated with higher risk of overweight/obesity.
Adolescents with T1D thus represent a population with unique clinical and diabetes management concerns that may differentially impact their engagement in health behaviors and self-management, which in turn, may influence overweight and obesity prevention efforts. For instance, fewer than 5% of adolescents with T1D achieve the pediatric clinical guidelines for the frequency, duration, and/or intensity of physical activity.[20, 21] Reasons for this trend could be related to diabetes-related stress, a common barrier to participation in physical activity in adolescents with T1D.[22] A lack of physical activity, in part driven by fear of hypoglycemia,[23] may further contribute to overweight/obesity in adolescents with T1D. Socio-demographic factors, such as age, sex, race/ethnicity, and annual household income, may be other risk factors for overweight/obesity in adolescents with T1D. Moreover, these factors may differentially impact adolescents, as these youth may also encounter issues related to identity, social norms, and gaining independence, which have been found to be related to challenges with diabetes self-management.[24–27] Several of these factors have been associated with overweight/obesity among adolescents in the general population, but findings are limited among adolescents with T1D.[4]
The purpose of this study was to examine the relationships among weight status, socio-demographic, clinical, and self-management factors in adolescents with T1D. The aims of the study were to: (1) Describe the prevalence of normal weight, overweight, and obesity in the overall sample and by age, sex, and race/ethnicity; and (2) Determine the associations of socio-demographic factors (e.g., age, sex, race/ethnicity), clinical factors (e.g., duration of diabetes, HbA1c, insulin delivery method), and self-management (e.g., self-monitoring of blood glucose, missing insulin dose(s), physical activity) on weight status (normal weight, overweight, and obesity).
2.1 Subjects, Materials & Methods
This study was a secondary analysis of data from the T1D Exchange Clinic Registry (T1D Exchange). In brief, the sample for the T1D Exchange is comprised of a broad, purposefully selected representation of pediatric and adult patients with T1D.[28] A total of 67 T1D clinical centers encompassing a wide geographical distribution including 12 adult, 36 pediatric, and 19 adult and pediatric centers. The recruitment period was September, 2010 through June, 2012. The T1D Exchange enrolled 25,833 participants of all ages into the registry, and only 3% (n=668) of eligible participants declined to participate (56% male, 69% Non-Hispanic White, median age 17 years).[28].
Participants had a clinical diagnosis of presumed autoimmune T1D and presence of either islet cell antibodies or, if antibodies were negative or unknown, use of insulin at or shortly after diagnoses and continuously thereafter.[28] The diagnosis of T1D was classified as “definite” or “probable” based on available clinical information; 94% of enrolled pediatric participants were considered “definite.”[28]
Adolescents were defined as those participants 13 to 18 years of age. Exclusion criteria for this analysis included lack of available height or weight data (n=380); recent diagnosis of T1D (< 6 months) (n=167) because weight trajectories following diagnosis and introduction of intensive insulin therapy tend to fluctuate during this “honeymoon period;” and pregnancy, celiac disease, cystic fibrosis, and other endocrinopathies (n=243) that may affect weight.[5, 6, 8, 16]. Thus, our sample included 5,529 adolescents between 13 to 18 years of age.
2.2 Data Collection
A healthcare provider obtained clinical and demographic data from the participant’s medical record at the time of enrollment. The participants completed self-administered questionnaires in the clinic using T1D Exchange-supplied tablets or laptop computers (52%), on paper in the clinic (28%), or at home by accessing a secured website through a home computer or mailed questionnaire (20%).[28] Both English and Spanish versions of the questionnaire were provided.[28]
Each participating clinic received approval from an institutional review board to ensure the ethical and appropriate conduct of the research. This study was deemed exempt by Yale University. Informed consent was obtained from parents/guardians of adolescents, and assent was obtained from adolescents. Enrolled participants were compensated and could elect to receive either a monetary gift or allocate their donation to a select charity.[28]
2.3 Measures
2.3.1 Weight Status
BMI was used to measure adiposity and generate weight status categories. BMI was calculated as kilograms per meter squared. BMI age- and gender-specific BMI cutoffs were calculated using the age- and sex-standardized norms from the Centers for Disease Control and Prevention growth charts[29]. Weight status was operationalized as normal weight, overweight and obese. Normal weight was defined as a BMI < 85th percentile for age and sex. Overweight was defined as a BMI ≥ 85th to < 95th percentile. Obesity was defined as a BMI ≥ 95th percentile.
2.3.2 Socio-Demographic Factors
Socio-demographic factors were elicited from participants or clinical questionnaires. Health care providers reported age, sex and health insurance status. Upon study enrollment, the adolescent and his or her guardian self-reported race/ethnicity, household income category, parental educational attainment, and number of people living in the household.
2.3.3 Clinical Factors
Each clinical factor was ascertained by a health care provider from the patient’s medical record or documented on the intake forms at the time of study enrollment. Treatment type was reported as conventional therapy (one to three injections per day), multiple daily injections (MDI) (four or more injections per day), or insulin pump therapy, and was operationalized as a categorical variable in all analyses. The daily amount of basal/long-acting insulin and bolus/short-acting insulin was recorded as a weekly average in units (0–200) and was operationalized as a continuous variable. HbA1c was measured three to four times per year for participants in the T1D Exchange,[28] most often using a DCA point of care device (79.2%). The HbA1c value commensurate with the date of enrollment was used as a continuous variable.
Family history of T1D included immediate family members with T1D and was operationalized as a categorical variable (yes or no). The frequency of office visits for diabetes management purposes was operationalized as a continuous variable. The item for visits to an allied healthcare provider (i.e., diabetes educator, dietician, counselor, psychologist, social worker) in the last six months was categorized as yes or no. T1D-related hypoglycemia was categorical variable (yes or no) based on whether or not a severe hypoglycemic episode that resulted in a coma or seizure was experienced in the past 12 months. Duration of diabetes was calculated from the date of diagnosis with T1D to the date of study enrollment. Self-rated health was determined based on the Likert scale responses from the participant questionnaire for the following question: “In general, how would you describe your health?” Responses were operationalized into categories as excellent, very good, good, and fair/poor.
2.3.4 Self-management
T1D self-management is defined as “an active, daily, flexible process in which youth and their parents share responsibility and decision-making for achieving disease control, health, and well-being through a wide-range of illness-related activities (p 92)”.[25] Several of these diabetes care activities include self-monitoring of blood glucose levels, physical activity, and insulin administration at mealtimes. Measures of self-management were collected on the participant questionnaire. Self-monitoring of blood glucose was assessed using the following question: “About how many times per day are you checking your blood sugar with a blood glucose meter?” This item was operationalized as a continuous variable. Insulin administration was examined by the following question: “During a typical week, how often do you miss an insulin dose?” Responses were operationalized into categories as never, rarely, sometimes, and often.
Insulin administration during mealtimes was assessed by participant responses to the following question: “At the time of a meal, assuming your blood sugar is not too high or too low, when do you usually give an insulin bolus?” Response options were treated as categorical variables, including the following categories: immediately before meal, several minutes before meal, during meal, after meal, and not regularly given. Further, the insulin to carbohydrate ratio (1 unit per × grams of carbohydrates) for breakfast, lunch, and dinner was derived. Due to multicollinearity, the insulin to carbohydrate ratio for lunch was used for this item.
Physical activity was measured using the following item: “In a typical week, how many days do you spend at least 30 minutes doing any physical activities or exercises such as running, working out, yoga or pilates, aerobic, sports, gardening, PE in school, or walking for exercise?” Since international guidelines for physical activity recommend at least 60 minutes of moderate or vigorous intensity activity on weekdays,[30] activity was operationalized as active (5 to 7 days/week), insufficient (2 to 4 days/week), or inactive (0 to 1 days/week).
2.4 Power Analysis and Sample Size
G*Power (version 3.1) software was used to calculate power and necessary sample size to examine relationships between the independent variables on weight status at a two-tailed alpha of 0.05, a recommended power level of 0.80,[31] and a small effect size (odds ratio=1.2). The sample size required to find the minimum effect was estimated to be 1484 participants based on an estimated 35% overweight/obesity prevalence in the sample, and a conservative multiple variance correction of 0.5 to account for the number of covariates. The sample had sufficient power to achieve the study aims.
2.5 Data Analyses
First, the variables pertaining to each of the domains of socio-demographic, clinical, and self-management factors were described using univariate statistics to identify outliers and the data distribution. The prevalence of normal weight, overweight, and obesity were determined for the overall cohort and by age, sex, and race/ethnicity. A correlation matrix was computed to check for multicollinearity among the independent variables. In the event that two or more variables were highly correlated (correlation coefficients ≥ 0.7), the variable with the lowest coefficient was selected for inclusion in the remainder of the analyses. Bivariate analyses were then conducted to discern whether there were any nonlinear relationships or interaction effects, and to examine the associations between each independent variable for the respective domain (socio-demographic, clinical, and self-management), and the dependent variable of weight status (normal weight vs. overweight vs. obese). Only those variables that were statistically significantly associated with the dependent variable were included in the multivariate analyses.
Multinomial regression was conducted independently for each domain estimating the relationships between the independent variables and weight status. Multinomial logistic regression operates by generalizing logistic regression to multiclass dimensions in instances when two or more possible discrete dependent variables are observed.[32] This method does not assume normality, linearity or homoscedasticity, but does have the assumption of independence among dependent variable categories, that were examined using the Hausman-McFadden test.[33] Maximum likelihood estimates were used to evaluate the probability of categorical membership. The reference category was normal weight, while separate odds ratios were estimated for the independent variables associated with the overweight and obesity categories. The beta coefficient was used to indicate the expected amount of change in the dependent variable for each one unit change in the independent variable, and the effect sizes were determined by the McFadden R2 measure.[33] Higher values indicate better fit. Stepwise backward selection was used to reduce the number of independent variables by removing those with a p-value of .15 or less. The most parsimonious, stable, and statistically significant model was fitted, as determined by the Likelihood Ratio Chi square test.[33] All analyses were reported as two-tailed, with an alpha level of 0.05, and all analyses were conducted using STATA version 14.0 (College Station, TX).
2.6 Missing Data
Variables that had more than 10% of missing data[34] included the number of office visits for diabetes management (n=1,092, 19.8%), insulin to carbohydrate ratios at lunch time (n=1,209, 21.9%) daily amount of basal/short-acting insulin (n=1,331, 24.1%), physical activity (n=1,737, 31.4%), and annual household income (n=1,843, 33.3%). To address these missing data, multiple imputation using five groups was conducted for the multivariate analyses.[34] Sensitivity analyses were conducted using only patients with complete data for these variables and similar results were ascertained.
3.1 Results
The sample included 5,529 adolescents between 13 to 18 years of age (mean age 15.4 ± 1.4 years) (Table 1). Approximately half of the sample was male (51.8%); the majority was non-Hispanic/Latino White (77.9%) and had private insurance (63.9%); and over half had a reported annual household income of $75,000 or more per year. In terms of clinical characteristics, self-monitoring of blood glucose was reported as 5.1 ± 2.1 times per day. The mean HbA1c level was 8.7 ± 1.8% (72 mmol/mol), and approximately half of the sample used insulin pump therapy. Only 21.8% of the sample had an HbA1c < 7.5%, the recommended target by the American Diabetes Association (ADA) and the International Society for Pediatric and Adolescent Diabetes (ISPAD).[35, 36]
Table 1.
Characteristics of adolescents in the overall sample (n=5,529)
| Characteristic | Total n (%) |
|---|---|
| Age, mean ± SD, years | 15.4 ± 1.4 |
| Male | 2863 (51.8) |
| Race/Ethnicity | |
| Non-Hispanic White | 4290 (77.9) |
| Hispanic/Latino | 560 (10.2) |
| Black | 364 (6.6) |
| Mixed Race | 296 (5.4) |
| Household income | |
| <$35,000 | 707 (19.2) |
| $35,000 – $74,999 | 1038 (28.2) |
| $75,000 – $99,999 | 668 (18.1) |
| $100,000 – $199,999 | 960 (26.0) |
| ≥$200,000 | 313 (8.5) |
| Parental educational attainmenta | |
| High school | 873 (17.3) |
| Some college | 921 (18.2) |
| Bachelor or Associate degree | 2027 (40.1) |
| Master degree or higher | 1230 (24.4) |
| Insurance | |
| Private | 3530 (63.9) |
| Public | 1999 (36.2) |
| First degree family member with T1D | 1087 (20.9) |
| A1C, mean ± SD, % | 8.7 ± 1.8 |
| <7.5% | 1093 (21.8) |
| Duration of diabetes, mean ± SD, years | 6.8 ± 4.1 |
| Insulin treatment type | |
| Pump | 2752 (49.8) |
| Multiple Daily Injections | 2390 (43.3) |
| Fixed dose (conventional) | 380 (6.9) |
| Self-monitoring of blood glucose, mean ± SD, times per day | 5.1 ± 2.1 |
| Severe hypoglycemiab | 113 (2.1) |
Notes: Abbreviations: BMI, body mass index (BMI=kg/m2). Data are presented as number (percentage) unless otherwise indicated.
Reported data pertains to parent with the highest level of education.
Defined as seizure or coma in last 12 months.
3.2 Prevalence of Overweight/Obesity
Weight status included normal weight (n=3,537, 64.0%), overweight (n=1,267, 22.9%) and obese (n=725, 13.1%). Compared with boys, girls had a higher prevalence of overweight (27.19% vs. 18.9%, p<.0001) and obesity (13.6% vs. 12.7%, p<.01). By race/ethnicity, Hispanic/Latino participants had the highest prevalence of overweight/obesity (46.1%), while White, non-Hispanic/Latino participants had the lowest prevalence (34.1%). Black/African American participants had the highest rate of obesity (17.9%), and Hispanic/Latino participants had the highest rate of overweight (30.2%) (Table 2).
Table 2.
Weight status by overall sample, gender and race/ethnicity
| Normal Weight n (%) |
Overweight n (%) |
Obese n (%) |
|
|---|---|---|---|
| Overall Sample | 3537 (64.0) | 1267 (22.9) | 725 (13.1) |
| Gender | |||
| Male | 1958 (68.4) | 542 (18.9) | 363 (12.7) |
| Female | 1579 (59.2) | 725 (27.2) | 362 (13.6) |
| Race/Ethnicity | |||
| White, Non-Hispanic/Latino | 2827 (65.9) | 940 (21.9) | 523 (12.2) |
| Hispanic/Latino | 302 (53.9) | 169 (30.2) | 89 (15.9) |
| Black/African American | 218 (59.9) | 81 (22.3) | 65 (17.9) |
| Other/Mixed | 181 (61.2) | 72 (24.3) | 43 (14.5) |
Notes: Weight status was defined as normal weight (BMI ≥5th to <85th percentile); overweight (BMI ≥85th to <95th percentile); and obese (BMI ≥95th percentile)
3.3 Differences in Weight Status by Socio-demographic, Clinical, and Self-management Factors
In bivariate analysis, there were significant differences in weight status in all socio-demographic variables, including age, sex, race/ethnicity, insurance, household income, parental educational attainment (p<.001), and number of people living in the household (p<.05). Significant differences were observed for the following clinical factors, with overweight and obese adolescents having lower HbA1c, shorter duration of T1D, higher daily amount of bolus and basal insulin, recent severe hypoglycemia, a first degree family member with T1D, poor self-rated health status, and recent visit(s) to allied health care provider than those of normal weight status (all p<.05). There were no differences between weight status categories on number of clinic visits for diabetes management and insulin treatment type. There were also significant differences among weight statuses and self-management factors, with overweight and obese adolescents having lower self-monitoring of blood glucose, lower insulin to carbohydrate ratio, and less physical activity (all p<.0001). No significant differences were noted for timing of boluses during mealtimes or frequency of missing insulin doses.
3.4 Factors Associated with Overweight and Obesity
The multinomial logistic regression odds ratios (95% CI) for overweight and obesity stratified by socio-demographic, clinical, and self-management domains are presented in Table 3. Female gender, older age, Hispanic/Latino race/ethnicity, and low parental educational attainment were all independently and significantly associated with higher odds of being overweight. Female gender, older age, annual household income <$75,000, and low parental education were associated with higher odds of being in the obese category. Lower HbA1c, higher amount of daily bolus/basal insulin, and worse self-rated health were independently and significantly associated with overweight and obesity. Additionally, shorter duration of T1D, recent severe hypoglycemia, and a recent visit to an allied healthcare provider were independently and significantly associated with having greater odds of obesity. The self-management model demonstrated similar results for both overweight and obesity categories. Frequent self-monitoring of blood glucose level and high insulin to carbohydrate ratio were independently associated with lower odds of being overweight and obese. Compared to those who were inactive, the odds of overweight and obesity decreased by 28% and 30%, respectively, for adolescents who were active (OR 0.72, 95% CI 0.54 to 0.96 and OR 0.70, 95% CI 0.49 to 0.99). Adolescents who self-rated their health as fair/poor had the greatest odds of obesity (OR 5.77, 95% CI 3.85 to 8.65).
Table 3.
Domain-specific associations between socio-demographic, clinical, and the risk of overweight and obesity
| Overweight | Obese | |||
|---|---|---|---|---|
| OR (95% CI) | P | OR (95% CI) | P | |
| Socio-demographic Factors | ||||
| Gender | ||||
| Male | ref | ref | ||
| Female | 1.71 (1.47–1.97) | 0.000 | 1.21 (1.01–1.45) | 0.037 |
| Age | 1.39 (1.32–1.46) | 0.000 | 1.43 (1.34–1.52) | 0.000 |
| Insurance | ||||
| Private | ref | ref | ||
| Public | 1.04 (0.87–1.26) | 0.655 | 1.10 (0.88–1.37) | 0.414 |
| Race/Ethnicity | ||||
| White, Non-Hispanic/Latino | ref | ref | ||
| Hispanic/Latino | 1.33 (1.04–1.71) | 0.024 | 1.10 (0.80–1.50) | 0.555 |
| Black/African American | 0.87 (0.63–1.20) | 0.393 | 1.07 (0.75–1.54) | 0.698 |
| Other/Mixed | 1.05 (0.75–1.45) | 0.762 | 0.97 (0.65–1.47) | 0.903 |
| Household income, annual | ||||
| <$35,000 | 1.29 (0.91–1.83) | 0.146 | 2.24 (1.39–3.60) | 0.001 |
| $35,000 – $74,999 | 1.08 (0.79–1.46) | 0.640 | 1.87 (1.21–2.88) | 0.005 |
| $75,000 – $99,999 | 1.04 (0.76–1.42) | 0.796 | 1.38 (0.87–2.16) | 0.168 |
| $100,000 – $199,999 | 0.96 (0.71–1.28) | 0.775 | 1.26 (0.82–1.95) | 0.290 |
| ≥$200,000 | ref | ref | ||
| Parental educational attainment | ||||
| High school | 1.18 (0.91–1.54) | 0.024 | 1.64 (1.19–2.26) | 0.003 |
| Some college | 1.15 (0.91–1.47) | 0.393 | 1.39 (1.02–1.89) | 0.035 |
| Bachelor or Associate degree | 1.07 (0.88–1.30) | 0.762 | 1.29 (1.00–1.67) | 0.050 |
| Master degree or higher | ref | ref | ||
| Household occupancy | ||||
| 1–3 people | ref | ref | ||
| 4–5 people | 0.98 (0.82–1.16) | 0.815 | 0.97 (0.79–1.19) | 0.759 |
| ≥6 people | 1.14 (0.90–1.45) | 0.270 | 0.77 (0.56–1.05) | 0.105 |
| Clinical Factors | ||||
| HbA1c | 0.94 (0.89–0.98) | 0.010 | 0.81 (0.76–0.87) | 0.000 |
| Bolus/short-acting insulin | 1.01 (1.00–1.01) | 0.001 | 1.01 (1.01–1.02) | 0.000 |
| Basal/long-acting insulin | 1.04 (1.03–1.05) | 0.000 | 1.06 (1.05–1.07) | 0.000 |
| Duration of T1D | 1.01 (0.99–1.03) | 0.188 | 0.97 (0.95–1.00) | 0.030 |
| Severe hypoglycemia | ||||
| Yes | 1.20 (0.69–2.09) | 0.513 | 1.96 (1.06–3.64) | 0.032 |
| No | ref | ref | ||
| Family member with T1D | ||||
| Yes | 1.07 (0.88–1.29) | 0.495 | 1.21 (0.95–1.54) | 0.119 |
| No | ref | ref | ||
| Visits to allied healthcare provider in last 6 months | ||||
| Yes | 1.00 (0.84–1.18) | 0.960 | 1.38 (1.09–1.75) | 0.008 |
| No | ref | ref | ||
| Self-rated health | ||||
| Excellent | ref | ref | ||
| Very good | 1.19 (0.97–1.46) | 0.092 | 1.75 (1.28–2.39) | 0.000 |
| Good | 1.72 (1.38–2.15) | 0.000 | 3.80 (2.77–5.20) | 0.000 |
| Fair/poor | 2.00 (1.45–2.77) | 0.000 | 5.77 (3.85–8.65) | 0.000 |
| Self-management Factors | ||||
| Self-monitoring blood glucose | 0.96 (0.93–0.99) | 0.039 | 0.94 (0.89–0.98) | 0.004 |
| Insulin to carbohydrate ratio | 0.96 (0.95–0.98) | 0.000 | 0.94 (0.92–0.96) | 0.000 |
| Physical activity¶ | ||||
| Inactive | ref | ref | ||
| Insufficient | 0.79 (0.59–1.07) | 0.124 | 0.88 (0.61–1.25) | 0.472 |
| Active | 0.72 (0.54–0.96) | 0.023 | 0.70 (0.49–0.99) | 0.043 |
Notes: All analyses were controlled for other variables in each domain. All ORs for continuous variables should be interpreted as one unit increase in value.
Weight status was defined as overweight (BMI ≥85th to <95th percentile) and obese (BMI ≥95th percentile).
Physical activity categories comprised inactive (0–1 days/wk), insufficient (2–4 days/wk), or active (5 to 7 days/wk).
Factors associated significantly with overweight and obesity in the domain-specific analysis were then entered into the full multinomial logistic regression model. Two variables, self-monitoring of blood glucose levels and physical activity, were removed due to lack of statistical significance (p>.15). When controlling for all other factors, female gender (OR 1.90, 95% CI 1.61 to 2.26, p<.0001), older age (OR 1.33, 95% CI 1.25 to 1.42, p<.0001), Hispanic/Latino race/ethnicity (vs. White) (OR 1.52, 95% CI 1.15 to 2.01, p<.01), good self-rated health (vs. excellent) (OR 1.37, 95% CI 1.08 to 1.75, p<.01), higher amount of bolus/short-acting insulin (OR 1.01, 95% CI 1.01 to 1.01, p<.0001), and basal/long-acting insulin (OR 1.04, 95% CI 1.03 to 1.05, p<.0001) were statistically significantly associated with having higher odds of overweight status (Figure 1). For each unit increase in HbA1c, the odds of overweight decreased by 8% (OR 0.92, 95% CI 0.87 to 0.97, p<.01). Factors not statistically significantly associated with risk of overweight included annual household income, parental educational attainment, Black/African American or mixed/other race/ethnicity (vs. White, non-Hispanic/Latino), very good (vs. excellent) (OR 1.07, 95% CI 0.86 to 1.33, p=.53) and fair/poor (OR 1.38, 95% CI 0.97 to 1.98, p=.08) self-rated health, recent visit to an allied healthcare provider, duration of T1D, severe hypoglycemia, and insulin to carbohydrate ratio.
Figure 1.
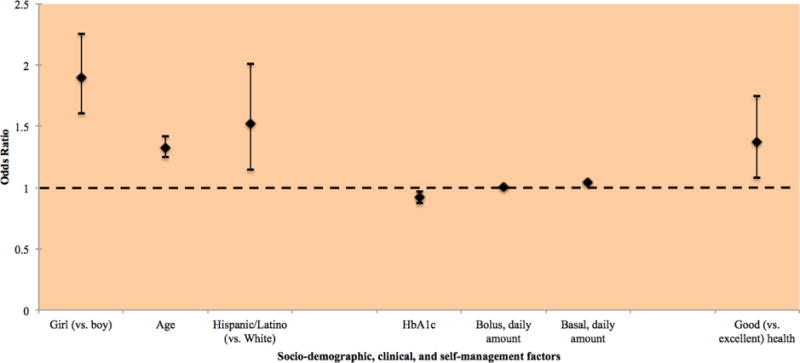
Factors significantly associated with overweight (vs. normal weight) identified in multinomial analysis
Ten factors were associated with higher odds of obesity (Figure 2): female gender (OR 1.28, 95% CI 1.03 to 1.59, p<.05), older age (OR 1.38, 95% CI 1.28 to 1.50, p<.0001), annual household income <$35,000 (OR 1.76, 95% CI 1.05 to 2.96, p<.05), low parental educational attainment (OR 1.49, 95% CI 1.02 to 2.18, p<.05), higher amount of bolus/short-acting insulin (OR 1.01, 95% CI 1.01 to 1.01, p<.0002) and basal/long-acting insulin (OR 1.06, 95% CI 1.05 to 1.07, p<.0001), and recent visit with an allied healthcare provider (OR 1.42, 95% CI 1.11 to 1.83, p<.01). For each unit increase in duration of T1D and HbA1c, the odds of obesity decreased by 5% (OR 0.95, 95% CI 0.92 to 0.97, p<.0001) and 21% (OR 0.79, 95% CI 0.73 to 0.84), respectively. Adolescents who self-rated their health as very good (OR 1.63, 95% CI 1.18 to 2.25, p<.01), good (OR 3.08, 95% CI 2.20 to 4.29, p<.0001), and fair/poor (OR 3.92, 95% CI 2.53 to 6.06, p<.0001) (vs. excellent) had the highest odds of being obese. Factors not statistically significantly associated with risk of obesity included annual household income >$35,000, some college or college parental educational attainment, race/ethnicity, severe hypoglycemia, and insulin to carbohydrate ratio. The most parsimonious and best-fitted model had McFadden R2 and maximum likelihood R2 estimates of 0.121 and 0.193, respectively.
Figure 2.
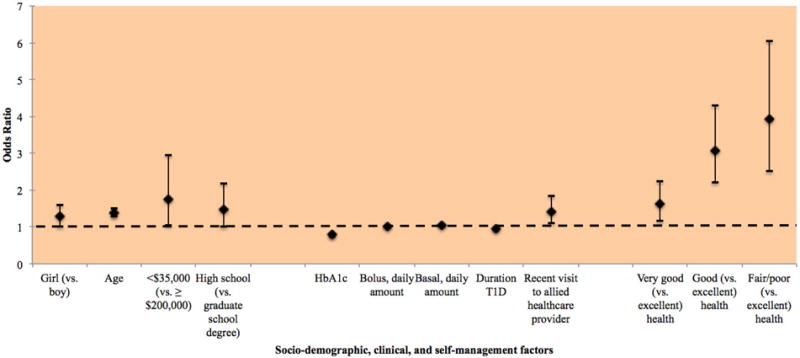
Factors significantly associated with obesity (vs. normal weight) identified in multinomial analysis
4.1 Discussion
In this study of adolescents with T1D, the prevalence of overweight and obesity was high (36.0%), and there were notable differences by gender and race/ethnicity. In multivariate analysis, we found several socio-demographic, clinical, and self-management factors associated with higher risk of being overweight and obese. The strength of the significant associations ranged from odds ratios of 0.79 to 3.92 in the multinomial analysis, with ten factors identified for risk of obesity. These factors may be amenable to remediation or point to subgroups that can benefit from obesity prevention efforts.
Over two decades ago, adolescents with T1D were generally slender and rarely obese.[17] However, the findings from our study show a high prevalence of overweight and obesity. These rates correspond with other global estimates obtained among adolescents without a chronic illness,[4–8] suggesting a pressing public health problem. Further, overweight and obesity may disproportionally affect certain subgroups of adolescents with T1D. For instance, girls had a much higher prevalence of overweight than boys. This difference was sustained in multivariate analyses that revealed that girls had 90% and 30% higher odds of overweight and obesity, respectively, compared with boys. Similar observations have been noted in other studies.[6, 16]
Although the majority of adolescents in the sample were of non-Hispanic/Latino White race/ethnicity, adolescents of non-White race/ethnicity had a higher prevalence of overweight and obesity. Similarly, in a population-based sample, Hispanic/Latino youth with T1D had the highest prevalence of overweight/obesity (45.0%), followed by African Americans (43.5%), Asian-Pacific Islanders (41.0%), non-Hispanic/Latino Whites (31.5%), and American Indian (15.0%).[4] Controlling for all other factors, we found Hispanic/Latino adolescents had over 50% higher risk of overweight compared with those of non-Hispanic/Latino White race/ethnicity. This cumulative evidence suggests the need for future obesity prevention interventions that target girls and adolescents of diverse race/ethnicity.
In multivariate analysis, adolescents who were in better metabolic control were at higher risk of overweight, and this association was even more pronounced for risk of obesity. Other clinical mechanisms that coincide with intensive insulin therapy translated to higher odds of overweight and obesity were found. For instance, higher doses of daily bolus/short-acting and basal/long-acting insulin were modestly associated with risk of overweight and obesity compared with lower amounts. Higher doses of insulin may reflect higher endogenous levels of insulin resistance related to overweight and obesity, or conversely, higher insulin resistance may promote weight gain with exogenous insulin. Attending regular visits with an allied health care provider (i.e., diabetes educator, dietician, social worker, counselor, psychologist) was associated with higher odds of obesity. This may be because regular visits increase the odds of adolescents to become obese as a result of enhanced diabetes management. In addition, enhancing management implies an appropriate change of lifestyle. We cannot, however, exclude that enhancing diabetes management may associate with higher odds of obesity. Shorter duration of T1D was also associated with obesity, a finding that may be explained by recent evidence that youth with shorter diabetes duration performed significantly more diabetes care activities and more diabetes goals than individuals with a longer duration.[37] Indeed, our observed relationships have been supported by other studies. For instance, investigators conducted a longitudinal study with 12,774 adolescents with T1D and found the increase in BMI standard deviation scores over time was significantly related to shorter diabetes duration, intensive insulin therapy, and higher total daily insulin dose.[16] The association between overweight or obesity was highest in patients who used pump therapy, a finding confirmed in another study,[8] but not observed in our study.
The factor most strongly associated with weight status was self-rated health; however this finding was consistent only for those who were obese not overweight. Ratings of health as fair or poor, compared with excellent, was associated with nearly four times the odds of obesity. In no other studies of adolescents with T1D was this finding reported, but obesity has been associated with poor perceived general health in the general adolescent population. These findings may be due to dissatisfied body image, limitations in functional ability, and related psychosocial problems.[38] This finding may also suggest that obese adolescents attribute health status to their weight status. Thus, an assessment of self-rated general health may be important indicator of perceived physical and psychosocial health and could feasibly be integrated into clinical practice.
Although factors related to diabetes self-management were not associated with overweight or obesity in the full multinomial logistic regression analysis, significant associations were observed in the domain-specific analysis. Adolescents who met pediatric guidelines for physical activity (60 minutes per week day)[30] had lower odds of overweight and obesity. Although evidence about this relationship is limited among adolescents with T1D,[21] researchers of one study did not observe a significant association between physical activity and overweight/obesity.[39] Yet, in a recent study among 7,153 adults with T1D, it was found that individuals’ odds of not participating in physical activity increased with every one-point increase in BMI.[40] Further, small feasibility interventions that have sought to reduce overweight/obesity among youth with T1D have reported modest effects.[41, 42] Nonetheless, given the limited number of studies and the equivocal nature of the current evidence among youth with T1D, future research is needed to address this topic, as well as other health behaviors.
We found that adolescents who lived in households that did not exceed an annual income of $35,000 had higher odds of obesity than those who earned $200,000 or more per year. Moreover, adolescents who had parental educational attainment of a high school degree or less had almost 50% higher odds of obesity compared with those who attended graduate school. Results of longitudinal studies conducted among the general population suggest that lower income and less parental educational attainment were tied to higher BMI.[43] Potential explanations for these findings could pertain to lower income and less educated households having a lack of knowledge and resources to promote health behaviors. For instance, the consumption of unhealthy, low nutrient and high carbohydrate foods and drinks that has been observed among lower income and less educated families in the general population[44, 45] may be further compounded in adolescents with T1D who must compensate carbohydrates with more insulin, resulting in the potential for even more weight gain.
4.2 Implications
With overweight and obesity affecting one-in-three adolescents with T1D, interventions to prevent and manage obesity are needed. We have identified specific factors that may be targeted. Clinically, providers could be more attentive to the risk of intensive insulin therapy triggering weight gain among adolescents with T1D and the related deleterious cardiovascular and metabolic outcomes, as well as the potential for insulin omission to prevent weight gain. Clinical care has traditionally focused on achieving metabolic control; thus providers should be more knowledgeable about the importance of promoting physical activity and other health behaviors for their adolescent patients with T1D. Issues related to fear of hypoglycemia during and following engagement with physical activity[23] may need to be addressed. While the recommended approach to nutrition in adolescents with T1D promotes balanced nutrition,[46] the focus on carbohydrate counting allows youth to circumvent such recommendations.[21] Adolescents with T1D should be educated on the importance of a consuming a nutrient-rich diet, including the consumption of healthy fruits and vegetables, in conjunction with proper self-management. As demonstrated by the Diabetes Prevention Program,[47] a multipronged approach to weight loss that utilizes both medication and lifestyle change may be the most efficacious, with the achievement of a healthy lifestyle being a core component in obesity prevention and management. Diabetes care organizations, such as the American Diabetes Association (ADA) or International Society for Pediatric and Adolescent Diabetes (ISPAD) may also consider developing obesity prevention and management practice guidelines for adolescents with T1D addressing these points.
Given the high risk of overweight and obesity in higher risk groups, future obesity prevention and management interventions can target adolescents who live in lower income and less educated households, as well as those who are of Hispanic/Latino race/ethnicity. Gender-specific interventions that address the concerns of girls with T1D are also warranted. In the context of the accumulating evidence, ecological models may provide theoretical support to identify those modifiable individual (e.g., adolescent), interpersonal (e.g., provider, parents) and environmental attributes (e.g., socioeconomic status, community) of overweight and obesity in adolescents with T1D. Through addressing the interrelated factors that contribute to an “obesogenic environment”[48, 49] for adolescents with T1D, interventions may be able improve metabolic functioning and help to prevent weight gain.
4.3 Limitations
The results of our study must be interpreted within the context of the following limitations. First, the sample was not population-based, thus generalizability may be limited. However, participant characteristics were similar to those of participants in the SEARCH for Diabetes in Youth Study, a six-center population-based observational study conducted among youth under 20 years of age.[50] Selection bias may also exist such that only 25% of a clinic’s patient population was approached for the registry and ultimately enrolled, but the weighted distribution of characteristics between those enrolled and the total patient population of the clinics were similar.[28] Second, some data were collected via self-report measures, potentially introducing social desirability and/or recall bias. A high proportion of missing data was found for five of these variables. Third, the analysis was dependent upon those variables available in the dataset. For instance, it would have been advantageous to have access to other health behaviors that might also predict overweight/obesity, such as dietary behavior or nutrition (e.g., consumption of sugar-sweetened beverages, fruit and vegetable consumption). Future study is needed to determine if the combination of increased flexibility in diet with carbohydrate counting and the consumption of unhealthy foods may explain why some of the more flexible routines, such as insulin pump therapy or higher insulin doses, were associated with increased risk of overweight/obesity. The examination of other health behaviors, including sedentary behavior and sleep, may be valuable to consider in future studies examining the topic of overweight/obesity in adolescents with T1D, as well as the inclusion of a more robust and objective measure of physical activity.
4.4 Conclusions
Overweight and obese adolescents with T1D constitute a relatively new and surprising phenotype of diabetes and an understudied population with excess cardiovascular morbidity and mortality risk compared with normal weight adolescents with T1D. In our study, we found that female gender, older age, lower HbA1c, and higher basal/bolus insulin doses were associated with overweight and obesity. The only factor specifically related to overweight was Hispanic/Latino race/ethnicity, whereas obesity was associated with lower income and parental educational attainment, shorter duration of T1D, frequent visits to allied health care providers, and poor perceived general health. Our results suggest many factors that may be targeted in future obesity prevention and management intervention and subgroups that may benefit from such interventions.
Highlights.
Over 1 in 3 adolescents with T1D is overweight/obese in the United States
Almost half of girls and adolescents of diverse race ethnicity are overweight/obese
Lower HbA1c and longer duration of T1D are factors associated with overweight and obesity
Several sociodemographic factors are associated with overweight and obesity, including female gender, low household income and parental educational attainment
There are a greater number of risk factors for obesity than overweight among adolescents with T1D
Poor-fair self-rated health status is the greatest correlate of overweight and obesity
Acknowledgments
We would like to thank all participants for participating in this study, and the Type 1 Diabetes Exchange Clinic Registry for making these data publicly available.
Funding: KM was funded by a pre-doctoral fellowship from the National Institute of Diabetes and Digestive and Kidney Disease/NIH (T32DK07718).
Footnotes
Publisher's Disclaimer: This is a PDF file of an unedited manuscript that has been accepted for publication. As a service to our customers we are providing this early version of the manuscript. The manuscript will undergo copyediting, typesetting, and review of the resulting proof before it is published in its final citable form. Please note that during the production process errors may be discovered which could affect the content, and all legal disclaimers that apply to the journal pertain.
Conflict of Interest:
All authors have reported no conflicts of interest for this study.
References
- 1.Jack A. Time to supersize control efforts for obesity. Lancet. 2007;370:1521. doi: 10.1016/S0140-6736(07)61639-0. [DOI] [PubMed] [Google Scholar]
- 2.Ogden CL, Carroll MD, Kit BK, Flegal KM. Prevalence of childhood and adult obesity in the united states, 2011–2012. JAMA. 2014;311:806–14. doi: 10.1001/jama.2014.732. [DOI] [PMC free article] [PubMed] [Google Scholar]
- 3.Ogden CL, Carroll MD, Lawman HG, et al. Trends in obesity prevalence among children and adolescents in the united states, 1988–1994 through 2013–2014. JAMA. 2016;315:2292–9. doi: 10.1001/jama.2016.6361. [DOI] [PMC free article] [PubMed] [Google Scholar]
- 4.Liu LL, Lawrence JM, Davis C, Liese AD, Pettitt DJ, Pihoker C, et al. Prevalence of overweight and obesity in youth with diabetes in USA: the SEARCH for Diabetes in Youth study. Pediatric Diabetes. 2010;11:4–11. doi: 10.1111/j.1399-5448.2009.00519.x. [DOI] [PubMed] [Google Scholar]
- 5.Sandhu N, Witmans MB, Lemay J-F, Crawford S, Jadavji N, Pacaud D. Prevalence of overweight and obesity in children and adolescents with type 1 diabetes mellitus. Journal of Pediatric Endocrinology. 2008;21:631–40. doi: 10.1515/JPEM.2008.21.7.631. [DOI] [PubMed] [Google Scholar]
- 6.Pinhas-Hamiel O, Levek-Motola N, Kaidar K, Boyko V, Tisch E, Mazor-Aronovitch K, et al. Prevalence of overweight, obesity and metabolic syndrome components in children, adolescents and young adults with type 1 diabetes. Diabetes Metab Res Rev. 2015;31:76–84. doi: 10.1002/dmrr.2565. [DOI] [PubMed] [Google Scholar]
- 7.Van Vliet M, Van Der Heyden JC, Diamant M, Von Rosenstiel IA, Schindhelm RK, Heymans MW, et al. Overweight children with type 1 diabetes have a more favourable lipid profile than overweight non-diabetic children. European Journal of Pediatrics. 2012;171:493–8. doi: 10.1007/s00431-011-1574-7. [DOI] [PMC free article] [PubMed] [Google Scholar]
- 8.Baskaran C, Volkening LK, Diaz M, Laffel LM. A decade of temporal trends in overweight/obesity in youth with type 1 diabetes after the Diabetes Control and Complications Trial. Pediatric Diabetes. 2015;16:263–70. doi: 10.1111/pedi.12166. [DOI] [PMC free article] [PubMed] [Google Scholar]
- 9.Fröhlich-Reiterer EE, Rosenbauer J, Bechtold-Dalla Pozza S, Hofer SE, Schober E, Holl RW, et al. Predictors of increasing BMI during the course of diabetes in children and adolescents with type 1 diabetes: data from the German/Austrian DPV multicentre survey. Archives of Disease in Childhood. 2014;99:738–43. doi: 10.1136/archdischild-2013-304237. [DOI] [PubMed] [Google Scholar]
- 10.Krishnan S, Short KR. Prevalence and significance of cardiometabolic risk factors in children with type 1 diabetes. Journal of the cardiometabolic syndrome. 2009;4:50–6. doi: 10.1111/j.1559-4572.2008.00034.x. [DOI] [PMC free article] [PubMed] [Google Scholar]
- 11.Pozzilli P, Guglielmi C, Caprio S, Buzzetti R. Obesity, autoimmunity, and double diabetes in youth. Diabetes Care. 2011;34(Suppl 2):S166–70. doi: 10.2337/dc11-s213. [DOI] [PMC free article] [PubMed] [Google Scholar]
- 12.Soedamah-Muthu SS, Fuller JH, Mulnier HE, Raleigh VS, Lawrenson RA, Colhoun HM. High risk of cardiovascular disease in patients with type 1 diabetes in the U.K.: a cohort study using the General Practice Research Database. Diabetes Care. 2006;29:798–804. doi: 10.2337/diacare.29.04.06.dc05-1433. [DOI] [PubMed] [Google Scholar]
- 13.Nathan DM, Group ftDER The Diabetes Control and Complications Trial/Epidemiology of Diabetes Interventions and Complications Study at 30 Years: Overview. Diabetes Care. 2014;37:9–16. doi: 10.2337/dc13-2112. [DOI] [PMC free article] [PubMed] [Google Scholar]
- 14.DCCT Research Group. Influence of intensive diabetes treatment on body weight and composition of adults with type 1 diabetes in the Diabetes Control and Complications Trial. Diabetes Care. 2001;24:1711–21. doi: 10.2337/diacare.24.10.1711. [DOI] [PMC free article] [PubMed] [Google Scholar]
- 15.DCCT Research Group. Effect of intensive diabetes management on macrovascular events and risk factors in the Diabetes Control and Complications Trial. The American journal of cardiology. 1995;75:894–903. doi: 10.1016/s0002-9149(99)80683-3. [DOI] [PubMed] [Google Scholar]
- 16.Fröhlich-Reiterer EE, Rosenbauer J, Bechtold-Dalla Pozza S, Hofer SE, Schober E, Holl RW, et al. Predictors of increasing BMI during the course of diabetes in children and adolescents with type 1 diabetes: data from the German/Austrian DPV multicentre survey. Archives of Disease in Childhood. 2014;99:738–43. doi: 10.1136/archdischild-2013-304237. [DOI] [PubMed] [Google Scholar]
- 17.Libman IM, Pietropaolo M, Arslanian SA, LaPorte RE, Becker DJ. Changing prevalence of overweight children and adolescents at onset of insulin-treated diabetes. Diabetes Care. 2003;26:2871–5. doi: 10.2337/diacare.26.10.2871. [DOI] [PubMed] [Google Scholar]
- 18.Delahanty LM, Halford BN. The Role of Diet Behaviors in Achieving Improved Glycemic Control in Intensively Treated Patients in the Diabetes Control and Complications Trial. Diabetes Care. 1993;16:1453–8. doi: 10.2337/diacare.16.11.1453. [DOI] [PubMed] [Google Scholar]
- 19.Funnell MM, Brown TL, Childs BP, Haas LB, Hosey GM, Jensen B, et al. National Standards for Diabetes Self-Management Education. Diabetes Care. 2009;32:S87–S94. doi: 10.2337/dc08-S087. [DOI] [PMC free article] [PubMed] [Google Scholar]
- 20.Liese AD, Ma X, Maahs DM, Trilk JL. Physical activity, sedentary behaviors, physical fitness, and their relation to health outcomes in youth with type 1 and type 2 diabetes: A review of the epidemiologic literature. Journal of Sport and Health Science. 2013;2:21–38. [Google Scholar]
- 21.Minges KE, Whittemore R, Grey M. Overweight and obesity in youth with type 1 diabetes. Annual Review of Nursing Research. 2013;31:47–69. doi: 10.1891/0739-6686.31.47. [DOI] [PMC free article] [PubMed] [Google Scholar]
- 22.Brazeau A-S, Rabasa-Lhoret R, Strychar I, Mircescu H. Barriers to physical activity among patients with type 1 diabetes. Diabetes Care. 2008;31:2108–9. doi: 10.2337/dc08-0720. [DOI] [PMC free article] [PubMed] [Google Scholar]
- 23.Di Battista AM, Hart TA, Greco L, Gloizer J. Type 1 diabetes among adolescents: reduced diabetes self-care caused by social fear and fear of hypoglycemia. Diabetes Educator. 2009;35:465–75. doi: 10.1177/0145721709333492. [DOI] [PubMed] [Google Scholar]
- 24.Minges KE, Whittemore R, Chao A, Jefferson V, Murphy KM, Grey M. Clinical, Psychosocial and Demographic Factors are Associated with Overweight and Obesity in Early Adolescent Girls with Type 1 Diabetes The Diabetes Educator. doi: 10.1177/0145721716654006. In press. [DOI] [PMC free article] [PubMed] [Google Scholar]
- 25.Schilling LS, Grey M, Knafl KA. The concept of self-management of type 1 diabetes in children and adolescents: an evolutionary concept analysis. Journal of Advanced Nursing. 2002;37:87–99. doi: 10.1046/j.1365-2648.2002.02061.x. [DOI] [PubMed] [Google Scholar]
- 26.Davidson M, Penney ED, Muller B, Grey M. Stressors and self-care challenges faced by adolescents living with type 1 diabetes. Applied nursing research: ANR. 2004;17:72–80. doi: 10.1016/j.apnr.2004.02.006. [DOI] [PubMed] [Google Scholar]
- 27.Malik JA, Koot HM. Explaining the adjustment of adolescents with type 1 diabetes: role of diabetes-specific and psychosocial factors. Diabetes Care. 2009;32:774–9. doi: 10.2337/dc08-1306. [DOI] [PMC free article] [PubMed] [Google Scholar]
- 28.Beck RW, Tamborlane WV, Bergenstal RM, Miller KM, DuBose SN, Hall CA. The T1D Exchange Clinic Registry. The Journal of Clinical Endocrinology & Metabolism. 2012;97:4383–9. doi: 10.1210/jc.2012-1561. [DOI] [PubMed] [Google Scholar]
- 29.Kuczmarski RJ, Ogden CL, Guo SS, Grummer-Strawn LM, Flegal KM, Mei Z, et al. CDC Growth Charts for the United States: methods and development. (Vital and health statistics Series 11).Data from the national health survey. 2000;2002:1–190. [PubMed] [Google Scholar]
- 30.World Health Organization. Global recommendations on physical activity for health. Geneva: World Health Organization; 2010. [PubMed] [Google Scholar]
- 31.Cohen A. Statistical Power Analysis for the Behavioral Sciences. 2. Hilldale, NJ: Erlbaum; 1988. [Google Scholar]
- 32.Kwak C, Clayton-Matthews A. Multinomial logistic regression. Nursing research. 2002;51:404–10. doi: 10.1097/00006199-200211000-00009. [DOI] [PubMed] [Google Scholar]
- 33.Starkweather J, Moske AK. Multinomial logistic regression. 2011 [Google Scholar]
- 34.Bennett DA. How can I deal with missing data in my study? Australian and New Zealand Journal of Public Health. 2001;25:464–9. [PubMed] [Google Scholar]
- 35.American Diabetes Association. Standards of Medical Care in Diabetes—2014. Diabetes Care. 2014;37:S14–S80. doi: 10.2337/dc14-S014. [DOI] [PubMed] [Google Scholar]
- 36.Rewers M, Pihoker C, Donaghue K, Hanas R, Swift P, Klingensmith GJ. Assessment and monitoring of glycemic control in children and adolescents with diabetes. Pediatr Diabetes. 2009;10(Suppl 12):71–81. doi: 10.1111/j.1399-5448.2009.00582.x. [DOI] [PubMed] [Google Scholar]
- 37.Chao A, Whittemore R, Minges KE, Murphy KM, Grey M. Self-management in early adolescence and differences by age at diagnosis and duration of type 1 diabetes. Diabetes Educ. 2014;40:167–77. doi: 10.1177/0145721713520567. [DOI] [PMC free article] [PubMed] [Google Scholar]
- 38.Meland E, Haugland S, Breidablik H-J. Body image and perceived health in adolescence. Health Education Research. 2007;22:342–50. doi: 10.1093/her/cyl085. [DOI] [PubMed] [Google Scholar]
- 39.Overby NC, Margeirsdottir HD, Brunborg C, Anderssen SA, Andersen LF, Dahl-Jorgensen K, et al. Physical activity and overweight in children and adolescents using intensified insulin treatment. Pediatric Diabetes. 2009;10:135–41. doi: 10.1111/j.1399-5448.2008.00454.x. [DOI] [PubMed] [Google Scholar]
- 40.McCarthy MM, Whittemore R, Grey M. Physical Activity in Adults With Type 1 Diabetes. The Diabetes Educator. 2015 doi: 10.1177/0145721715620021. [DOI] [PMC free article] [PubMed] [Google Scholar]
- 41.Semiz S, Bilgin UO, Bundak R, Bircan I. Summer camps for diabetic children: an experience in Antalya, Turkey. Acta Diabetologica. 2000;37:197–200. doi: 10.1007/s005920070005. [DOI] [PubMed] [Google Scholar]
- 42.Thomas-Dobersen DA, Butler-Simon N, Fleshner M. Evaluation of a weight management intervention program in adolescents with insulin-dependent diabetes mellitus. Journal of the American Dietetic Association. 1993;93:535–40. doi: 10.1016/0002-8223(93)91812-5. [DOI] [PubMed] [Google Scholar]
- 43.Demment MM, Haas JD, Olson CM. Changes in family income status and the development of overweight and obesity from 2 to 15 years: a longitudinal study. BMC public health. 2014;14:417. doi: 10.1186/1471-2458-14-417. [DOI] [PMC free article] [PubMed] [Google Scholar]
- 44.Kant AK, Graubard BI. Family income and education were related with 30-year time trends in dietary and meal behaviors of American children and adolescents. The Journal of nutrition. 2013;143:690–700. doi: 10.3945/jn.112.165258. [DOI] [PMC free article] [PubMed] [Google Scholar]
- 45.Popkin B, Bray G, Hu F. Managing and Preventing Obesity: Behavioural Factors and Dietary Interventions. Cambridge, U.K.: Elsevier; 2014. The role of high sugar foods and sugar-sweetened beverages in weight gain and obesity; p. 45. [Google Scholar]
- 46.Gillespie SJ, Kulkarni KD, Daly AE. Using carbohydrate counting in diabetes clinical practice. Journal of the American Dietetic Association. 1998;98:897–905. doi: 10.1016/S0002-8223(98)00206-5. [DOI] [PubMed] [Google Scholar]
- 47.Diabetes Prevention Program Research Group. Reduction in the Incidence of Type 2 Diabetes with Lifestyle Intervention or Metformin. New England Journal of Medicine. 2002;346:393–403. doi: 10.1056/NEJMoa012512. [DOI] [PMC free article] [PubMed] [Google Scholar]
- 48.Minges KE, Owen N, Salmon J, Chao A, Dunstan DW, Whittemore R. Health psychology: official journal of the Division of Health Psychology. Vol. 34. American Psychological Association; 2015. Reducing youth screen time: qualitative metasynthesis of findings on barriers and facilitators; pp. 381–97. [DOI] [PMC free article] [PubMed] [Google Scholar]
- 49.Owen N, Sugiyama T, Eakin EE, Gardiner PA, Tremblay MS, Sallis JF. Adults’ sedentary behavior determinants and interventions. American journal of preventive medicine. 2011;41:189–96. doi: 10.1016/j.amepre.2011.05.013. [DOI] [PubMed] [Google Scholar]
- 50.Liese AD, D’Agostino RB, Jr, Hamman RF, Kilgo PD, Lawrence JM, Liu LL, et al. The burden of diabetes mellitus among US youth: prevalence estimates from the SEARCH for Diabetes in Youth Study. Pediatrics. 2006;118:1510–8. doi: 10.1542/peds.2006-0690. [DOI] [PubMed] [Google Scholar]