

Abstract
Aim
Amiselimod (MT‐1303) is a selective sphingosine 1‐phosphate 1 (S1P1) receptor modulator which is currently being developed for the treatment of various autoimmune diseases. Unlike some other S1P receptor modulators, amiselimod seemed to show a favourable cardiac safety profile in preclinical, phase I and II studies. The aim of the current study was to characterize the cardiac effects of amiselimod by directly comparing it with fingolimod and placebo.
Methods
A total of 81 healthy subjects aged 18–55 years were equally randomized to receive amiselimod 0.4 mg, amiselimod 0.8 mg, placebo or fingolimod 0.5 mg once daily for 28 days. The chronotropic/dromotropic and inotropic effects were evaluated using intensive Holter electrocardiogram and echocardiography.
Results
Unlike fingolimod, neither amiselimod dose exerted acute (1–6 h) negative chronotropic effects on Days 1 and 2. The lowest nadir mean hourly heart rate was observed on Day 14 in the amiselimod 0.4 mg group (least squares mean difference: −4.40 bpm, 95% confidence interval −7.15, −1.66) and Day 7 in the 0.8 mg group [−3.85 bpm (−6.58, −1.11)] compared with placebo, but these changes were smaller than those with fingolimod on Day 1 [−6.49 bpm (−8.95, −4.02)]. No clinically significant bradyarrhythmia or cardiac functional abnormalities were observed in either amiselimod group. Both amiselimod doses were well tolerated and no serious adverse events were reported. Fingolimod was also generally well tolerated, although one subject was withdrawn owing to highly frequent 2:1 atrioventricular blocks on Day 1.
Conclusion
The study demonstrated a more favourable cardiac safety profile for amiselimod than fingolimod when administered over 28 days in healthy subjects.
Keywords: amiselimod (MT‐1303), cardiac effects, fingolimod, healthy subject, sphingosine 1‐phosphate
What is Already Known About this Subject
Fingolimod is the first sphingosine 1‐phosphate (S1P) receptor modulator approved for the treatment of relapsing–remitting multiple sclerosis (RRMS).
At initiation of fingolimod treatment, at least 6 h of cardiac monitoring is required due to its known negative chronotropic effect.
Amiselimod is a selective S1P1 receptor modulator which has been shown to have a strong anti‐inflammatory effect in patients with RRMS, yet without any significant cardiac adverse effects.
What this Study Adds
Amiselimod demonstrated a more favourable cardiac safety profile than fingolimod over 28‐day administration.
Unlike fingolimod, there were no clinically relevant cardiac adverse effects observed with amiselimod at doses up to 0.8 mg. Dose titration was not necessary.
Cardiac safety monitoring after the first dose of amiselimod is therefore considered unwarranted.
Tables of Links
| TARGETS |
|---|
| G protein‐coupled receptors 2 |
| S1P1 receptor |
| S1P2 receptor |
| S1P3 receptor |
| S1P4 receptor |
| S1P5 receptor |
| Voltage‐gated ion channels 3 |
| G‐protein‐activated inward‐rectifier K channel (Kir3.1) |
| G‐protein‐activated inward‐rectifier K channel (Kir3.2) |
| G‐protein‐activated inward‐rectifier K channel (Kir3.3) |
| G‐protein‐activated inward‐rectifier K channel (Kir3.4) |
| LIGANDS |
|---|
| Sphingosine 1‐phosphate |
| Amiselimod |
| Fingolimod |
| Fingolimod phosphate |
| Siponimod (BAF312) |
| Ponesimod |
| Ozanimod (RPC‐1063) |
These Tables list key protein targets and ligands in this article that are hyperlinked to corresponding entries in http://www.guidetopharmacology.org, the common portal for data from the IUPHAR/BPS Guide to PHARMACOLOGY 1, and are permanently archived in the Concise Guide to PHARMACOLOGY 2015/16 2, 3.
Introduction
Fingolimod (FTY720, Gilenya®) is the first sphingosine 1‐phosphate (S1P) receptor modulator approved for the treatment of relapsing–remitting multiple sclerosis (RRMS) 4. The therapeutic effects of fingolimod are primarily obtained by functional antagonism of the lymphocytic sphingosine 1‐phosphate 1 (S1P1) receptor, which consequently inhibits S1P1‐dependent lymphocyte egress from secondary lymphoid organs to the periphery, decreases circulating lymphocytes including autoreactive T cells, and exhibits immunomodulatory effects 5. The efficacy of fingolimod has been demonstrated in clinical trials in patients with RRMS 6, 7, 8. However, fingolimod is known to cause a transient reduction in heart rate (HR), which typically occurs within 6 h of dosing 9, 10. This is thought to be due to the agonistic activity of fingolimod phosphate (fingolimod‐P; the active metabolite of fingolimod) at S1P1 and/or S1P3 receptors on atrial myocytes, resulting in activation of the G protein‐coupled inwardly rectifying potassium (GIRK) channel 11, 12, 13, 14, 15, 16, 17. This acute negative chronotropic effect caused by fingolimod has led to a recommendation in the prescribing information to monitor all patients for at least 6 h after the first dose 4.
Amiselimod (also known as MT‐1303) is an oral selective S1P1 receptor modulator which is currently being developed for the treatment of various autoimmune diseases. Amiselimod is converted to its active metabolite, amiselimod phosphate (amiselimod‐P) in vivo and, unlike fingolimod‐P, amiselimod‐P has little agonistic activity at human S1P3 receptors 18. In addition, amiselimod‐P has shown a significantly attenuated potential to activate the GIRK channel in human atrial myocytes compared with fingolimod‐P in an in vitro GIRK channel assay 18. The favourable cardiac safety profile of amiselimod has also been demonstrated in human subjects: In a phase I multiple ascending dose study in healthy subjects, no clinically significant negative chronotropic/dromotropic effects were observed at doses up to 0.75 mg 18. In the phase II study, which enrolled more than 400 patients with RRMS, amiselimod up to 0.4 mg has shown a benign safety profile in addition to its superior efficacy to the placebo control 19.
The aim of the present phase I study was further to examine and characterize the cardiac effects of amiselimod in healthy subjects. For this purpose, the safety and tolerability of two selected doses of amiselimod were evaluated and compared with placebo (in a double‐blind manner) and open‐label fingolimod (0.5 mg; an approved therapeutic dose) as an active control. The anticipated therapeutic dose of amiselimod was considered to be 0.4 mg, whereas 0.8 mg was chosen as a supratherapeutic dose 18, 19. As the potential negative chronotropic/dromotropic and inotropic effects were of particular interest, frequent Holter electrocardiogram (ECG) and echocardiography assessments were performed throughout the study (see Methods for details). In addition, the potential pulmonary effect was assessed by pulmonary function testing using spirometry. Other safety and tolerability parameters, including vital signs, 12‐lead ECG, safety laboratory values and adverse events (AEs), were also evaluated.
Methods
Subject selection
Healthy males (≥60 kg) and females (≥50 kg) of nonchildbearing potential, aged 18–55 years with a body mass index (BMI, Quetelet index) of 18–30 kg m–2, were eligible for the study. Subjects were required to have normal or no clinically significant 12‐lead ECG findings, with a HR of 50–85 bpm and corrected QT interval using the Fridericia formula (QTcF) of ≤450 ms at screening, Day −2 and at predose on Day 1. Subjects were also required to have no clinically significant abnormalities in the 24‐h Holter ECG at screening, including an ectopic beat rate of less than 0.5% of total beats and no second‐degree or higher atrioventricular (AV) block (occasional nocturnal Mobitz type I AV block was acceptable). Vital signs were required to be within normal ranges, including systolic blood pressure (90–140 mmHg) and diastolic blood pressure (50–90 mmHg). Subjects were excluded if they had taken any prescribed or nonprescribed medications within 14 days prior to the first dose administration, if they had ever taken any S1P receptor modulator and if they had any evidence or history of clinically relevant diseases, including endocrine, thyroid, hepatic, respiratory, gastrointestinal, renal or cardiovascular diseases; eye disorders; or a history of psychiatric/psychotic disorders, tuberculosis or alcohol/drug abuse. Other exclusion criteria included positive tests for pregnancy, hepatitis B and C, and human immunodeficiency virus (type 1 or 2); negative test for herpes zoster/varicella immunoglobulin G; any clinically relevant physical findings or safety laboratory values at screening or Day −2; and lymphocyte counts <1.00 × 10⁹ l–1 at screening or Day −2.
Study design and treatments
This was a single‐centre, randomized, parallel‐group, partially blinded, placebo‐controlled, multiple oral dose clinical study. It consisted of the screening period (Days −28 to −3), the confinement period (Days −2 to 30) and the follow‐up period (Days 35 to 77) (Figure S1). Following the screening, eligible subjects were admitted to the clinical unit on Day −2, where they remained until Day 30. The consumption of food or drink containing alcohol was not allowed in the 48 h before screening, until completion of Day 30 post‐treatment assessments. Food or drink containing caffeine and methylxanthine (e.g. coffee, tea, cola, energy drinks or chocolates) was also banned in the 36 h before Day −2, until completion of Day 30. Baseline assessments were conducted on Day −2 (for echocardiography and spirometry), Day −1 (for Holter ECG) and at predose on Day 1 (for 12‐lead ECG and lymphocyte count). Follow‐up assessments were conducted on Days 35, 42, 56 and 77. On Day 42, all subjects were required to stay in the unit for 24‐h Holter ECG. All Holter data were analysed centrally and reported by independent, treatment‐blind board‐certified cardiologists at Quintiles Cardiac Safety Services (Mumbai, India).
On Day −1, all eligible subjects received a single‐blinded dose of placebo and were then randomized (in a 1:1:1:1 ratio) to receive either amiselimod 0.4 mg, amiselimod 0.8 mg, placebo matching to amiselimod or fingolimod 0.5 mg. After confirmation of study eligibility on Day 1, randomized subjects received a once‐daily dose of the study medication at approximately the same time in the morning of Days 1 to 28. Amiselimod and its matching placebo were administered in a double‐blind manner, whereas fingolimod was administered in an open‐label manner. The lymphocyte and white blood cell counts data were blinded at all postdose time‐points to all study personnel (except safety laboratory staff) during the study. The trial was registered with EudraCT, number 2014–001520‐29.
The study was conducted at a single study site (Covance CRU Ltd., Leeds, UK) in accordance with the 2013 (Fortaleza) revision of the 1964 Declaration of Helsinki, Good Clinical Practice as required by the International Conference on Harmonization guidelines, applicable regional and local legislation, and standard operating procedures in place at Mitsubishi Tanabe Pharma Europe Ltd. The study was approved by the ethics committee [the National Research Ethics Service (NRES) Committee North East, York, UK (reference number 14/NE/0139)] and regulatory authority [the Medicines and Healthcare products Regulatory Agency (MHRA), London, UK]. All subjects provided written informed consent prior to screening.
Study assessments
Chronotropic and dromotropic effects were evaluated using continuous, 24‐h Holter ECG (M3R, 3‐channel Holter recorder, Global Instrumentation, Manlius, NY, USA) on Days −1 (baseline), 1, 2, 7, 14, 21, 28 and 42. On each Holter assessment day, the recording was started 1 h prior to the dosing time and therefore included the 1 h predose interval and 23 hourly postdose intervals. For Day 42 in the follow‐up period, Day 1 dosing time was used to define hourly intervals. Mean hourly HR was derived from the Holter recording as the average HR at each hourly interval. All arrhythmic events detected by Holter ECG were analysed consistently as per the Holter Alert Criteria, which consist of 27 predefined arrhythmic parameters (Table S1). Echocardiography (two‐dimensional and Doppler) was performed on Days −2 (baseline), 1, 14, 28 and 42 to measure stroke volume (SV), cardiac output (CO), systemic vascular resistance (SVR) and ejection fraction (EF). Pulmonary function was evaluated using spirometry on Days −2 (baseline), 13, 27 and 35 to measure the forced expiratory volume in 1 s (FEV1), forced vital capacity (FVC), forced expiratory flow at 25% to 75% of forced vital capacity (FEF25–75) and the percentage of the vital capacity that is expired in the first second of maximal expiration (FEV1/FVC). As a pharmacodynamic parameter, lymphocyte count was measured on Day 1 (at predose as baseline and 4, 8, 12, 16 h postdose), Day 2 (24 h), Day 7 (144, 148, 152, 156 and 160 h), Day 8 (168 h), Day 14 (312, 316, 320, 324 and 328 h), Day 15 (336 h), Day 21 (480, 484, 488, 492 and 496 h), Day 22 (504 hs), Day 28 (648, 652, 656, 660 and 664 h), Day 29 (672 h), Day 35 (816 h), Day 42 (984 h), Day 56 (1320 h) and Day 77 (1824 h). To measure the concentrations of amiselimod/amiselimod‐P in plasma, blood samples were collected at the same time points as lymphocyte counts. Blood samples for the measurement of fingolimod/fingolimod‐P in whole blood were taken at predose (i.e. trough concentration) on Day 1, Day 2 (24 h), Day 7 (144 h), Day 14 (312 h), Day 21 (480 h), Day 28 (648 h), Day 35 (816 h), Day 42 (984 h), Day 56 (1320 h) and Day 77 (1824 h) (see Supporting Information for analytical methods). Other safety and tolerability parameters, including vital signs, 12‐lead ECG (HR, RR, PR, QRS, QT and QTcF intervals), safety laboratory values and AEs, were also assessed during the study.
Statistical analyses
Mean hourly HRs from 1 h predose to 23 h postdose intervals were analysed as a repeated measure using a generalized linear mixed model, including a fixed effect of treatment‐by‐hour‐by‐visit and baseline mean hourly HR (at predose on Day −1) as a covariate. A Kronecker product correlation structure was used to model the within‐subject variance covariance errors. The Kenward–Roger approximation was used to estimate the denominator degrees of freedom. Least squares (LS) means (in mean hourly HRs) vs. the hour, together with 95% confidence bands, were plotted. Negative chronotropic effects were also evaluated using nadir (1–6 h), nadir (1–12 h), nadir (12–23 h) and nadir (1–23 h), which were defined as the lowest mean hourly HR at each postdose time period on each day. Changes from baseline in nadirs, where baseline was the derived parameters on Day −1, were analysed using the mixed model for repeated measures (MMRM), including treatment and scheduled visit as fixed effects, the corresponding baseline‐derived parameter on Day −1 as a covariate, and treatment‐by‐visit and baseline‐by‐visit interactions. An unstructured correlation structure was used to model the within‐subject variance covariance errors. P‐values on treatment differences vs. placebo by visit were calculated. No multiplicity adjustments were made as this was an exploratory phase I study. The negative dromotropic effect was evaluated using arrhythmic parameters defined in the Holter Alert Criteria (Table S1), which were summarized using descriptive statistics. For the inotropic and pulmonary assessments, observed values in all predefined parameters (SV, CO, SVR and EF in echocardiography, and FEV1, FVC, FEF25–75 and FEV1/FVC in spirometry) were summarized at each scheduled visit by treatment groups using descriptive statistics.
Pharmacodynamic and other safety assessments were summarized using appropriate descriptive statistics. Pharmacokinetic parameters, including maximum plasma concentration (Cmax) and area under the plasma concentration–time curve after administration (AUCτ), were calculated for amiselimod/amiselimod‐P. A half‐life (t ½) was calculated for amiselimod/amiselimod‐P and fingolimod/fingolimod‐P. Pharmacokinetic parameters were derived by noncompartmental (linear–linear model) analysis using WinNonlin® Professional version 6.3 (Pharsight, Princeton, NJ, USA) and summarized using descriptive statistics. Nadir (1–6 h) mean hourly HRs were plotted against nadir lymphocyte counts at postdose on Day 1 on a scatter plot with a regression line for each treatment, with 80% confidence bands. The same analysis was performed by plotting the lowest nadir (1–6 h) mean hourly HRs vs. nadir lymphocyte counts during the 28‐day treatment period. All statistical analyses were conducted using SAS version 9.2 or later.
Sample size was not based on a formal statistical calculation because this was a phase I exploratory study. The sample size was planned primarily to characterize the chronotropic/dromotropic and inotropic effects of amiselimod. A total of 80 subjects (20 per treatment group) were considered sufficient for this purpose.
Results
Study population
A total of 81 subjects were randomized to the amiselimod 0.4 mg (n = 21), amiselimod 0.8 mg (n = 19), placebo (n = 21) and fingolimod 0.5 mg (n = 20) groups. Two subjects randomized in the amiselimod 0.4 mg group were withdrawn from the study before receiving the amiselimod dose (one owing to an AE on Day −1 and one because of a low HR at predose on Day 1). Therefore, 79 subjects were included in the safety population, with 19, 19, 21 and 20 subjects in the amiselimod 0.4 mg, amiselimod 0.8 mg, placebo and fingolimod groups, respectively (Table 1). Three subjects were withdrawn from the study after Day 1: one in the fingolimod group was withdrawn on Day 1 owing to a serious AE (SAE) (see Tables 3 and 4 for more details), one in the fingolimod group was lost to follow‐up on Day 44 and one in the placebo group withdrew consent on Day 4. Demographics and baseline characteristics were generally well balanced across the treatment groups. Overall, the mean age of the subjects was 34 years (range 19–55 years), the mean weight was 79.0 kg (range 60.8–103.8 kg) and the mean BMI was 25.1 kg m–2 (range 19.9–29.5 kg m–2). All subjects were male.
Table 1.
Subject demographics and baseline characteristics
| Placebo (N = 21) | Amiselimod 0.4 mg (N = 19) | Amiselimod 0.8 mg (N = 19) | Fingolimod 0.5 mg (N = 20) | Total (N = 79) | ||
|---|---|---|---|---|---|---|
| Age (years) | Mean (SD) | 32.9 (10.1) | 38.5 (11.5) | 30.3 (8.3) | 34.2 (8.5) | 34.0 (9.9) |
| Range | (20, 53) | (23, 55) | (22, 49) | (19, 52) | (19, 55) | |
| Race a | White | 17 (81.0%) | 15 (78.9%) | 14 (73.7%) | 16 (80.0%) | 62 (78.5%) |
| Black or African American | 2 (9.5%) | 1 (5.3%) | 1 (5.3%) | 4 (20.0%) | 8 (10.1%) | |
| Asian | 1 (4.8%) | 0 (0.0%) | 3 (15.8%) | 0 (0.0%) | 4 (5.1%) | |
| Other | 1 (4.8%) | 3 (15.8%) | 1 (5.3%) | 0 (0.0%) | 5 (6.3%) | |
| Weight (kg) | Mean (SD) | 78.35 (10.05) | 78.53 (9.41) | 76.97 (12.11) | 82.16 (11.44) | 79.03 (10.76) |
| Range | (62.8, 102.0) | (64.3, 96.5) | (60.8, 103.8) | (62.9, 102.4) | (60.8, 103.8) | |
| BMI (kg m–2) | Mean | 25.22 (2.37) | 24.94 (2.68) | 24.09 (2.86) | 26.16 (2.42) | 25.12 (2.64) |
| Range | (21.8, 28.9) | (21.2, 29.5) | (19.9, 29.3) | (22.2, 29.4) | (19.9, 29.5) | |
BMI, body mass index; SD, standard deviation
Percentages are based on the number of subjects in each treatment group. All subjects were male.
Table 3.
Negative chronotropic and dromotropic effects assessed by the Holter Alert Criteria
| Placebo (N = 21) | Amiselimod 0.4 mg (N = 19) | Amiselimod 0.8 mg (N = 19) | Fingolimod 0.5 mg (N = 20) | |
|---|---|---|---|---|
| Bradycardia a Bradycardia minimum at heart rate ≤40 bpm lasting ≥30 s | ||||
| Baseline (Day −1) | 0 | 1 (5.3%) | 0 | 1 (5.0%) |
| Day 1 | 0 | 1 (5.3%) | 0 | 2 (10.0%) |
| Day 2 | 0 | 1 (5.3%) | 0 | 4 (20.0%) |
| Day 7 | 0 | 1 (5.3%) | 1 (5.3%) | 2 (10.0%) |
| Day 14 | 0 | 0 | 1 (5.3%) | 1 (5.0%) |
| Day 21 | 0 | 1 (5.3%) | 1 (5.3%) | 0 |
| Day 28 | 0 | 0 | 0 | 0 |
| Day 42 | 0 | 0 | 0 | 0 |
| Atrioventricular (AV) block b First degree AV block (PR interval >220 ms) | ||||
| Baseline (Day −1) | 0 | 0 | 1 (5.3%) | 2 (10.0%) |
| Day 1 | 0 | 0 | 1 (5.3%) | 1c (5.0%) |
| Day 2 | 0 | 0 | 1 (5.3%) | 1c (5.0%) |
| Day 7 | 1 (4.8%) | 0 | 0 | 0 |
| Day 14 | 1 (4.8%) | 0 | 0 | 0 |
| Day 21 | 0 | 0 | 0 | 1 (5.0%) |
| Day 28 | 1 (4.8%) | 0 | 0 | 0 |
| Day 42 | 2 (9.5%) | 0 | 0 | 0 |
| Mobitz Type I (Wenckebach) 2nd degree AV block | ||||
| Baseline (Day −1) | 0 | 2 (10.5%) | 2 (10.5%) | 0 |
| Day 1 | 0 | 1 (5.3%) | 2 (10.5%) | 1c (5.0%) |
| Day 2 | 0 | 0 | 1 (5.3%) | 1c (5.0%) |
| Day 7 | 0 | 1 (5.3%) | 0 | 0 |
| Day 14 | 0 | 0 | 0 | 0 |
| Day 21 | 0 | 0 | 0 | 0 |
| Day 28 | 2 (9.5%) | 0 | 0 | 0 |
| Day 42 | 2 (9.5%) | 0 | 0 | 0 |
| 2:1 AV block | ||||
| Baseline (Day −1) | 0 | 0 | 0 | 0 |
| Day 1 | 0 | 0 | 0 | 1c (5.0%) |
| Day 2 | 0 | 0 | 0 | 0 |
| Day 7 | 0 | 0 | 0 | 0 |
| Day 14 | 0 | 0 | 0 | 0 |
| Day 21 | 0 | 0 | 0 | 0 |
| Day 28 | 0 | 0 | 0 | 0 |
| Day 42 | 0 | 0 | 0 | 0 |
The number of patients was the count of unique patients with at least one valid observation. Data shown as numbers (%)
‘Marked bradycardia minimum at heart rate ≤30 bpm lasting ≥15 s’ and ‘pause ≥3 s’ were not reported in any treatment group
‘Mobitz Type II 2nd degree AV block’, ‘high‐grade AV block’ and ‘complete heart block’ were not reported in any treatment group
One subject reported clinically significant Mobitz Type I AV block (382 episodes), 2:1 AV block (89 episodes) and exacerbation of first‐degree AV block (PR interval >330 ms at postdose) on Day 1, which led to the withdrawal from the study medication
Table 4.
Summary of treatment‐emergent adverse events with an incidence of ≥10% (by System Organ Class)
| Placebo (N = 21) | Amiselimod 0.4 mg (N = 19) | Amiselimod 0.8 mg (N = 19) | Fingolimod 0.5 mg (N = 20) | |
|---|---|---|---|---|
| Summary of treatment‐emergent adverse events (TEAEs) | ||||
| Total number of TEAEs | 68 | 59 | 74 | 89 |
| Subjects with ≥1 TEAE | 18 (85.7%) | 13 (68.4%) | 14 (73.7%) | 19 (95.0%) |
| Subjects with ≥1 serious TEAE | 0 | 0 | 0 | 1a (5.0%) |
| Subject withdrawn due to TEAE | 0 | 0 | 0 | 1a (5.0%) |
| Frequent TEAEs affecting ≥ 10% of subjects in any treatment group | ||||
| General disorders and administration site conditions | 4 (19.0%) | 7 (36.8%) | 10 (52.6%) | 9 (45.0%) |
| Nervous system disorders | 10 (47.6%) | 5 (26.3%) | 6 (31.6%) | 7 (35.0%) |
| Gastrointestinal disorders | 8 (38.1%) | 5 (26.3%) | 4 (21.1%) | 6 (30.0%) |
| Skin and subcutaneous tissue disorders | 4 (19.0%) | 6 (31.6%) | 6 (31.6%) | 7 (35.0%) |
| Respiratory, thoracic and mediastinal disorders | 6 (28.6%) | 4 (21.1%) | 8 (42.1%) | 4 (20.0%) |
| Infections and infestations | 4 (19.0%) | 5 (26.3%) | 5 (26.3%) | 3 (15.0%) |
| Musculoskeletal and connective tissue disorders | 3 (14.3%) | 3 (15.8%) | 4 (21.1%) | 5 (25.0%) |
| Cardiac disorders | 2 (9.5%) | 1 (5.3%) | 3 (15.8%) | 2a (10.0%) |
| Eye disorders | 3 (14.3%) | 0 | 1 (5.3%) | 3 (15.0%) |
| Metabolism and nutrition disorders | 2 (9.5%) | 0 | 1 (5.3%) | 3 (15.0%) |
| Ear and labyrinth disorders | 1 (4.8%) | 1 (5.3%) | 1 (5.3%) | 2 (10.0%) |
| Injury, poisoning and procedural complications | 3 (14.3%) | 0 | 1 (5.3%) | 1 (5.0%) |
| Investigations | 0 | 0 | 0 | 2 (10.0%) |
| Serious TEAEs | ||||
| Cardiac disorders | 0 | 0 | 0 | 1a (5.0%) |
Data shown as numbers (%).
One subject reported clinically significant Mobitz Type I AV block (382 episodes), 2:1 AV block (89 episodes) and exacerbation of first‐degree AV block (PR interval >330 ms at postdose) on Day 1, which led to withdrawal from the study medication
Overview of changes in mean hourly HR over time
The mean hourly HR data from Day −1 to Day 42 are presented in Figure 1. Overall, there was no apparent disturbance of the circadian rhythm of HR in either amiselimod groups or the fingolimod group compared with placebo. At baseline (Day −1), there were no notable differences in mean hourly HR between any of the groups throughout the day. On Day 1, the mean hourly HR profiles for both amiselimod groups were similar to that seen for the placebo group, which was consistent with the profiles observed on Day −1. In the fingolimod group, a rapid decrease in mean hourly HR compared with the placebo group was seen within the first 6 h after dosing on Day 1 and HR remained reduced during the rest of the day. On Day 2, a slight reduction in mean hourly HR was seen throughout the day in both amiselimod groups compared with placebo, although there was no sign of a rapid reduction within the first 6 h postdosing. In the fingolimod group, a marked reduction in mean hourly HR was still present in the first 6 h and no overlap of 95% confidence intervals (CIs) occurred with the placebo group throughout the day. On Day 7, a decrease in mean hourly HR seemed to become most apparent in both amiselimod groups compared with placebo, which was largely limited within the first 12 h after dosing. Notably, the magnitude of the reduction was smaller than that of the fingolimod group at any time. On Day 14, the pattern was similar to that seen on Day 7 for all groups. On Day 21, the effects of both amiselimod doses in mean hourly HR had mostly resolved. On Day 28, there was only a small difference between the amiselimod and placebo groups, whereas the effect of fingolimod was still clearly visible, particularly during the first 12 h of dosing. On Day 42 (14 days after the last dose), the mean hourly HR profiles for all active treatment groups were similar to that seen in the placebo group.
Figure 1.

Mean hourly heart rate (HR) in all treatment groups on Days −1 (baseline), 1, 2, 7, 14, 21, 28 and 42. Results are shown as the least squares (LS) mean, with 95% confidence bands indicated in faded colours. Note: A temporary increase in mean hourly HR was observed at approximately 3–4 h and 10–11 h after dosing in all groups, which corresponded to lunch and dinner mealtimes. The increase was larger for the evening than the daytime meal because subjects were allowed to move off the ward for dinner, whereas they were required to remain on their beds for lunch
Nadir mean hourly HR
The changes from baseline in nadir mean hourly HRs at prespecified time periods on each Holter assessment day are presented in Figure 2. LS mean differences vs. placebo are provided in Table 2. There was no significant change in nadir (1–6 h) mean hourly HR on Day 1 or 2 in either of the amiselimod groups compared with placebo. The lowest nadir (1–6 h) during the 28‐day treatment period was seen on Day 14 in the amiselimod 0.4 mg group (LS mean difference −4.40 bpm, 95% CI −7.15, −1.66) and Day 7 in the amiselimod 0.8 mg group [−3.85 bpm (−6.58, −1.11)] compared with placebo. Both returned to baseline by Day 28. In the fingolimod group, a significant reduction in nadir (1–6 h) occurred on Day 1 [−6.49 bpm (−8.95, –4.02)] compared with placebo, which then became the lowest on Day 2 [−9.18 bpm (−12.42, −5.93)]. Although it gradually increased between Days 7 and 21, a difference from placebo was still evident on Day 28 (LS mean difference −3.39 bpm, 95% CI –6.46, −0.32). Nadir (1–12 h) followed a similar pattern to nadir (1‐6 h) in all groups, as nadir (1–12 h) was generally seen within 6 h postdose. The effect of both amiselimod doses, when evaluated by nadir (1–6 h) and nadir (1–12 h), was consistently smaller than that of fingolimod throughout the 28‐day treatment period. It should be noted that the magnitude of the maximum HR reduction observed in both amiselimod groups over 28 days was smaller than that seen with fingolimod on Day 1.
Figure 2.
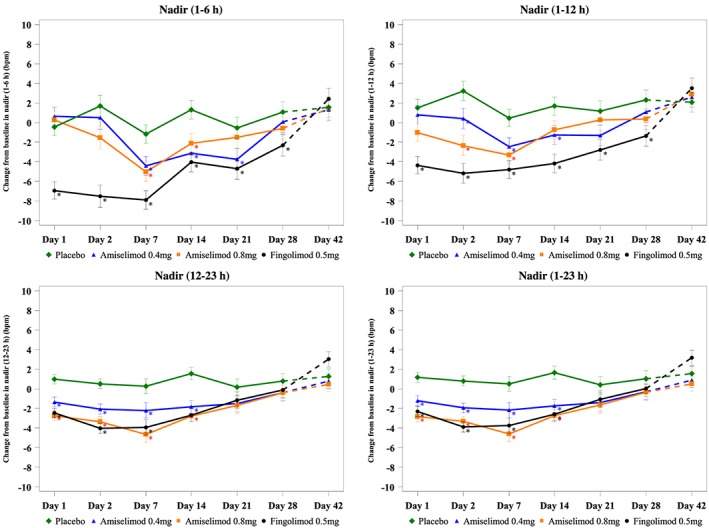
Nadir mean hourly heart rate at each postdose time. Results are shown as least squares mean ± standard error. Dashed curves represent the changes during the follow‐up period. *P < 0.05
Table 2.
Negative chronotropic effect assessed by nadir mean hourly heart rate compared with placebo
| LS mean difference (95% CI) vs. placebo | Amiselimod 0.4 mg (N = 19) | Amiselimod 0.8 mg (N = 19) | Fingolimod 0.5 mg (N = 20) |
|---|---|---|---|
| Day 1 | |||
| Nadir (1–6 h) | 1.11 (−1.38, 3.59) | 0.72 (−1.79, 3.22) | –6.49 (−8.95, −4.02) |
| Nadir (1–12 h) | –0.69 (−3.22, 1.84) | –2.52 (−5.05, 0.01) | –5.83 (−8.33, −3.34) |
| Nadir (12–23 h) | –2.31 (−3.74, −0.88) | –3.69 (−5.12, −2.26) | –3.45 (−4.86, −2.03) |
| Nadir (1–23 h) | –2.40 (−3.88, −0.92) | –4.03 (−5.51, −2.55) | –3.51 (−4.97, −2.04) |
| Day 2 | |||
| Nadir (1–6 h) | –1.16 (−4.43, 2.12) | –3.20 (−6.49, 0.10) | –9.18 (−12.42, −5.93) |
| Nadir (1–12 h) | –2.84 (−5.67, 0.00) | –5.59 (−8.43, −2.75) | –8.42 (−11.23, −5.62) |
| Nadir (12–23 h) | –2.58 (−4.06, −1.11) | –3.88 (−5.35, −2.40) | –4.56 (−6.02, −3.10) |
| Nadir (1–23 h) | –2.76 (−4.18, −1.33) | –4.13 (−5.56, −2.70) | –4.69 (−6.10, −3.28) |
| Day 7 | |||
| Nadir (1–6 h) | –3.24 (−5.94, −0.55) | –3.85 (−6.58, −1.11) | –6.73 (−9.42, −4.04) |
| Nadir (1–12 h) | –2.94 (−5.49, −0.39) | –3.77 (−6.32, −1.22) | –5.27 (−7.81, −2.73) |
| Nadir (12–23 h) | –2.47 (−4.66, −0.27) | –4.92 (−7.12, −2.71) | –4.19 (−6.39, −1.99) |
| Nadir (1–23 h) | –2.70 (−4.87, −0.54) | –5.11 (−7.28, −2.93) | –4.28 (−6.45, −2.12) |
| Day 14 | |||
| Nadir (1–‐6 h) | –4.40 (−7.15, −1.66) | –3.42 (−6.18, −0.66) | –5.33 (−8.07, −2.59) |
| Nadir (1–12 h) | –2.96 (−5.62, −0.29) | –2.43 (−5.10, 0.24) | –5.85 (−8.52, −3.19) |
| Nadir (12–23 h) | –3.39 (−5.20, −1.57) | –4.31 (−6.13, −2.49) | –4.22 (−6.04, −2.41) |
| Nadir (1–23 h) | –3.37 (−5.22, −1.52) | –4.37 (−6.23, −2.52) | –4.23 (−6.08, −2.38) |
| Day 21 | |||
| Nadir (1–6 h) | –3.18 (−6.26, −0.10) | –0.96 (−4.06, 2.14) | –4.13 (−7.20, −1.05) |
| Nadir (1–12 h) | –2.50 (−5.44, 0.44) | –0.91 (−3.86, 2.03) | –3.96 (−6.90, −1.01) |
| Nadir (12‐23 h) | –1.68 (−4.09, 0.72) | –1.87 (−4.28, 0.54) | –1.35 (−3.75, 1.06) |
| Nadir (1–23 h) | –1.82 (−4.19, 0.55) | –2.06 (−4.44, 0.31) | –1.50 (−3.87, −0.88) |
| Day 28 | |||
| Nadir (1–6 h) | –1.00 (−4.08, 2.07) | –1.67 (−4.76, 1.42) | –3.39 (−6.46, −0.32) |
| Nadir (1–12 h) | –1.23 (−4.17, 1.70) | –1.93 (−4.87, 1.01) | –3.68 (−6.61, −0.74) |
| Nadir (12–23 h) | –1.18 (−3.45, 1.09) | –1.20 (−3.47, 1.08) | –0.89 (−3.16, 1.38) |
| Nadir (1–23 h) | –1.33 (−3.59, 0.93) | –1.41 (−3.67, 0.86) | –1.00 (−3.26, 1.26) |
| Day 42 | |||
| Nadir (1–6 h) | –0.22 (−3.29, 2.85) | –0.12 (−3.21, 2.97) | 0.85 (−2.25, 3.94) |
| Nadir (1–12 h) | 0.51 (−2.34, 3.37) | 0.80 (−2.06, 3.66) | 1.44 (−1.45, 4.32) |
| Nadir (12–23 h) | –0.49 (−2.62, 1.64) | –0.80 (−2.93, 1.34) | 1.75 (−0.40, 3.91) |
| Nadir (1–23 h) | –0.64 (−2.79, 1.51) | –1.03 (−3.18, 1.12) | 1.63 (−0.55, 3.80) |
Nadir (1–6 h), nadir (1–12 h) and nadir (1–23 h) are the lowest mean hourly heart rate from the dosing time to 6 h, 12 h and 23 h postdose, respectively. Nadir (12–23 h) is the lowest mean hourly heart rate from 12 h postdose to 23 h postdose. Least squares (LS) means and confidence intervals (CIs) are based on a mixed model for repeated measures, with treatment and scheduled visits as fixed effects, baseline‐derived parameter (Day −1) as a covariate and treatment‐by‐visit and baseline‐by‐visit interactions.
The amiselimod 0.4 mg group showed a small reduction (LS mean difference −2.40 bpm, 95% CI −3.88, −0.92) in nadir (1–23 h) mean hourly HR compared with placebo on Day 1. A similar difference was observed on Days 2, 7 and 14, with a return to baseline on Day 28. Both amiselimod 0.8 mg [−4.03 bpm (−5.51, −2.55)] and fingolimod [−3.51 bpm (−4.97, −2.04)] groups showed a comparable level of reduction in nadir (1–23 h) on Day 1, which was larger than that in the amiselimod 0.4 mg group. Nadirs (1–23 h) in both groups were slightly lower on Days 2, 7 and 14 than on Day 1 but no notable difference was observed on Day 21 compared with the amiselimod 0.4 mg group. Nadir (12–23 h) followed a generally similar pattern to nadir (1–23 h) in all groups.
Comprehensive analysis of rhythm abnormalities as per the Holter Alert Criteria
HR and cardiac rhythm were assessed as per the Holter Alert Criteria (Table 3). Mean hourly HR analysis is not sensitive enough to detect ‘short‐term’ bradycardia episodes. To identify such events, three criteria for short‐term bradycardia were defined and evaluated: No episodes of ‘pause ≥3 s’ or ‘marked bradycardia episode at HR ≤30 bpm lasting ≥15 s’ were reported in any treatment group. ‘Bradycardia minimum at HR ≤40 bpm lasting ≥30 s’ was seen more frequently in the fingolimod group compared with both amiselimod groups (Table 3) but none of these episodes were considered to be clinically relevant by the investigator.
All rhythm abnormalities recorded on Holter ECG were also reviewed thoroughly. No significant arrhythmic events were observed in any treatment group, except for one subject in the fingolimod group; a 39‐year‐old Caucasian male subject reported clinically significant Mobitz Type I AV block (382 episodes), 2:1 AV block (89 episodes) and exacerbation of first‐degree AV block (PR interval prolongation was also confirmed in the 12‐lead ECG: 224 ms at baseline, 332 ms at 6 h postdose, 344 ms at 12 h postdose) on Day 1, which led to withdrawal from the study medication (see Other safety and tolerability assessments below). No first‐ or second‐degree AV block of clinical concern occurred in either amiselimod group. Of note, no ventricular or supraventricular tachyarrhythmia of clinical significance was detected in any group.
Potential inotropic effect assessed by echocardiography
Figure 3 shows the mean SV, CO, SVR and EF on Days −2, 1, 14, 28 and 42. None of these parameters showed clinically meaningful changes from baseline (Day −2) in either amiselimod group (Table S2). By contrast, a slightly larger decrease from baseline in the CO was seen in the fingolimod group on Day 1 (mean –0.720 l min–1) and Day 14 (−0.839 l min–1). However, as the mean CO values were above 3.9 l min–1 (reference range 4.0–8.0 l min–1) on both days, these changes were not considered to be clinically significant.
Figure 3.

Changes in echocardiography parameters over time. Echocardiography was performed on Days −2 (baseline), 1, 14, 28 and 42 to measure the stroke volume, cardiac output, systemic vascular resistance and ejection fraction. Results are shown as mean ± standard error. LLN, lower limit of normal; ULN; upper limit of normal
Potential pulmonary effect assessed by spirometry
Figure S2 shows the mean FEV1, FVC, FEF25–75 and FEV1/FVC on Days −2, 13, 27 and 35. There were no clinically relevant changes observed in any treatment group.
Pharmacokinetic assessments
The pharmacokinetic parameters for amiselimod and amiselimod‐P are presented in Table S3. The mean Cmax and AUCτ of amiselimod and amiselimod‐P in the amiselimod 0.8 mg group were approximately double those in the amiselimod 0.4 mg group on each study day. The mean t ½ was similar in both amiselimod groups: 444 h for amiselimod and 443 h for amiselimod‐P in the amiselimod 0.4 mg group, and 432 h for amiselimod and 437 h for amiselimod‐P in the 0.8 mg group. The mean t ½ of fingolimod was 255 h but the mean t ½ of fingolimod‐P could not be calculated owing to its concentration below the lower limit of quantification on Days 42, 56 and 77.
Pharmacodynamic assessments
Peripheral lymphocyte counts decreased in a dose‐dependent manner in the amiselimod groups during the 28‐day treatment period (Figure 4A). The reduction in the amiselimod 0.8 mg group followed a generally similar pattern to that seen in the fingolimod group, whereas the reduction seen in the amiselimod 0.4 mg group was more gradual. On Day 28 (648 h), the mean lymphocyte counts were 0.70 × 10⁹ l–1, 0.55 × 10⁹ l–1 and 0.63 × 10⁹ l–1 in the amiselimod 0.4 mg, 0.8 mg and fingolimod groups, respectively (1.99 × 10⁹ l–1 in placebo), which corresponded to approximately 61%, 73% and 68%, respectively, of lymphocyte reductions from baseline values. No subjects in any treatment group met the protocol‐defined withdrawal criterion of lymphocytopenia (i.e. absolute lymphocyte count ≤0.20 × 10⁹ l–1, confirmed in a subsequent repeat test). After the last drug administration, the fingolimod group showed a faster recovery of lymphocyte count than both amiselimod groups, which would have been in line with the differences in the elimination t ½ between these two compounds. On the last follow‐up day (Day 77; 1824 h), the mean lymphocyte counts returned to 84.3%, 77.1% and 59.8% of baseline values in the fingolimod group, and the amiselimod 0.4 mg and 0.8 mg groups, respectively.
Figure 4.

Changes in peripheral lymphocyte counts (A) during all study periods and (B) on Day 1. Results are shown as mean + standard deviation. The reference range for lymphocyte counts is 0.99–2.99 × 10⁹ l–1. LLN, lower limit of normal; ULN, upper limit of normal
Relationship between the pharmacodynamic effect and negative chronotropic effect
During the first day of drug administration, all active treatment groups followed a generally normal circadian rhythm of lymphocytes (as shown in the placebo group) and the mean lymphocyte counts remained within the reference range (0.99–2.99 × 10⁹ l–1) (Figure 4B). However, the reduction in lymphocyte counts suggested similar but slightly different pharmacodynamic effects of amiselimod and fingolimod on Day 1. To evaluate the potential relationship between the onset of the pharmacodynamic effect and the negative chronotropic effect caused by each drug, we compared nadir lymphocyte counts (1–24 h) and nadir (1–6 h) mean hourly HR on Day 1 (Figure 5A). Overall, neither dose of amiselimod showed a clear relationship between mean hourly HRs and lymphocyte counts, which was similar to the finding in the placebo group. By contrast, the fingolimod group presented lower mean hourly HRs with decreasing lymphocyte counts following the first dose. We further explored whether there was a relationship between the maximum pharmacodynamic effect and negative chronotropic effect during the 28‐day treatment period (Figure 5B). Over 28 days, the lowest nadir (1–6 h) mean hourly HR was generally higher in both amiselimod groups compared with the fingolimod group, regardless of the values of nadir lymphocyte counts. This indicated that there was a notable difference in the negative chronotropic effect caused by the two tested drugs when the similar pharmacodynamic effect on lymphocyte count was achieved.
Figure 5.

Relationship between the pharmacodynamic effect and negative chronotropic effect. Nadir lymphocyte counts and nadir (1–6 h) mean hourly heart rates in all subjects (A) on Day 1 and (B) during the 28‐day treatment period are plotted. Results are shown as mean ± 80% confidence bands
Other safety and tolerability assessments
Both amiselimod doses administered once daily for 28 days were well tolerated in healthy subjects. Most subjects experienced at least one treatment‐related AE during the study, although there was no notable difference between the groups (Table 4). No SAEs were reported and there was no withdrawal due to an AE in either of the amiselimod groups. Fingolimod was also generally well tolerated, although there was one treatment‐related SAE (i.e. clinically significant 2:1 AV block) in the fingolimod group (see Comprehensive analysis of rhythm abnormalities above). This event was judged as mild in intensity as no symptoms of cardiac origin were reported. Apart from this case, there were no AEs and no clinically significant findings in vital signs, 12‐lead ECG or safety laboratory values in any treatment group. Regarding QTcF prolongation, three subjects (one in each active treatment group) had a QTcF of 450–480 ms at one postdose time point during the study. No subjects had a QTcF of >480 ms at any time point. Changes from baseline in QTcF of >30 ms occurred in all groups, with nine subjects (42.9%) in the placebo group, four (21.1%) in the amiselimod 0.4 mg group, eight (42.1%) in the amiselimod 0.8 mg group and eight (40.0%) in the fingolimod group. No subjects in any group had a QTcF prolongation of >60 ms from baseline (Table S4).
Discussion
This study was designed to characterize the cardiac safety profile of amiselimod in healthy subjects. The frequent Holter ECG and echocardiography assessments allowed for a comprehensive evaluation of the potential negative chronotropic/dromotropic and inotropic effects of amiselimod. An anticipated clinical dose (0.4 mg) of amiselimod administered once daily for 28 days achieved >60% of lymphocyte reductions from baseline, which is expected to show some immunomodulatory effects. A supratherapeutic dose (0.8 mg) of amiselimod was included to understand the safety margin of this compound in humans. The addition of the fingolimod group enabled us directly to compare two selected doses of amiselimod with fingolimod, which is the only S1P receptor modulator currently on the market. The data obtained for fingolimod in the present study were consistent with its known cardiac, pharmacodynamic and exposure profiles 10, 17, 20.
The potential for a negative chronotropic effect of amiselimod and fingolimod was evaluated in detail by using Holter ECG parameters; mean hourly HR and short‐term bradycardia defined in the Holter Alert Criteria. All data derived from these parameters clearly demonstrated a lower risk of bradycardia in amiselimod, especially at the 0.4 mg dose, when compared with fingolimod. The difference was most evident during the first 6 h after administration on Day 1, during which amiselimod showed no sign of the first‐dose effects on HR. The lowest nadir (1–6 h) mean hourly HR during the 28‐day treatment period was observed on Day 7 or 14 in the amiselimod groups. However, the magnitude of reduction was still smaller than that seen in the fingolimod group on Day 1, during which cardiac safety monitoring for at least 6 h is recommended 4. The difference in the negative chronotropic effect between the two drugs was also evident when a similar pharmacodynamic effect was observed over 28 days. The short‐term bradycardia episodes of ‘pause ≥3 s’ and ‘marked bradycardia episode at HR ≤30 bpm lasting ≥15 s’ were considered to be medically important as subjects could be symptomatic due to these events. However, no such episodes were reported in any treatment group during the study. The number of AEs, including cardiac disorders, in each amiselimod group was similar to that in the placebo group.
No AV block of clinical concern was detected in either amiselimod group but one subject in the fingolimod group was withdrawn owing to highly frequent 2:1 AV blocks. To date, there have been no clinically significant AV blocks reported in amiselimod phase I and II studies 18, 19. All of these findings suggested that amiselimod up to 0.8 mg is unlikely to induce any significant dromotropic effect in humans, although this hypothesis needs to be further validated in large‐scale and longer‐term studies. All of these data strongly indicate that, unlike fingolimod, patients treated with amiselimod would not require any cardiac safety monitoring after starting treatment.
It is known that S1P1 receptors expressed in ventricular myocytes are involved in changes in cardiac contraction 15, 21. The present study was the first in which an inotropic effect of amiselimod was investigated in humans. The study demonstrated that amiselimod up to 0.8 mg did not show any change in the SV, CO, SVR or EF in healthy subjects. By contrast, a slight decrease in the mean CO was seen in the fingolimod group on Days 1 and 14. This change is likely to reflect the largest HR reduction observed on the same study day in this group.
The mechanisms to explain these differences between amiselimod and fingolimod are not yet well characterized. The previously published data from animal (rodent) studies strongly suggested that the S1P3 receptor is predominantly responsible for a transient bradycardia caused by fingolimod, which has an agonistic affinity to S1P1 and S1P3–5 receptor subtypes 11, 12, 22. However, recent clinical studies revealed that two selective S1P receptor modulators, siponimod (BAF312) and ceralifimod (ONO‐4641), did show a significant HR reduction after the first dose in healthy human subjects, despite their lack of S1P3 agonist activity 23, 24. Thus, it should be noted that pathogenesis of the cardiac signal transduction system in animal models may not necessarily reflect that in humans owing to species differences in basal HR, inherent ion channel expression, the tissue distribution of S1P receptor subtypes or a combination of these factors 23, 25, 26, 27. Indeed, Rey et al. indicated that the effects on HR and AV conduction are caused via activation of the S1P1 receptor in guinea pigs as well as in humans 26. However, such effects in guinea pigs did not completely mimic those in humans; even a high dose of fingolimod (0.1 mg kg–1 per 10 min, intravenously) and ponesimod (30 mg kg–1, orally) did not lower the atrial rate in guinea pigs 26, 27. Mazurais et al. have shown that, in humans, S1P1 receptor mRNA and protein are strongly expressed in atrial, septal and ventricular cardiomyocytes, whereas S1P3 receptor mRNA is only weakly expressed both in atria and ventricles 28. However, further confirmatory studies are necessary because strong expression both of S1P1 and S1P3 receptors in human atrial myocytes has also been reported 29. It is our current understanding that S1P1 agonists which do not bind to S1P3 receptors result in bradyarrhythmia in humans. However, the possibility that S1P3 agonism alone could at least partially contribute to this adverse effect in humans cannot be ruled out at present 14, 15, 16.
Our preclinical studies have previously demonstrated a slower conversion speed of amiselimod to its active metabolite, amiselimod‐P, in human cardiomyocytes as well as a lower distribution of amiselimod‐P in heart tissues in rats compared with fingolimod‐P, both of which are likely to contribute to a gradual internalization of the receptor complex on atrial myocytes 18. In addition, we have reported a significantly weaker potential of amiselimod‐P to activate the GIRK channel in human atrial myocytes compared with fingolimod‐P 18. Based on these findings, it is conceivable that the different kinetics of S1P receptor occupancy and internalization may have an impact on the strength of the S1P downstream signal related to GIRK channel activation. Interestingly, unlike siponimod 23, these unique biological characteristics of amiselimod seen in our preclinical studies were well translated to human subjects, as demonstrated in the present study. The negative chronotropic effect of amiselimod was largely limited up to 12 h after dosing on Days 7 and 14, which may reflect a low distribution of amiselimod‐P in the human heart. After 12 h, compensatory mechanisms by the autonomic nervous systems may intervene to prevent a significant lowering of HR. The findings in the present study were also consistent with those in our previous phase I and II studies in healthy subjects and patients with RRMS, which showed that amiselimod at doses up to 0.75 mg (for 21 days in phase I) and up to 0.4 mg (for 24 weeks in phase II) were well tolerated and did not cause any clinically relevant bradyarrhythmia 18, 19. A long elimination t ½ (approximately 430–450 h) of both amiselimod and amiselimod‐P in humans was also shown in the present study, indicating that both will slowly accumulate to reach their steady‐state concentrations over a period of approximately 10 weeks, with more than 10‐fold accumulation. As it is known that a rapid increase in drug concentration triggers GIRK‐dependent signalling 26, this pharmacokinetic profile would be beneficial to initiate amiselimod treatment; an initial dose has little cardiac effect, and desensitization can be expected to occur gradually over several weeks of accumulation. Thus, amiselimod up to 0.8 mg was administered safely, without the need for a dose titration regimen. By contrast, dose titration was required to attenuate HR reduction following treatment initiation with other selective S1P receptor modulators such as siponimod, ponesimod and ozanimod (RPC‐1063) 30, 31, 32, 33.
The present study had some limitations. (i) This phase I study involved a small number of healthy male subjects at a single study site. A larger‐scale study including females would be necessary to confirm these findings. (ii) The duration of exposure in the study was limited to 28 days, so as not to compromise the safety of the subjects. However, as the maximum HR reduction and its recovery to baseline were confirmed with both drugs, the study duration was deemed sufficient to evaluate the differences between the two drugs on cardiac effects in the acute to subacute phases. (iii) As a result of practical limitations, placebo matching to fingolimod was not available at the time of the study. Therefore, fingolimod was administered in an open‐label manner, rendering the study partially blinded. However, the primary aim of the study was to evaluate the cardiac effects of amiselimod and fingolimod. The ‘objective’ cardiac parameters, such as mean hourly HR, bradyarrhythmia episodes and echocardiography parameters, were all assessed in a blinded manner and without the investigator's judgement. (iv) Because of frequent Holter ECG assessment, a 12‐lead ECG was not performed intensively. Overall, there were no consistent trends in the QTcF interval in any treatment group. However, a thorough QT study is awaited, to evaluate formally the potential effect of amiselimod in QT prolongation. (v) As only trough concentrations of fingolimod and fingolimod‐P were measured, the relationship between drug concentrations and lymphocyte counts and/or HRs in each drug could not be fully explored. However, a weaker negative chronotropic effect by amiselimod was seen when a similar pharmacodynamic effect was achieved.
In summary, the distinct cardiac safety characteristics of amiselimod in humans were successfully demonstrated in the present study. Unlike the observations with some other S1P receptor modulators, there were no clinically significant effects on cardiac rhythm at either of the amiselimod doses tested, especially within 6 h after the first dose. A wider safety margin of amiselimod 0.4 mg dose was also clearly demonstrated. These results strongly suggest that the 6‐h cardiac safety monitoring required after the first dose of fingolimod is considered unwarranted with the use of amiselimod. To our knowledge, amiselimod is the only drug in this class which can be administered without the need of a dose titration regimen and cardiac safety monitoring.
Competing Interests
T.H. and G.d.L.B. are employees of Mitsubishi Tanabe Pharma Europe Ltd. (the European subsidiary of Mitsubishi Tanabe Pharma Corporation). D.W. is a former employee of Mitsubishi Tanabe Pharma Europe Ltd. S.I. is an employee of Mitsubishi Tanabe Pharma Corporation. J.B. is an employee of Covance CRU Ltd. and was the principal investigator in this study. A.J.C. reports receiving personal fees as an adviser/speaker for: Actelion, AstraZeneca, Bayer, Biotronik, Boehringer Ingelheim, Boston Scientific, Bristol‐Myers Squibb, Daiichi, Gilead, GlaxoSmithKline, InfoBionic, Incarda, Johnson and Johnson, Medtronic, Menarini, Merck, Mitsubishi Tanabe Pharma, Novartis, Otsuka, Pfizer, Sanofi, Servier, St Jude Medical and Takeda.
This study was funded and sponsored by Mitsubishi Tanabe Pharma Corporation.
Contributors
T.H. (global medical lead) participated in study design, drafting and reviewing the study protocol, and data analysis and interpretation. T.H. drafted, reviewed and approved the manuscript. D.W. (study physician while the study was conducted), G.d.L.B. (statistician), S.I. (pharmacokineticist) and J.B. (principal investigator) participated in study design, drafting and reviewing the study protocol, data analysis and interpretation, and reviewed and approved the manuscript. A.J.C., as an external expert cardiologist, participated in study design, data analysis and interpretation, and reviewed and approved the manuscript.
Supporting information
Figure S1 Study design
Figure S2 Changes in pulmonary function parameters over time. Spirometry was performed on Days −2 (baseline), 13, 27 and 35 to measure the forced expiratory volume in 1 s (FEV1), forced vital capacity (FVC), the forced expiratory flow at 25% to 75% of forced vital capacity (FEF25–75) and the percentage of the vital capacity that is expired in the first second of maximal expiration (FEV1/FVC). Results are shown as mean ± standard deviation
Supporting info item
Table S1 Holter Alert Criteria
Table S2 Inotropic effect assessed by echocardiography
Table S3 Pharmacokinetics of amiselimod and amiselimod phosphate
Table S4 Categorical analysis for QTcF intervals
Harada, T. , Wilbraham, D. , de La Borderie, G. , Inoue, S. , Bush, J. , and Camm, A. J. (2017) Cardiac effects of amiselimod compared with fingolimod and placebo: results of a randomised, parallel‐group, phase I study in healthy subjects. Br J Clin Pharmacol, 83: 1011–1027. doi: 10.1111/bcp.13203.
References
- 1. Southan C, Sharman JL, Benson HE, Faccenda E, Pawson AJ, Alexander SP, et al. The IUPHAR/BPS Guide to PHARMACOLOGY in 2016: towards curated quantitative interactions between 1300 protein targets and 6000 ligands. Nucl Acids Res 2016; 44 (Database Issue): D1054–D1068. [DOI] [PMC free article] [PubMed] [Google Scholar]
- 2. Alexander SPH, Davenport AP, Kelly E, Marrion N, Peters JA, Benson HE, et al. The Concise Guide to PHARMACOLOGY 2015/16: G protein‐coupled receptors. Br J Pharmacol 2015; 172: 5744–5869. [DOI] [PMC free article] [PubMed] [Google Scholar]
- 3. Alexander SPH, Catterall WA, Kelly E, Marrion N, Peters JA, Benson HE, et al. The Concise Guide to PHARMACOLOGY 2015/16: Voltage‐gated ion channels. Br J Pharmacol 2015; 172: 5904–5941. [DOI] [PMC free article] [PubMed] [Google Scholar]
- 4. Gilenya: summary of product characteristics [online]. Available at http://www.medicines.org.uk/emc/medicine/24443 (last accessed 2 December 2016).
- 5. Chiba K, Matsuyuki H, Maeda Y, Sugahara K. Role of sphingosine 1‐phosphate receptor type 1 in lymphocyte egress from secondary lymphoid tissues and thymus. Cell Mol Immunol 2006; 3: 11–19. [PubMed] [Google Scholar]
- 6. Kappos L, Radue EW, O'Connor P, Polman C, Hohlfeld R, Calabresi P, et al. A placebo‐controlled trial of oral fingolimod in relapsing multiple sclerosis. N Engl J Med 2010; 362: 387–401. [DOI] [PubMed] [Google Scholar]
- 7. Cohen JA, Barkhof F, Comi G, Hartung HP, Khatri BO, Montalban X, et al. Oral fingolimod or intramuscular interferon for relapsing multiple sclerosis. N Engl J Med 2010; 362: 402–415. [DOI] [PubMed] [Google Scholar]
- 8. Calabresi PA, Radue EW, Goodin D, Jeffery D, Rammohan KW, Reder AT, et al. Safety and efficacy of fingolimod in patients with relapsing–remitting multiple sclerosis (FREEDOMS II): a double‐blind, randomised, placebo‐controlled, phase 3 trial. Lancet Neurol 2014; 13: 545–556. [DOI] [PubMed] [Google Scholar]
- 9. Schmouder R, Serra D, Wang Y, Kovarik JM, DiMarco J, Hunt TL, et al. FTY720: placebo‐controlled study of the effect on cardiac rate and rhythm in healthy subjects. J Clin Pharmacol 2006; 46: 895–904. [DOI] [PubMed] [Google Scholar]
- 10. DiMarco JP, O'Connor P, Cohen JA, Reder AT, Zhang‐Auberson L, Tang D, et al. First‐dose effects of fingolimod: pooled safety data from three phase 3 studies. Mult Scler Relat Disord 2014; 3: 629–638. [DOI] [PubMed] [Google Scholar]
- 11. Sanna MG, Liao J, Jo E, Alfonso C, Ahn M‐Y, Peterson MS, et al. Sphingosine 1‐phosphate (S1P) receptor subtypes S1P1 and S1P3, respectively, regulate lymphocyte recirculation and heart rate. J Biol Chem 2004; 279: 13839–13848. [DOI] [PubMed] [Google Scholar]
- 12. Forrest M, Sun S‐Y, Hajdu R, Bergstrom J, Card D, Doherty G, et al. Immune cell regulation and cardiovascular effects of sphingosine 1‐phosphate receptor agonists in rodents are mediated via distinct receptor subtypes. J Pharmacol Exp Ther 2004; 309: 758–768. [DOI] [PubMed] [Google Scholar]
- 13. Koyrakh L, Roman MI, Brinkmann V, Wickman K. The heart rate decrease caused by acute FTY720 administration is mediated by the G protein‐gated potassium channel I. Am J Transplant 2005; 5: 529–536. [DOI] [PubMed] [Google Scholar]
- 14. Takabe K, Paugh SW, Milstien S, Spiegel S. ‘Inside‐out’ signaling of sphingosine‐1‐phosphate: therapeutic targets. Pharmacol Rev 2008; 60: 181–195. [DOI] [PMC free article] [PubMed] [Google Scholar]
- 15. Means CK, Brown JH. Sphingosine‐1‐phosphate receptor signalling in the heart. Cardiovasc Res 2009; 82: 193–200. [DOI] [PMC free article] [PubMed] [Google Scholar]
- 16. Bigaud M, Guerini D, Billich A, Bassilana F, Brinkmann V. Second generation S1P pathway modulators: research strategies and clinical developments. Biochim Biophys Acta 2014; 1841: 745–758. [DOI] [PubMed] [Google Scholar]
- 17. Camm J, Hla T, Bakshi R, Brinkmann V. Cardiac and vascular effects of fingolimod: mechanistic basis and clinical implications. Am Heart J 2014; 168: 632–644. [DOI] [PubMed] [Google Scholar]
- 18. Sugahara K, Maeda Y, Shimano K, Mogami A, Kataoka H, Ogawa K, et al. Amiselimod, a novel sphingosine 1‐phosphate receptor‐1 modulator, has potent therapeutic efficacy for autoimmune diseases, with low bradycardia risk. Br J Pharmacol 2017; 174: 15–27. [DOI] [PMC free article] [PubMed] [Google Scholar]
- 19. Kappos L, Arnold DL, Bar‐Or A, Camm J, Derfuss T, Kieseier BC, et al. Safety and efficacy of amiselimod in relapsing multiple sclerosis (MOMENTUM): a randomised, double‐blind, placebo‐controlled phase 2 trial. Lancet Neurol 2016; 15: 1148–1159. [DOI] [PubMed] [Google Scholar]
- 20. Craig B, Karin M, Olivier JD, Robert S. Pharmacodynamic effect of steady‐state fingolimod on antibody response in healthy volunteers: a 4‐week, randomized placebo‐controlled, parallel‐group, multiple‐dose study. J Clin Pharmacol 2012; 52: 1879–1890. [DOI] [PubMed] [Google Scholar]
- 21. Landeen LK, Dederko DA, Kondo CS, Hu BS, Aroonsakool N, Haga JH, et al. Mechanisms of the negative inotropic effects of sphingosine‐1‐phosphate on adult mouse ventricular myocytes. Am J Physiol Heart Circ Physiol 2008; 294: H736–H749. [DOI] [PubMed] [Google Scholar]
- 22. Hamada M, Nakamura M, Kiuchi M, Marukawa K, Tomatsu A, Shimano K, et al. Removal of sphingosine 1‐phosphate receptor‐3 (S1P3) agonism is essential, but inadequate to obtain immunomodulating 2‐aminopropane‐1,3‐diol S1P1 agonists with reduced effect on heart rate. J Med Chem 2010; 53: 3154–3168. [DOI] [PubMed] [Google Scholar]
- 23. Gergely P, Nuesslein‐Hildesheim B, Guerini D, Brinkmann V, Traebert M, Bruns C, et al. The selective sphingosine 1‐phosphate receptor modulator BAF312 redirects lymphocyte distribution and has species‐specific effects on heart rate. Br J Pharmacol 2012; 16: 1035–1047. [DOI] [PMC free article] [PubMed] [Google Scholar]
- 24. Krösser S, Wolna P, Fischer TZ, Boschert U, Stoltz R, Zhou M, et al. Effect of ceralifimod (ONO‐4641) on lymphocytes and cardiac function: randomized, double‐blind, placebo‐controlled trial with an open‐label fingolimod arm. J Clin Pharmacol 2015; 55: 1051–1060. [DOI] [PubMed] [Google Scholar]
- 25. Gergely P, Wallström E, Nuesslein‐Hildesheim B, Bruns C, Zécri F, Cooke N, et al. Phase I study with the selective S1P1/S1P5 receptor modulator BAF312 indicates that S1P1 rather than S1P3 mediates transient heart rate reduction in humans. Mult Scler 2009; 15: S125–S126. [Google Scholar]
- 26. Rey M, Hess P, Clozel M, Delahaye S, Gatfield J, Nayler O, et al. Desensitization by progressive up‐titration prevents first‐dose effects on the heart: guinea pig study with ponesimod, a selective S1P1 receptor modulator. PLoS One 2013; 8: e74285. [DOI] [PMC free article] [PubMed] [Google Scholar]
- 27. Yagi Y, Nakamura Y, Kitahara K, Harada T, Kato K, Ninomiya T, et al. Analysis of onset mechanisms of a sphingosine 1‐phosphate receptor modulator fingolimod‐induced atrioventricular conduction block and QT‐interval prolongation. Toxicol Appl Pharmacol 2014; 281: 39–47. [DOI] [PubMed] [Google Scholar]
- 28. Mazurais D, Robert P, Gout B, Berrebi‐Bertrand I, Laville MP, Calmels T. Cell type‐specific localization of human cardiac S1P receptors. J Histochem Cytochem 2002; 50: 661–670. [DOI] [PubMed] [Google Scholar]
- 29. Himmel HM, Meyer Zu Heringdorf D, Graf E, Dobrev D, Kortner A, Schüler S, et al. Evidence for Edg‐3 receptor‐mediated activation of I(K.ACh) by sphingosine‐1‐phosphate in human atrial cardiomyocytes. Mol Pharmacol 2000; 58: 449–454. [DOI] [PubMed] [Google Scholar]
- 30. Legangneux E, Gardin A, Johns D. Dose titration of BAF312 attenuates the initial heart rate reducing effect in healthy subjects. Br J Clin Pharmacol 2013; 75: 831–841. [DOI] [PMC free article] [PubMed] [Google Scholar]
- 31. Brossard P, Scherz M, Halabi A, Maatouk H, Krause A, Dingemanse J. Multiple‐dose tolerability, pharmacokinetics, and pharmacodynamics of ponesimod, an S1P1 receptor modulator: favorable impact of dose up‐titration. J Clin Pharmacol 2014; 54: 179–188. [DOI] [PubMed] [Google Scholar]
- 32. Hoch M, D'Ambrosio D, Wilbraham D, Brossard P, Dingemanse J. Clinical pharmacology of ponesimod, a selective S1P₁ receptor modulator, after uptitration to supratherapeutic doses in healthy subjects. Eur J Pharm Sci 2014; 63: 147–153. [DOI] [PubMed] [Google Scholar]
- 33. Cohen JA, Arnold DL, Comi G, Bar‐Or A, Gujrathi S, Hartung JP, et al. Safety and efficacy of the selective sphingosine 1‐phosphate receptor modulator ozanimod in relapsing multiple sclerosis (RADIANCE): a randomised, placebo‐controlled, phase 2 trial. Lancet Neurol 2016; 15: 373–381. [DOI] [PubMed] [Google Scholar]
Associated Data
This section collects any data citations, data availability statements, or supplementary materials included in this article.
Supplementary Materials
Figure S1 Study design
Figure S2 Changes in pulmonary function parameters over time. Spirometry was performed on Days −2 (baseline), 13, 27 and 35 to measure the forced expiratory volume in 1 s (FEV1), forced vital capacity (FVC), the forced expiratory flow at 25% to 75% of forced vital capacity (FEF25–75) and the percentage of the vital capacity that is expired in the first second of maximal expiration (FEV1/FVC). Results are shown as mean ± standard deviation
Supporting info item
Table S1 Holter Alert Criteria
Table S2 Inotropic effect assessed by echocardiography
Table S3 Pharmacokinetics of amiselimod and amiselimod phosphate
Table S4 Categorical analysis for QTcF intervals