

Abstract
Peroxisome proliferator-activated receptor-α (PPARA) is a nuclear transcription factor and key mediator of systemic lipid metabolism. Prolonged activation in rodents causes hepatocyte proliferation and hepatocellular carcinoma. Little is known about the contribution of nonparenchymal cells (NPCs) to PPARA-mediated cell proliferation. NPC contribution to PPARA agonist-induced hepatomegaly was assessed in hepatocyte (Ppara△Hep)- and macrophage (Ppara△Mac)-specific Ppara null mice. Mice were treated with the agonist Wy-14643 for 14 days, and response of conditional null mice was compared with conventional knockout mice (Ppara−/−). Wy-14643 treatment caused weight loss and severe hepatomegaly in wild-type and Ppara△Mac mice, and histological analysis revealed characteristic hepatocyte swelling; Ppara△Hep and Ppara−/− mice were protected from these effects. Ppara△Mac serum chemistries, as well as aspartate aminotransferase and alanine aminotransferase levels, matched wild-type mice. Agonist-treated Ppara△Hep mice had elevated serum cholesterol, phospholipids, and triglycerides when compared with Ppara−/− mice, indicating a possible role for extrahepatic PPARA in regulating circulating lipid levels. BrdU labeling confirmed increased cell proliferation only in wild-type and Ppara△Mac mice. Macrophage PPARA disruption did not impact agonist-induced upregulation of lipid metabolism, cell proliferation, or DNA damage and repair-related gene expression, whereas gene expression was repressed in Ppara△Hep mice. Interestingly, downregulation of inflammatory cytokines IL-15 and IL-18 was dependent on macrophage PPARA. Cell type-specific regulation of target genes was confirmed in primary hepatocytes and Kupffer cells. These studies conclusively show that cell proliferation is mediated exclusively by PPARA activation in hepatocytes and that Kupffer cell PPARA has an important role in mediating the anti-inflammatory effects of PPARA agonists.
Keywords: peroxisome proliferator-activated receptor-α, Wy-14643, proliferation, Kupffer cell, fibrate
peroxisome proliferator-activated receptors are a family in the nuclear receptor superfamily. There are three members of this family, namely peroxisome proliferator-activated receptor α (PPARA), β/δ (PPARD), and γ (PPARG). All members play a role is regulating metabolic and inflammatory pathways, making them important therapeutic targets. PPARA was the first member to be identified, and activation was found to increase peroxisome proliferation in hepatocytes. Subsequent studies determined PPARA activation upregulates enzymatic pathways involved in lipid transport, lipid oxidation, and ketogenesis, thereby facilitating the metabolic remodeling required for cells and tissues to use fatty acids as an energy source (5). Physiologically, PPARA is activated during fasting and also under pathophysiological conditions where fatty acids are in surplus, such as during high-fat diet-induced obesity (33). PPARA endogenous ligands comprise a wide variety of structurally diverse lipids, including unsaturated and saturated fatty acids, fatty acyl-CoA species, oxidized fatty acids, and oxidized phospholipids (10, 21, 25). Nutritional status is reflected in systemic free fatty acid levels. Therefore, PPARA acts as a key metabolic sensor that responds to and regulates circulating lipid concentrations by promoting their catabolism.
Prolonged PPARA activation by either endogenous or exogenous compounds causes hepatocyte swelling, suppressed apoptosis, and hepatocellular proliferation leading to hepatomegaly and eventually the development of hepatic adenomas and carcinomas in mice and rats (13). Interestingly, agonist-induced cell proliferation is only observed in rodents and has become a definitive toxicological model of how compounds can act as species-specific carcinogens; comparable phenotypic and pathophysiological consequences of prolonged agonist treatment are not observed in humans. In fact, the metabolic effects of the fibrate class of drugs, including bezafibrate, gemfibrizil, nafenopin, and others that have been used clinically for decades as lipid-lowering agents, all act through human PPARA. Differential response to these compounds provides a unique opportunity to compare and contrast the transcriptional and biochemical alterations driving carcinogenesis. In rodents, cancer development proceeds through a nongenotoxic mechanism and is thought to be at less partially driven by a sustained increase in reactive oxygen species generated in response to excess energy burning in the liver as the result of elevated levels of mitochondrial and peroxisomal fatty acid β-oxidation (49). The requirement for receptor activation on cancer progression was conclusively shown using Ppara-null mice. Disruption of the Ppara gene completely protects mice from hepatocyte proliferation in response to agonist treatment (49). In addition, Ppara-null mice do not respond to the triglyceride (TG)-lowering effects of agonist treatment, supporting a direct role for PPARA in the control of lipid homeostasis. Studies using conventional Ppara-null mice have shed light on the metabolic impact of systemic PPARA deficiency. However, the pleotropic effects of PPARA activation could potentially be explained by differential functions within various cells and tissues.
The liver is composed of parenchymal hepatocytes and nonparenchymal cells (NPCs), which include cholangiocytes, stellate cells, endothelial cells, and phagocytic Kupffer cells. Hepatocytes make up around 60% of total liver cells but due to their large size occupy almost 80% of liver volume. Over 40% of cells in the liver are NPCs; however, they comprise only 6.5% of the liver volume (22). Each cell type displays a set of specialized functions that support liver function. Although many of these cell types can contribute to the development and progression of liver cancer, little is known about their specific contributions to PPARA agonist-induced control of lipid transport and metabolism and cell proliferation in rodent models (30, 41, 54). Moreover, there is conflicting evidence in the literature on the involvement of NPC PPARA activation. Interestingly, transgenic mice expressing a constitutively active hepatocyte-specific form of PPARA do not develop hepatocellular carcinomas, suggesting that PPARA expression in NPCs may play an important role in this process (39, 53). Moreover, treatment with agents that inactivate Kupffer cells blocked agonist-induced cell proliferation (44). These data suggest a potentially important role for PPARA activation within NPCs and Kupffer cells during PPARA-induced hyperplasia. PPARA agonist treatment of hepatocytes cocultured with NPCs resulted in elevated DNA synthesis and inhibition of apoptosis (15, 16). These effects were not observed when the NPCs were removed; however, hepatocyte-only cultures still exhibited increased β-oxidation, supporting that NPCs are required for proliferation but not peroxisome proliferation or lipid catabolism. Surprisingly, this study also revealed that the addition of NPCs from Ppara-null mice was able to rescue agonist-induced increases in cell proliferation, suggesting that, although NPCs are essential for proliferation, NPC PPARA expression is not required. Furthermore, the use of hepatocytes from Ppara-null mice failed to respond irrespective of the cocultured NPC genotype. Contrary to the above studies, PPARA mRNA was not detected in Kupffer cells isolated from rats, suggesting that the contribution from macrophages may be negligible (36). Another study showed that cultured macrophages responded to treatment with fenofibrate and gemfibrozil by inhibition of secretion of a number of proinflammatory cytokines, including CXCL2, tumor necrosis factor (TNF), IL-6, ERK, and Toll-like receptor (TLR)-4 (1). These effects were prevented by treating with the potent PPARA antagonist GW-6471, providing contrary evidence for active PPARA within macrophages. Interestingly, TNF and IL-6 secretion promotes proliferation of both hepatocellular carcinoma (HCC) and the punitive cancer progenitor cells, commonly referred to as oval cells, which suggests that loss of Kupffer cell PPARA expression may further enhance the proliferative effects of agonist treatment. Another study was also able to show that cross talk between Kupffer cells and hepatocytes impacts the regulation of hepatic TG levels, which was at least partially mediated by macrophage-specific PPARA activation, further complicating the interplay and functional consequences of PPARA activation in various liver cell types (45).
To date, few studies have adequately addressed the impact of agonist treatment on parenchymal and NPCs within the liver and the subsequent contribution to cell proliferation and carcinogenesis. To better understand the influence of PPARA receptor activation in NPCs, and in particular Kupffer cells, hepatocyte- and macrophage-specific Ppara-null mice were generated and treated with Wy-14643 to assess the consequent impact on agonist-induced cell proliferation.
MATERIALS AND METHODS
Generation of conditional Ppara knockout mice.
Targeted ES cells containing a loxP site-flanked exon 5 Ppara allele were obtained from the European Conditional Mouse Mutagenesis (EuCOMM) Program (clone identification EPD0157; Munich, Germany) (Fig. 1A). Microinjection of ES cells in C57BL/6 embryos was performed by the NCI Transgenic Mouse Model Laboratory (Frederick, MD). To generate Ppara floxed (Pparafl/fl) mice, founder lines were screened and positives crossed into flippase recombinase (FLPeR)-expressing transgenic mice (The Jackson Laboratory, Bar Harbor, ME) to remove the FLP recombinase target (Frt) site-flanked selection cassette. Pparafl/fl mice were subsequently crossed with transgenic mice expressing Cre recombinase under control of the albumin (AlbCre) or lysozyme 2 (LysMCre) promoters to generate hepatocyte-specific (Ppara△Hep) or macrophage-specific (Ppara△Mac) knockout mice, respectively. The LysMCre transgenic Cre line was previously described (4, 51). All mouse lines were on a pure C57BL/6 background, and both Cre-positive mouse lines were backcrossed into Pparafl/fl mice for at least eight generations. A list of primers used for genotyping can be found in Table 1.
Fig. 1.
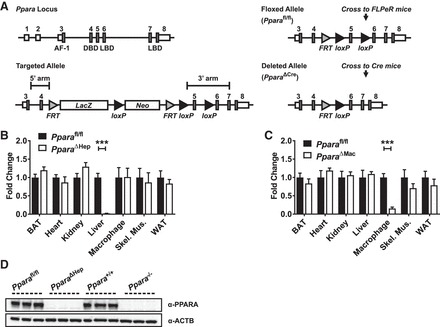
Characterization of tissue-specific peroxisome proliferator-activated receptor-α (Ppara) knockout mice. Gene targeting strategy for generation of floxed Ppara locus (A). Albumin (AlbCre)- and lysozyme 2 (LysMCre)-regulated Cre lines were used to generate hepatocyte-specific (Ppara△Hep) or macrophage-specific (Ppara△Mac) knockout mice, respectively. Tissues were isolated from mice, and qRT-PCR was used to confirm loss of tissue-specific Ppara mRNA expression in Ppara△Hep (B) and Ppara△Mac (C) mice. Values were normalized to Actb mRNA levels and expressed as fold control, Ppara wild-type (Ppara+/+), or Ppara floxed (Pparafl/fl), as indicated. Hepatocyte nuclei were isolated from Ppara+/+, Pparafl/fl, conventional Ppara-null (Ppara−/−), and Ppara△Hep mouse livers. Lysate (50 µg) was separated by SDS-PAGE, and Western blotting was performed to determine PPARA protein expression (D). Blots were reprobed for ACTB as loading control. Experiments were performed on at least 5 animals/group for qRT-PCR experiments. Each data point represents the mean ± SD (***P < 0.001). AF-1, activation function 1 domain; DBD, DNA-binding domain; LBD, ligand-binding domain.
Table 1.
List of genotyping primer sets
| Genotype | Primers |
|---|---|
| Conventional Ppara knockout | GAGAAGTTGCAGGAGGGGATTGTG |
| (Ppara+/+ and Ppara−/−) | CCCATTTCGGTAGCAGGTAGTCTT |
| GCAATCCATCTTGTTCAATGGC | |
| Ppara floxed | CAAGGCCATGTCTAATCATCCTGG |
| (Pparafl/fl) | TCTCATGGATTCAATTGACTGACTGG |
| CAACGGGTTCTTCTGTTAGTCC | |
| Cre-positive mice | GCGGTCTGGCAGTAAAAACTATC |
| (PparaΔHep and PparaΔMac) | GTGAAACAGCATTGCTGTCACTT |
| CTAGGCCACAGAATTGAAAGATCT | |
| GTAGGTGGAAATTCTAGCATCATCC |
Ppara, peroxisome proliferator-activated receptor-α; Ppara+/+, Ppara wild type; Ppara−/−, conventional Ppara-null; Pparafl/fl, Ppara floxed; PparaΔHep, hepatocyte-specific knockout; PparaΔMac, macrophage-specific knockout.
Animal care and treatment.
The Ppara wild-type (Ppara+/+) and conventional Ppara-null (Ppara−/−) mice used in this study were described previously (26). Pparafl/fl, Ppara△Hep, and Ppara△Mac mice were generated as described above. Mice from each genotype were on the C57BL/6 background and used at 8–10 wk of age. Mice were provided a grain-based control diet or matched diet containing 0.1% Wy-14643 for 14 days. Based on average food consumption, mice received a daily dose of Wy-14643 equivalent to ~100–120 mg·kg−1·day−1. This Wy-14643 regimen was previously shown to induce hepatomegaly, increase cell proliferation, and lower circulating TGs in wild-type mice (13, 14, 49). At the end of a 14-day treatment period, the mice were killed, and tissues were harvested. Blood was collected by venipucture of the caudal vena cava. For BrdU studies, the mice were placed on either the control diet or Wy-14643-containing diet for 7 days, and a micro-osmotic pump (no. 1007D; 0.5 µl/h, 7 days; Alzet Osmotic Pumps, Cupertino, CA) containing a sterile BrdU solution (20 mg/ml) was implanted subcutaneously. Following implantation, the mice were provided control or Wy-14643-containing diet for an additional 7 days (14-day treatment total) and then killed by CO2 asphyxiation, and tissue samples were collected for further analysis. Mice were housed in a temperature- and light-controlled vivarium and given food and water ad libitum. All mouse studies were carried out in accordance with protocols approved by the National Cancer Institute Animal Care and Use Committee.
Western blot analysis.
For detection of PPARA protein, nuclear extracts were prepared from liver tissue using the sucrose cushion method from fresh liver as described with slight modification (29). Whole cell lysates were probed for ADGRE1 and CD68 expression. RIPA buffer supplemented with Halt Protease and Phosphatase Inhibitor Cocktail (ThermoFisher, Waltham, MA) and 1 mM PMSF was added to purified nuclei or 30 mg liver tissue for lysis. Protein concentrations were determined using the Pierce BCA Protein Assay Kit (Pierce, Rockford, IL). Fifty micrograms of protein per lane were loaded on a 4–12% Criterion TGX Precast Gel (Bio-Rad, Hercules, CA) and then transferred to PVDF membranes using a Trans-Blot Turbo Transfer System (Bio-Rad). Membranes were blocked in 5% nonfat milk followed by overnight incubation with primary antibody at 4°C. Primary antibodies used are as follows: anti-PPARA (ab24509; Abcam, Cambridge, MA), anti-ADGRE1 (Ab6640; Abcam), anti-CD68 (137002; Biolegend, San Diego, CA), and anti-ACTB (ab8227; Abcam). Following primary antibody (1:1,000) incubation, the blots were washed and incubated with anti-rabbit (no. 7074S; Cell Signaling Technology, Danvers, MA) or anti-rat (SC-2006; Santa Cruz Biotechnology, Dallas, TX) HRP-conjugated secondary antibodies. ADGRE1 blots were reprobed with anti-CD68 after the blots were stripped using Restore Western Blot Stripping Buffer (ThermoFisher). Blot imaging was performed on a ChemiDoc MP System (Bio-Rad) after exposing the blot to Clarity Western ECL Blotting Substrate (Bio-Rad).
Histological staining.
Fresh liver tissue was immediately fixed in 10% phosphate-buffered formalin for 24 h and then processed in paraffin blocks. Four-micrometer sections were used for hematoxylin and eosin (H&E) staining. Sections were processed by HistoServ (Germantown, MD). Slide imaging was performed using a Keyence BZ-X700 series all-in-one microscope with both ×20 and 40 objectives, ×200 and 400 magnification, respectively.
Immunohistochemistry staining of liver sections.
Four-micrometer sections were made from paraffin-embedded tissues for immunohistochemical (IHC) analysis. Sections were deparaffinized and blocked using the Vector Laboratories Avidin/Biotin Blocking Kit followed by immunodetection using a Mouse on Mouse (M.O.M.) Elite Peroxidase kit and ImmPACT DAB Substrate (Vector Laboratories, Burlingame, CA). For BrdU-stained sections, slides were autoclaved for 5 min at 121°C in 10 mM Tris and 25 mM EDTA (pH to 9.0) for antigen retrieval and then processed as previously described using rat anti-BrdU antibody [BU1/75 (ICR1); AbD Serotec, Oxford, UK] (1:200) and a biotinylated goat anti-rat secondary antibody (STAR131B; AbD Serotec) (1:400) (38). Rat anti-ADGRE1 (Ab6640; Abcam) (1:100) and anti-CD68 (137002; Biolegend) (1:100) sections were processed identical to BrdU slides except that a Protease K antigen retrieval step was used in place of autoclaving. All slides were counterstained with Hematoxylin QS (Vector Laboratories). Imaging was performed using a Keyence BZ-X700 series all-in-one microscope with a ×20 objective (×200 magnification) (Keyence, Osaka, Japan). For each liver section, 10 random microscope fields were assessed for positively stained cells. BrdU-positive nuclei were quantified using the Keyence Hybrid Cell Count software module using color extraction mode with size selection. Identical settings were used for analysis of all sections. ADGRE1- and CD68-positive cells were quantified manually due to macrophage morphology. BrdU labeling index represents the percent BrdU-positive nuclei per field of view when compared with the total number of hepatocytes or NPCs. Mouse indexes and cell counts for each treatment group were then averaged, and data were graphed (n < 5).
Intraperitoneal macrophage isolation.
To confirm macrophage-specific Ppara disruption, 8- to 12-wk-old mice were given an intraperitoneal injection of 4% thioglycolate to stimulate macrophage recruitment. Thioglycolate-elicited macrophages were then collected as described with slight modification (40). In brief, 4 days after thioglycolate injections, intraperitoneal macrophages were collected by washing the intraperitoneal cavity with 5 ml of 3% fetal bovine serum (FBS) in PBS. Collected cells were pelleted by centrifugation and resuspended in DMEM with 10% FBS with antibiotics then used to seed six-well plates. After plating, macrophages were purified from other cell types by selective adherence to plastic by incubation at 37°C for 2 h. Cells were then gently washed with PBS to remove nonadherent cells and debris. Remaining macrophages were cultured for an additional 6 h, gently rinsed with PBS, and then directly lysed for RNA purification using TRIzol Reagent (ThermoFisher). Ppara mRNA expression levels were then measured by qRT-PCR.
Primary hepatocyte and Kupffer cell isolation.
Mouse primary hepatocytes and Kupffer cells were isolated from 8- to 12-wk-old mice. Hepatocytes and NPCs were isolated using a two-stage collagenase perfusion technique, as described previously (15, 46). After collagenase perfusion, hepatocytes were separated from NPC cells by centrifugation through Percoll (specific gravity 1.055 g/ml; 400 g, 10 min). The resulting pellets of pure hepatocytes were washed and used to seed six-well plates. Supernatants were then recentrifuged (1,400 g, 6 min) to pellet the mixed population of NPCs. Kupffer cells were then further purified from NPCs by gradient centrifugation as described (27) and finally by selective adherence to plastic by incubation at 37°C for 2 h in DMEM containing 10% FBS with antibiotics. Kupffer cells were then gently washed with PBS to remove nonadherent cells and debris. Adherent Kupffer cells were cultured for an additional 6 h (8 h total). Primary hepatocytes were cultured in William’s E media supplemented with 10% FBS and antibiotics for 8 h. Media for both primary hepatocytes and Kupffer cells were then replaced with the appropriate media containing vehicle (DMSO) or 100 µM Wy-14643. Cells were incubated with Wy-14643 for 16 h, gently rinsed with PBS, and then directly lysed for RNA purification using TRIzol Reagent (Thermo Fisher). Target gene expression was then analyzed by qRT-PCR.
Gene expression analysis.
Total RNA was isolated from fresh liver or macrophages using TRIzol Reagent (Thermo Fisher) and quantified using a NanoDrop spectrophometer (NanoDrop Products, Wilmington, DE). Two micrograms of RNA were reverse transcribed with All-in-One cDNA Synthesis SuperMix (BioTool, Houston, TX) and used for qRT-PCR analysis with 2× SYBR Green qPCR Master Mix (BioTool). Primers were designed for gene specificity and to cross exon-exon junctions using Primer-BLAST (www.ncbi.nlm.nih.gov/tools/primer-blast/) and purchased from IDT DNA Technologies (Coralville, IA). Ppara primers were designed to target excised exon 5 or exon 8 in tissue-specific and conventional knockout mice, respectively. Results are normalized to β-actin expression. qRT-PCR experiments were designed and performed according to Minimum Information for Publication of Quantitative Real-Time PCR Experiments (MIQE) guidelines (3). Values given are fold over control or relative expression value, where appropriate, calculated using the 2ΔCt QPCR calculation method (37). A list of primer sets used for qRT-PCR analysis can be found in Table 2.
Table 2.
List of forward and reverse primers used for qRT-PCR analysis of gene expression
| Gene Symbol | Forward Primer | Reverse Primer |
|---|---|---|
| Acadm | GAACCAGACCTACAGTCGCA | GCTCCACTAGCAGCTTTCCA |
| Acaa1b | GTCCATGACCCTGTCCCAGAG | CCACATTCTCCGAAGTTATCCCCAT |
| Acox1 | GGGCACGGCTATTCTCACAG | CATCAAGAACCTGGCCGTCT |
| Actb | TTCCTTCTTGGGTATGGAATCCTG | GAGGTCTTTACGGATGTCAACG |
| Adgre1 | AAGACTGACAACCAGACGGC | CTGCCTCCACTAGCATCCAG |
| Aurkb | GGGAGAAGAAGAGCCGTTTCA | GTTGGGATGTTTCAGGTGCG |
| Ccnb1 | GCTCTCCATGCTGGACTACG | AGTTGGTGTCCATTCACCGT |
| Ccng2 | GCCCTTATGAAGGTGAAACCG | GTCACCTTCTTCTTCCGCCA |
| Cd3e | CTCAGCCTCCTAGCTGTTGG | TCGTCACTGTCTAGAGGGCA |
| Cd32 | GGGAATCCTGCCGTTCCTAC | CCCAGCAGCAAGATTTAGCAC |
| Cd36 | GATTAATGGCACAGACGCAGC | CAGATCCGAACACAGCGTAGA |
| Cd68 | GACCGCTTATAGCCCAAGGA | TGTGGCTGTAGGTGTCATCG |
| Cdk1 | GACAGAGAGGGTCCGTCGT | GCCAGTGACTCTGTGTCTACC |
| Chek1 | CTCATGGCAGGGGTGGTTTA | CGAAATACCGTTGCCAAGCC |
| Cpt1b | GAACACAAATGTGCAAGCAGC | GCCATGACCGGCTTGATCTC |
| Csf2 | GGGTCTACGGGGCAATTTCA | CACAGTCCGTTTCCGGAGTT |
| Csf2rb | AAGACTGACTGGGTGATGCC | AGAGACACAGCCAAAGCGAA |
| Cyp4a10 | AAGGGTCAAACACCTCTGGA | GATGGACGCTCTTTACCCAA |
| Ehhadh | CGGTCAATGCCATCAGTCCAA | TGCTCCACAGATCACTATGGC |
| Fabp1 | AGTCAAGGCAGTCGTCAAGC | ATGTCGCCCAATGTCATGGT |
| Il1b | GCCACCTTTTGACAGTGATGAG | GACAGCCCAGGTCAAAGGTT |
| Il4 | GGTCTCAACCCCCAGCTAGT | GCCGATGATCTCTCTCAAGTGAT |
| Il10 | GGCGCTGTCATCGATTTCTC | ATGGCCTTGTAGACACCTTGG |
| Il15 | AGGTCTCCCTAAAACAGAGGC | TTGCAACTGGGATGAAAGTCAC |
| Il18 | GTAAGAGGACTGGCTGTGACC | AGGTGGATCCATTTCCTCAAAGG |
| Il1rap | GGCTTTCCTAGGTTCGGCTT | AAGTCCCATCCTTATCGGGC |
| Il1rn | AGTGTGTTCTTGGGCATCCA | CAGTGATGTTAACTTCCTCCAGC |
| Il6ra | TCAACGCCATCTGTGAGTGG | TCCCGTTGGTGGTGTTGATTT |
| Ifng | AACTGGCAAAAGGATGGTGAC | TTGCTGATGGCCTGATTGTC |
| Jun | TGGGCACATCACCACTACAC | TCTGGCTATGCAGTTCAGCC |
| Mcm6 | GCAGGAGTGAAGGCAACTCT | ATGGGCGCTGACAGATTGAT |
| Mki67 | AATCATCAAGGAACGGCCCC | TGCCTGATCTGCGTCTTTGA |
| Ppara Cre KO | CCCTGAACATCGAGTGTCGAA | TTCGCCGAAAGAAGCCCTTA |
| Ppara KO | CTATAATTTGCTGTGGAGATCGGC | GGATGGTTGCTCTGCAGGT |
| Rad51 | GAACAGACTACTCAGGGCGG | GCGACACCAAACTCATCAGC |
| Tnf | ATGGCCTCCCTCTCATCAGT | TGGTTTGCTACGACGTGGG |
| Vegf | CTGCCGTCCGATTGAGACC | CCCCTCCTTGTACCACTGTC |
See text for definitions.
Serum chemistry.
Blood was collected from animals and transferred to BD Microtainer Serum Separator Tubes (Becton Dickinson, Franklin Lakes, NJ). Serum chemistry analysis for total cholesterol, TGs, phospholipids, and nonesterified free fatty acids (NEFA) was performed on using Wako Clinical Diagnostics kits (WakoUSA, Richmond, VA). Serum alanine aminotransferase (ALT) and aspartate aminotransferase (AST) levels were measured using Catachem VETSPEC Kits as recommended by the manufacturer (Catachem, Oxford, CT).
Statistical analysis.
All results are expressed as means ± SD. Significance was determined by t-test or one-way ANOVA with Bonferroni posttest using Prism 6.0 software (GraphPad Software, La Jolla, CA). A P value of < 0.05 was considered significant and is indicated in Figs. 1–10 (P < 0.05, 0.01, and 0.001).
Fig. 10.
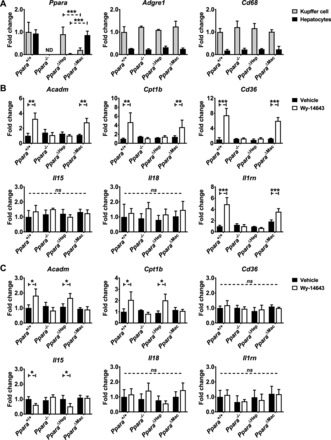
Primary hepatocyte and Kupffer cell cultures confirm differential regulation of Ppara-target gene expression. Primary hepatocyte and Kupffer cell populations were isolated from Ppara+/+, Ppara−/−, Ppara△Hep, and Ppara△Mac mouse livers. Cells were cultured ex vivo and treated with 100 µM Wy-14643 for 16 h. RNA was isolated, and gene expression analysis was performed to elucidate the cell type-specific impact of PPARA activation. Ppara disruption was confirmed in purified hepatocytes from Ppara△Hep mice and Kupffer cells from Ppara△Mac mice (A). Macrophage markers Adgre1 and Cd68 were expressed at similar levels in Kupffer cells from all genotypes. Primary hepatocyte gene expression was assessed after Wy-14643 treatment (B). PPARA target gene mRNAs, including Acadm, Cpt1b, and Cd36, were upregulated. Anti-inflammatory cytokine Il1rn mRNA expression was also upregulated in a hepatocyte-specific Ppara-dependent manner. Kupffer cell cultures revealed slight but significant upregulation of Ppara target gene Acadm and Cpt1b mRNAs and suppression of Il15 mRNA, providing further support for in vivo observations indicating a relationship between macrophage-specific PPARA activation and inflammation (C). Each data point represents the mean ± SD (*P < 0.05, **P < 0.01, and ***P < 0.001). ND, not detectable.
RESULTS
Generation of hepatocyte- and macrophage-specific Ppara knockout mice.
Pparafl/fl mice were generated as described above and then crossed with either hepatocyte- or macrophage-specific Cre recombinase expressing mouse lines to generate Ppara△Hep or Ppara△Mac mice (Fig. 1A). To confirm tissue-specific loss of PPARA expression, tissues from Pparafl/fl, Ppara△Hep, and Ppara△Mac mice were collected and RNA isolated for mRNA analysis. Corresponding tissues from wild-type (Ppara+/+) and conventional full-body knockout (Ppara−/−) mice were collected for comparison. qRT-PCR analysis revealed that, as expected, Ppara−/− mice did not express Ppara mRNA in any tissue analyzed (data not shown). Ppara△Hep and Ppara△Mac mice expressed normal levels of Ppara mRNA in all tissues tested except liver and intraperitoneal macrophages, respectively (Fig. 1, B and C). Ppara expression and response to Wy-14643 was comparable between wild-type and floxed mouse lines. Data for Pparafl/fl mice were not included in many figures to provide for more focus on the Ppara△Hep and Ppara△Mac results. Western blot analysis was used to confirm loss of PPARA protein expression in livers of Ppara−/− and Ppara△Hep mice (Fig. 1E). Together these data confirm the Cre recombinase-mediated targeted disruption of Ppara expression in both hepatocytes and macrophages and support the utility of these mouse lines in studying cell type-specific PPARA functions.
Gross pathophysiological consequences of prolonged PPARA activation are hepatocyte dependent.
Prolonged PPARA activation in rodents has profound physiological and pathophysiological effects. Sustained treatment with potent agonists, such as Wy-14643, causes pronounced peroxisome proliferation, increased oxidative stress, decreased apoptosis, and an increase in hepatocyte proliferation. Together these features led to hepatocyte swelling and pronounced liver enlargement also known as hepatomegaly. Mice were treated with Wy-14643 for 14 days, and total body mass was measured before and after treatment. Ppara+/+, Pparafl/fl, and Ppara△Mac exhibited around a 16% decrease in body mass (Fig. 2, A and B). Ppara−/− and Ppara△Hep mice did not lose weight in response to treatment and instead experienced a slight increase similar to the control groups. There was no discernable difference in weight loss between Ppara△Mac, Ppara+/+, or Pparafl/fl mice on Wy-14643 diet. Weight loss is predominantly due to loss of adipose tissue in response to elevated lipid catabolism, implying that metabolic pathways in the Ppara△Mac animals were not affected. Livers from mice were weighed and liver indexes (mg liver/g body mass) determined (Fig. 2C). These data support pronounced hepatomegaly in Ppara+/+, Pparafl/fl, and Ppara△Mac mice. Liver indexes from Wy-14643-treated Ppara−/− and Ppara△Hep mice were similar to controls. Moreover, pronounced hepatomegaly in Wy-14643-treated Ppara+/+, Pparafl/fl, and Ppara△Mac mice is apparent upon gross liver examination (Fig. 2D). Histological examination of liver sections by H&E staining did not find obvious histological differences between the various genotypes on control diet (Fig. 3A). Staining revealed pronounced hepatocyte swelling in Wy-14643-treated Ppara+/+, Pparafl/fl, and Ppara△Mac mice (Fig. 3B) and supports results from previous published studies (2, 35, 39). Taken together, these data do not support a significant role for PPARA activation within Kupffer cells or other NPCs during agonist-induced hepatomegaly.
Fig. 2.
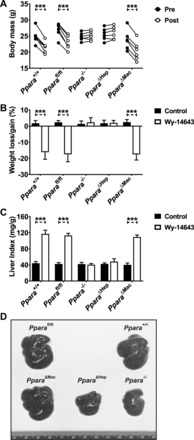
Hepatocyte-specific disruption of Ppara protects against agonist-induced weight loss and hepatomegaly. Ppara+/+, Pparafl/fl, and Ppara△Mac mice exhibited analogous body mass loss after 14 days Wy-14643 treatment (A). Weight loss (%) between these groups was not significantly different (B). Wy-14643-treated Ppara−/− and Ppara△Hep mice did not lose body mass and experienced slight weight gains similar to controls. Wy-14643-treated Ppara+/+, Pparafl/fl, and Ppara△Mac mouse liver indexes (mg liver/g body mass) support hepatomegaly in these groups (C). Severity of hepatomegaly is evident by gross liver examination (D). Ppara−/− and Ppara△Hep mice are completely protected from these effects. Experiments were performed on at least 5 animals/group. Each data point represents the mean ± SD (***P < 0.001).
Fig. 3.
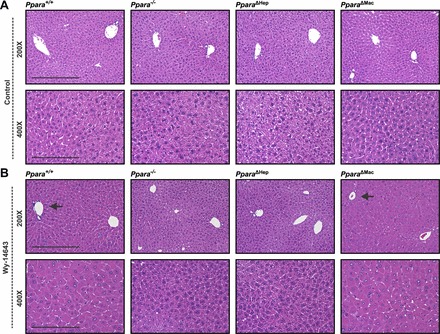
Wy-14643-induced hepatocyte hypertrophy is dependent on hepatocyte-specific Ppara expression. Histological analysis by hematoxylin and eosin (H&E) staining of formalin-fixed paraffin-embedded tissues revealed no obvious structural differences between various genotypes on control diet (A). Fourteen-day treatment with Wy-14643 caused pronounced and predominantly centrilobular hepatocellular hypertrophy (arrows) in livers of Ppara+/+ and Ppara△Mac mice (B). Ppara−/− and Ppara△Hep mice were protected from Wy-14643-induced hepatocyte swelling. Representative images are shown. At least 4 mice were analyzed/genotype and treatment group.
Circulating lipid levels are elevated in Wy-14643-treated hepatocyte-specific knockout mice.
The beneficial therapeutic effects of PPARA activation include lowering of circulating TGs, reduction of low-density lipoprotein (LDL) levels, and an increase in high-density lipoprotein (HDL)-to-LDL ratios. To assess the hypolipidemic effects of Wy-14643, serum was collected and analyzed for circulating lipid levels. Cholesterol (CHOL), NEFAs, phospholipids (PLPs), and TGs were assayed (Fig. 4A). As expected, serum TG concentrations dropped significantly in Wy-14643-treated wild-type mice. Ppara△Mac mouse TG levels paralleled the wild-type response, indicating that lipid catabolism is unaffected by loss of macrophage PPARA. The Ppara−/− and PparaΔHep groups exhibited an increase in circulating TGs. Surprisingly, serum TGs in Ppara△Hep mice were around 25% higher than in full-body knockouts, suggesting that extrahepatic PPARA activation may influence lipid mobilization. PparaΔHep mice also experienced a Wy-14643-dependent increase in circulating CHOL and PLPs. Serum NEFA levels were unchanged by genotype or agonist treatment. Serum ALT and AST were also measured to assess the impact of agonist-induced hepatomegaly on liver damage (Fig. 4B). Ppara△Hep mice were protected from liver damage, providing additional support that hepatocyte-specific PPARA expression is responsible for agonist-induced hepatomegaly.
Fig. 4.
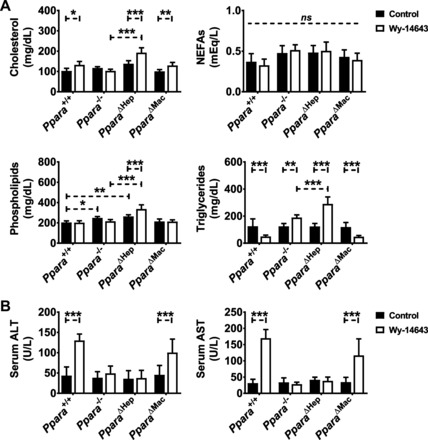
Macrophage PPARA expression does not influence physiological response to Wy-14643. Serum was collected from mice treated with either control diet or diet containing 0.1% Wy-14643 for 14 days. Circulating total cholesterol, triglycerides, phospholipids, and nonesterified free fatty acids (NEFA) were analyzed (A). Ppara△Mac mouse response paralleled wild-type animals. Cholesterol levels (A) were slightly elevated in these groups, and triglyceride levels were significantly reduced after Wy-14643 treatment. NEFA and phospholipids remained unchanged. Interestingly, cholesterol, phospholipid, and triglyceride levels were elevated in hepatocyte-specific knockout mice after Wy-14643. Serum alanine aminotransferase (ALT) and aspartate aminotransferase (AST) levels (B) were significantly elevated in Wy-14643-treated Ppara+/+ and Ppara△Mac mice, indicating liver damage. Ppara−/− or Ppara△Hep mice were protected from these effects. Experiments were performed on at least 5 mice/group. Each data point represents the mean ± SD (*P < 0.05, **P < 0.01, and ***P < 0.001). ns, No significant differences.
Hepatocyte-expressed PPARA is required for regulation of lipid metabolism-related genes.
It is well known that hepatocytes are the major site of lipid catabolism, but the influence of NPCs on these pathways remains unclear. PPARA activation in the liver initiates a wide array of transcriptional changes that promote the uptake and catabolism of lipids. To determine the contribution of different liver cell types to hepatic lipid metabolism, mRNAs encoded by genes involved in lipid homeostasis were measured. Acyl-CoA dehydrogenase medium chain (Acadm), carnitine palmitoyltransferase 1 (Cpt1b), cytochrome P-450 4a10 (Cyp4a10), and enoyl-CoA hydratase/3-hydroxyacyl CoA dehydrogenase (Ehhadh) mRNAs were upregulated by Wy-14643 and solely dependent on hepatocyte-specific PPARA expression (Fig. 5A). Lipid metabolism-related gene expression was unaffected in Ppara−/− or PparaΔHep mice treated with Wy-14643. The expression of other well-known PPARA target genes involved in lipid metabolism, namely acetyl-CoA acyltransferase 1 (Acaa1b), acyl-CoA oxidase 1 (Acox1), and fatty acid-binding protein (Fabp1), was also hepatocyte dependent (data not shown). Wy-14643-treated Ppara△Mac mouse response mirrored wild-type mice and had no impact on the lipid metabolism-related gene response, suggesting little influence from macrophage PPARA, since metabolic pathways shift to catabolize lipids. Compensatory upregulation of Ppard and Pparg mRNAs was not observed in any of the knockout mouse lines (Fig. 5B). There was, however, a slight but statistically significant decrease in Ppard mRNA expression in response to Wy-14643. The decrease in Ppard mRNA expression was dependent on hepatocyte-specific Ppara mRNA expression, since it was not observed in the macrophage-specific knockout mice. The fact that regulation of lipid-related pathways in the liver was completely dependent on hepatocyte-specific PPARA expression corresponds to lowering of serum TGs. Interestingly, these data do not provide an explanation for the increase in TGs observed in Ppara△Hep mice after Wy-14643 treatment, again indicating that extrahepatic PPARA activation may impact circulating lipid levels.
Fig. 5.
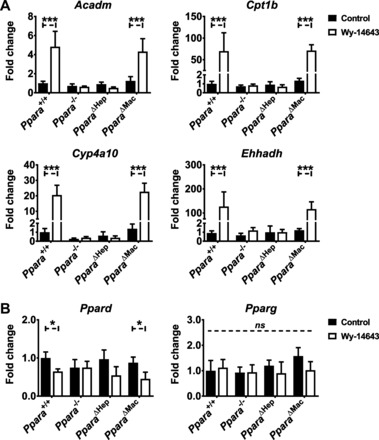
Hepatocyte PPARA activation exclusively controls lipid metabolism-related pathways. Mice were treated with Wy-14643 for 14 days, and liver RNA was isolated for qRT-PCR analysis. PPARA target genes involved in lipid metabolism were assayed, and values were normalized to Actb expression and then expressed as fold change from wild-type control groups. β-Oxidation-related genes Acadm, carnitine palmitoyltransferase 1 (Cpt1b), cytochrome P-450 4a10 (Cyp4a10), and enoyl-CoA hydratase/3-hydroxyacyl CoA dehydrogenase (Ehhadh) were upregulated significantly in Ppara+/+ and Ppara△Mac mice treated with Wy-14643 (A). Ppara−/− or Ppara△Hep mice did not exhibit altered mRNA levels in response to treatment. Compensatory upregulation of the Ppara homologs peroxisome proliferator-activated receptor-γ (Pparg) and peroxisome proliferator-activated receptor-β/δ (Ppard) was not observed in any genotype or treatment group (B). Experiments were performed on at least 5 mice/group. Each data point represents the mean ± SD (*P < 0.05 and ***P < 0.001).
Proliferative response to Wy-14643 is solely dependent on hepatocyte PPARA expression.
To directly assess the impact of PPARA activation on cell proliferation, mice were treated with Wy-14643 for one week, at which point osmotic micropumps containing a BrdU solution were implanted subcutaneously. Wy-14643 treatment was continued for another week following implantation, and livers were processed for immunohistochemical and gene expression analyses. Immunohistochemical staining showed a significant increase in BrdU-positive nuclei in Wy-14643-treated wild-type and Ppara△Mac mice (Fig. 6A). Intestinal epithelial cells rapidly proliferate, and thus intestine was processed as a positive control for BrdU staining (Fig. 6A, bottom). The BrdU labeling index is represented as the percent BrdU-positive cells per field of view as outlined in materials and methods. Hepatocytes are easily distinguished histologically from NPC cells by hematoxylin staining based on size and shape of cells and nuclei. Proliferation indexes for both hepatocytes and NPCs were determined separately. BrdU labeling indexes revealed pronounced hepatocyte proliferation in wild-type mice treated with Wy-14643 (Fig. 6B). There was also a significant increase of BrdU-positive NPCs, possibly because of recruitment of circulating immune cells. Ppara−/− mice were completely protected from the proliferative effects of PPARA activation, and BrdU staining was comparable to control groups. The PparaΔHep response paralleled conventional knockouts, and proliferation indexes for hepatocytes, as well as NPCs, were similar to controls, indicating that PPARA activation specifically within parenchymal hepatocytes is necessary and sufficient for proliferation. Macrophage-specific disruption of PPARA did not impact proliferation in Wy-14643-treated animals, and indexes were comparable to wild-type for both hepatocytes and NPCs.
Fig. 6.
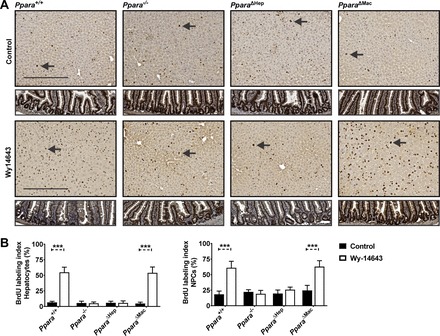
BrdU staining indicates proliferation is dependent on hepatocyte-specific PPARA activation. BrdU pumps were implanted sc following 7 days of Wy-14643 treatment. Mice were treated for an additional 7 days after implantation (14 days total). Sections were stained for BrdU incorporation (dark brown foci) and counterstained with hematoxylin for visualization of nuclei (light purple) (A). Examples of hepatocyte nuclei BrdU staining are indicated by arrows. Representative images are shown for each genotype and treatment group. Intestinal epithelium was included (bottom) as a positive control for BrdU staining of proliferating cells. BrdU labeling indexes were calculated for hepatocyte and nonparenchymal cell (NPC) nuclei (B). Increases in staining for both hepatocytes and NPCs were dependent on hepatocyte-specific PPARA activation. Ten microscope fields (×200)/mouse were analyzed for BrdU-positive nuclei. Proliferation index is represented as the average number of BrdU-positive cells (%)/field of view. Experiments were performed on at least 5 animals/group. Each data point represents the mean ± SD (***P < 0.001).
BrdU incorporation is indicative of cell division. To confirm and further explore the underlying pathways driving proliferation, markers of cell proliferation were assessed in both control and Wy-14643 treatment groups. Aurora kinase B (Aurkb) expression was significantly elevated in Wy-14643-treated wild-type and PparaΔMac mice (Fig. 7A). Abnormally high Aurkb levels are often observed in cancer and are thought to drive carcinogenesis by causing disproportionate chromosome separation during cell division (12). Expression of cyclins B1 (Cnnb1) and G2 (Cnng2) and cyclin-dependent kinase 1 (Cdk1) mRNAs was also significantly upregulated. These genes are critical for control of the G1/S phase in hepatocytes. Jun proto-oncogene (Jun) and Mki67 mRNA levels were upregulated and similarly tied to proliferative status. Hepatocyte-specific PPARA activation also promoted DNA damage- and repair-related pathways. Checkpoint kinase 1 homolog (Chek1), minichromosome maintenance complex component-deficient 2 mitotin 6 (Mcm6), and RAD51 recombinase (Rad51) mRNAs were induced by Wy-14643 treatment in wild-type and PparaΔMac mice (Fig. 7B). These data demonstrate that induction of genes associated with proliferation and DNA damage response appears to be completely dependent on Ppara expression within hepatocytes and does not support a role for Ppara expression within Kupffer cells or other NPCs.
Fig. 7.

Markers for cell proliferation and DNA damage/repair are not affected by NPC PPARA activation. Mice were treated with Wy-14643 for 14 days, and liver RNA was isolated for qRT-PCR analysis. Markers for cell proliferation [cyclin B1 (Cnnb1), cyclin-dependent kinase 1 (Cdk1), cyclin D1 (Cnnd1), cyclin G2 (Cnng2), Mki67, Jun proto-oncogene (Jun)] (A) and DNA damage/repair [checkpoint kinase 1 homolog (Chek1), minichromosome maintenance complex component-deficient 2 mitotin 6 (Mcm6), and RAD51 recombinase (Rad51)] (B) were induced significantly in Ppara+/+ and Ppara△Mac mice treated with Wy-14643. Treatment had no effect on gene expression in either Ppara−/− and Ppara△Hep mice, indicating that the proliferative effects are dependent on hepatocyte PPARA activation. mRNA levels were normalized to Actb mRNA and expressed as fold control. Experiments were performed on at least 5 mice/group. Each data point represents the mean ± SD (**P < 0.01 and ***P < 0.001).
Prolonged Ppara activation increases Adgre1-positive macrophage populations in the liver.
Prolonged PPARA activation by Wy-14643 resulted in pronounced hepatocyte proliferation that was accompanied by an increase in BrdU staining of NPC cells. Close histological examination of H&E- and BrdU-stained sections indicated that many BrdU-positive cells may be newly recruited immune cells. To assess total macrophage number and also characterize Kupffer cell subpopulations, Western blotting and IHC staining for ADGRE1 and CD68 was performed on whole liver tissue from each of the mouse strains and treatment groups. ADGRE1 staining by IHC revealed a pronounced increase in hepatic macrophages after Wy-14643 treatment in wild-type and PparaΔMac mice (Fig. 8A). Quantification revealed an approximate twofold increase in ADGRE1-positive macrophages in these groups (Fig. 8B). Macrophage number was unchanged in conventional and liver-specific knockout mice, indicating that recruitment is mediated by hepatocyte-expressing PPARA. There was also a slight, but significant, decrease in ADGRE1-positive macrophages in PparaΔMac mice on control diet. Alterations in ADGRE1 expression were further supported by Western blot results (Fig. 8C). IHC staining for Kupffer cell marker CD68 clearly identified a population of positive cells; however, CD68-positive macrophage numbers were similar between all genotype and treatment groups, and CD68 Western blotting did not indicate significant differences in protein expression (data not shown). Hepatic mRNAs encoding common macrophage and Kupffer cell markers, including ADGRE1, CD68, and CD32, were analyzed by qRT-PCR (Fig. 9A). The T cell surface glycoprotein CD3E mRNA was also assessed to check for possible T cell infiltration. Hepatic expression levels of these immune markers were unaffected by genotype or treatment. Interestingly, Adgre1 mRNA levels did not reflect IHC or Western data; thus, upregulation most likely occurs posttranscriptionally. The significant increase in ADGRE1-positive macrophages in wild-type and PparaΔMac mice at least partially explains the increase in BrdU-positive NPCs.
Fig. 8.
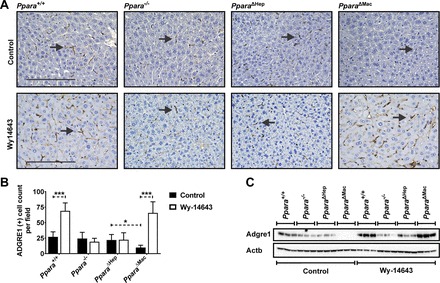
Hepatic ADGRE1-positive macrophages increase in response to prolonged PPARA activation. Immunohistochemistry (IHC) was performed for the general macrophage marker ADGRE1 on liver sections from mice treated with Wy-14643. Nuclei were counterstained with hematoxylin. IHC revealed a pronounced increase in ADGRE1-positive macrophages in livers from wild-type and Ppara△Mac mice treated with Wy-14643 (A). Ten microscope fields (×200)/mouse were analyzed for ADGRE1-positive cells and averaged (B). Liver lysate (50 µg) was separated by SDS-PAGE, and Western blotting was performed to assess ADGRE1 protein levels (C). Blots were reprobed for ACTB as loading control. Experiments were performed on at least 4 mice/group. Each data point represents the mean ± SD (*P < 0.05 and ***P < 0.001).
Fig. 9.
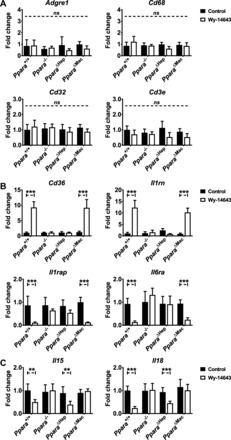
Hepatocyte- and macrophage-specific PPARA activation differentially influences inflammation-related gene expression. Mice were treated with Wy-14643 for 14 days, and liver RNA was isolated for qRT-PCR analysis. Inflammation-related genes were assayed, and values were normalized to Actb and then expressed as fold change compared with wild-type controls. Expression of immune cell markers Adgre1, Cd32, Cd68, and Cd3e mRNAs was unaffected by genotype or treatment (A). Hepatocyte-specific PPARA activation controls Cd36 and interleukin-1 receptor antagonist (Il1rn) mRNA induction in response to Wy-14643 treatment and also downregulation of interleukin-1 receptor accessory protein (Il1rap) and interleukin-6 receptor-α (Il6ra, B). Expression levels were unaffected in Wy-14643-treated Ppara−/− or Ppara△Hep groups. Macrophage-specific PPARA activation drives interleukin-15 (Il15) and -18 (Il18) suppression in response to Wy-14643 (C). Downregulation was observed in Wy-14643-treated Ppara+/+ and PparaΔHep mice and unchanged in Ppara−/− and Ppara△Mac mice, supporting a role for macrophage PPARA activation in regulating inflammatory pathways. Experiments were performed on at least 5 animals/group. Basal expression levels for all genes were similar in control groups. Each data point represents the mean ± SD (**P < 0.01 and ***P < 0.001).
Macrophage PPARA expression contributes to the anti-inflammatory actions of Wy-14643.
In addition to acting as hypolipidemic agents, PPARA agonists also have potent anti-inflammatory properties. Inflammation-related gene expression was measured in liver samples to clarify whether macrophage PPARA expression plays a role in the anti-inflammatory actions of these compounds. CD36 antigen (Cd36) and interleukin-1 receptor antagonist (Il1rn) mRNAs were upregulated in response to Wy-14643, whereas interleukin-1 receptor accessory protein (Il1rap) and interleukin-6 receptor-α (Il6ra) were downregulated (Fig. 9B). Changes in gene expression were solely dependent on hepatocyte-specific PPARA activation, since levels were unaffected in either Ppara−/− or PparaΔHep mice. Expression of interleukin-15 (Il15) and -18 (Il18) was significantly suppressed by Wy-14643 reatment (Fig. 9C). Downregulation of Il15 and Il18 was observed in wild-type and PparaΔHep mice. Expression levels in Ppara−/− and PparaΔMac mice were unaffected, supporting macrophage-specific Ppara-dependent regulation. IHC staining for ADGRE1 revealed a pronounced increase in hepatic macrophages after Wy-14643 treatment. Macrophage activation is a complex process involving multiple signaling pathways. mRNA analysis did not identify significant changes in expression of markers associated with proinflammatory M1 (Csf2, Il1b, Ifng, Tnf) or anti-inflammatory M2 (Il4, Il10, Vegf) macrophage polarization (data not shown), suggesting that the macrophage population is relatively naïve. Together, these data reveal direct evidence for participation of both hepatocyte and macrophage PPARA in regulation of inflammation-related pathways in the liver and provide further mechanistic support for the anti-inflammatory properties PPARA agonists.
Primary hepatocyte and macrophage cultures confirm differential roles for cell type-specific Ppara expression.
Primary hepatocyte and hepatic Kupffer cell populations were isolated from Ppara+/+, Ppara−/−, Ppara△Hep, and Ppara△Mac mouse livers. Thioglycolate-elicited intraperitoneal macrophages were also isolated. Cultured cells were then used to compare the effect of PPARA activation between hepatocytes and hepatic Kupffer cells, as well as two different macrophage populations, namely Kupffer cells and peritoneal macrophages. Cells were cultured ex vivo and treated with 100 µM Wy-14643 for 16 h. RNA was isolated, and gene expression analysis was performed to elucidate the cell type-specific impact of PPARA activation.
Ppara disruption was confirmed in purified hepatocytes from Ppara△Hep mice and Kupffer cells from Ppara△Mac mice (Fig. 10A). Alternatively, the corresponding cell populations were checked to confirm Ppara expression. As expected, cells isolated from Ppara−/− mice did not express detectable Ppara levels. The general macrophage marker Adgre1 and common Kupffer cell marker Cd68 were found to be similarly expressed in macrophages from all genotypes. These markers were also used to confirm the enrichment and relative purity of macrophage preparations when compared with corresponding hepatocytes. mRNAs encoded by genes identified as differentially regulated in whole livers were also assayed in cells after Wy-14643 treatment. As expected, PPARA target gene mRNAs, including Acadm, Cpt1b, and Cd36, were upregulated in a Ppara-dependent manner in primary hepatocytes (Fig. 10B). Expression levels were attenuated when compared with whole liver. Cd36 and Cpt1b mRNAs were upregulated 25- and 60-fold in vivo but only induced 8- and 12-fold in cultured hepatocytes. Il1rn expression was upregulated over fourfold, confirming hepatocyte-specific regulation of anti-inflammatory signals. Il15 and Il18 expression was unchanged in agonist-treated hepatocytes.
Primary Kupffer cell cultures also showed slight but statistically significant upregulation of PPARA target genes involved in lipid oxidation, namely Acadm and Cpt1b mRNAs (Fig. 10C). The Ppara-dependent downregulation of Il15 mRNA expression was confirmed, supporting in vivo results supporting regulation by macrophage-specific PPARA. Contrary to in vivo data, Il18 mRNA expression was not suppressed. Cd36 and Il1rn mRNA levels were unaffected by agonist treatment. Cultured intraperitoneal macrophages were also treated with Wy-14643 for 16 h. Loss of Ppara expression was confirmed in intraperitoneal macrophages from Ppara−/− and Ppara△Mac mice by qRT-PCR. Contrary to Kupffer cells, cultured intraperitoneal macrophages did not exhibit alterations in macrophage (Adgre1, Cd68)-, lipid oxidation (Acadm, Cpt1b, Cd36)-, or inflammation (Il15, Il18, Il1rn)-related mRNA expression in response to either Ppara disruption or Wy-14643 administration (data not shown). Proliferation-related genes (Ccnb1, Ccng2, Cdk1) and M1 (Tnf, Il1b) and M2 (Il10) macrophage polarization markers were also measured in hepatocytes, hepatic macrophages, and intraperitoneal macrophages after Wy-14643 treatment; however, their expression was comparable between genotypes and treatment groups (data not shown). These data provide additional support for in vivo data, indicating that hepatocyte and macrophage PPARA differentially regulates hepatic gene expression and also indicate that gene response varies within different macrophage populations.
DISCUSSION
Prolonged PPARA activation by agonists in rodents results in pronounced hepatocyte proliferation, suppression of apoptosis, leading to hepatomegaly, and eventually hepatocellular carcinoma (HCC). However, there is no evidence suggesting that these proliferative effects of PPARA activation occur in humans. Given that the pathophysiological consequences are species specific, agonist-induced cell proliferation provides a unique model for studying the underlying pathways associated with nongenotoxic carcinogenicity. Studies have shown that hepatic NPCs play a pronounced role in a number of liver diseases, including HCC (30, 41, 54). Yet, there have been conflicting reports on the contribution of various liver cell types to PPARA-mediated cell proliferation. Kupffer cells are of particular interest, since they release cytokines and growth factors known to promote hepatocyte proliferation (41). In fact, many compounds with nongenotoxic properties are thought to promote hepatic carcinogenesis through the activation of Kupffer cells (41–44). Studies have also indicated that cross talk between Kupffer cells and hepatocytes may also impact the regulation of hepatic TG levels, which was at least partially mediated directly through macrophage-specific PPARA activation (45). Given the complex interplay between hepatocytes and NPCs in the liver, it was reasonable to assume that PPARA expression in NPCs may play an important role during agonist-induced cell proliferation. To test this hypothesis, hepatocyte- and macrophage-specific PPARA knockout mice were generated. PparaΔHep mice revealed that the majority of Ppara expression in the liver is found in hepatocytes, since Ppara mRNA levels were decreased by 96%. Ppara disruption in PparaΔMac mice resulted in an 85–90% reduction in Ppara expression in intraperitoneal macrophages and isolated Kupffer cells. Treatment of these mouse lines with PPARA agonist confirmed the importance of hepatocyte-specific Ppara expression in regulating hepatic lipid metabolism and in promoting agonist-induced hepatocyte proliferation. These studies also identified a novel and potentially import role for Kupffer cell PPARA activation in regulating expression of the proinflammatory cytokines IL-15 and IL-18.
PPARA activation dramatically lowers seum TG levels. This occurs through a series of transcription changes that promote the utilization of lipids as an energy source. As expected, both Ppara+/+ and Pparafl/fl mice treated with Wy-14643 lost significant body mass and experienced a pronounced drop in circulating TG concentrations. Conventional Ppara−/− mice were protected from these effects as previously shown (35, 49). PparaΔHep response to Wy-14643 treatment closely resembled that of the Ppara−/− mice, since Wy-14643 did cause a reduction in body mass or serum TG levels. TG levels in Wy-treated Ppara−/− were elevated in response to treatment, which was previously shown (49). Surprisingly, circulating TGs in Wy-14643-treated PparaΔHep mice were ~30% greater than Ppara−/− and over 100% higher than control animals. PparaΔHep also exhibited elevated serum cholesterol and phospholipid concentrations. The fact that Ppara−/− and PparaΔHep mice displayed very different serum lipid profiles suggests that extrahepatic PPARA may play an important role in regulating circulating lipid levels or possibly in mobilizing adipose stores. PPARA is highly expressed in the liver and expressed at moderate levels in many other tissues, including muscle, adipose tissue, kidney, and heart. As such, additional studies are needed to address the function of extrahepatic PPARA in regulating serum lipid levels. Macrophage-specific Ppara disruption did not impact physiological or lipid metabolism-related end points after Wy-14643, and response paralleled wild-type mice; they experienced significant weight loss, reduced serum TGs, and similar changes in lipid-related gene expression. Taken together, these data do not support an important physiological role for PPARA expression within Kupffer cells or other NPCs in regulating hepatic or systemic lipid homeostasis.
Studies have shown that Kupffer cells contribute to the hepatic response to many nongenotoxic carcinogens through the release of proinflammatory cytokines, reactive oxygen species, and growth factors (6, 8, 31, 41). Protracted release of these compounds in the liver was shown to induce hepatocyte proliferation, suggesting that these immune cells may contribute to the proliferative effect caused by prolonged treatment with PPARA agonists (41). Macrophage-specific Ppara knockout mice treated with Wy-14643 experienced severe hepatomegaly. Histological analysis indicated hepatocyte hypertrophy, and subsequent staining for BrdU incorporation revealed a significant increase in proliferating cells. Ppara−/− and PparaΔHep mice were completely protected from these effects, and proliferation levels were comparable to animals on control diet. These data conclusively show that PPARA activation within parenchymal hepatocytes, and not NPCs, drives agonist-induced proliferation. Analysis of cell proliferation marker Cnnb1, Cnng2, and Cdk1 mRNAs was upregulated in hepatomegalic livers. Ccng2 and Cdk1 mRNAs were previously shown to be linked to the proliferative effects of PPARA agonists (13, 49). Interestingly, there was also a prominent increase in Aurkb mRNA expression in these groups. Elevated aurora kinase activity is a common biomarker for many cancers, and aurora kinase inhibitors are being pursued as promising chemotherapeutic agents (28, 32). Aurkb induction may represent a yet unexplored mechanism that contributes to PPARA-mediated carcinogenesis in rodents. Moreover, Aurk induction was shown to confer resistance to apoptosis, which is a hallmark of PPARA-mediated HCC (32). DNA damage response and repair-related pathways were also elevated, possibly as a protective mechanism in response to uncontrolled cell proliferation. Chek1 and Rad51 coordinate cell-cycle checkpoint response, and the expression of both genes was significantly upregulated by hepatocyte-specific PPARA activation. Chek1 encodes a kinase that acts downstream of ATM/ATR kinase and plays a crucial role in tumor suppression by coordinating DNA damage response and cell cycle checkpoint control (19). CHEK1 activation results in cell cycle arrest, DNA repair, and cell death, preventing cells with unrepaired DNA damage from replicating. Rad51 has been studied extensively and plays an important role in double-strand break repair by homologous recombination (24). Mcm6 expression was also elevated and is known to play an active role in regulating the cell cycle through DNA replication initiation. These data support previous studies that indicate agonist-induced hepatomegaly activates DNA damage-related pathways (38, 39). These studies provide strong evidence that agonist-induced cell proliferation is exclusively mediated by hepatocyte-specific PPARA activation.
Immunohistochemical staining for BrdU identified a significant increase in hepatocytes and NPCs in the livers of wild-type and PparaΔMac treated with Wy-14643. These results support previous proliferation studies that found an increase in BrdU-positive hepatocytes and NPCs in response to PPARA agonists (35, 38). BrdU-positive hepatocytes are the result of proliferation. NPC staining could either be the result of increased immune cell recruitment or possibly hepatic NPC proliferation. Nonetheless, ablation of hepatocyte PPARA prevents the accumulation of both BrdU-positive hepatocytes and NPCs. Immunohistochemical staining for the general macrophage marker ADGRE1 identified an almost twofold increase of macrophages that was also dependent on hepatocyte-specific PPARA activation. The increase in macrophage number at least partially explains the increase in BrdU-positive NPCs. Macrophage populations in the liver have two possible origins. They can originate from the recruitment of circulating monocytes or from local proliferation of resident Kupffer cell populations. Circulating monocytes have a lifespan of only a few days unless they are recruited to a tissue (52). Macrophage accumulation as a result of monocyte recruitment would be expected to stain positive after week-long exposure to BrdU. Local Kupffer cell expansion would also give rise to BrdU-positive cells, so either cell type could be responsible for the increase in ADGRE1-positive cells. Currently, no single marker has been identified that can definitely discriminate between these two macrophage populations (18, 20). ADGRE1 is known to stain both monocyte-derived macrophages and Kupffer cells. CD68 is a commonly used but nonexclusive Kupffer cell marker (18, 20). Immunohistochemistry did not show an increase in CD68-positive macrophages (data not shown), indicating that the macrophages may be monocyte derived. The current study did not find a significant difference in expression of proinflammatory M1 macrophage marker (Csf2, Il1b, Ifng, Tnf) mRNAs, suggesting these cells are relatively naïve. Interestingly, PPARA agonists promote resolution of liver damage and inflammation in response to a variety of insults, including acetaminophen, carbon tetrachloride, and ethanol, suggesting the possible involvement of anti-inflammatory M2-polarized macrophages. However, the expression of major M2-associated marker (Il4, Il10, Vegf) mRNAs was also unchanged (23, 34, 50). Whereas expansion of hepatic macrophage populations in response to Wy-14643 is of interest, further studies are required to elucidate exactly how these cells might contribute to the hepatoprotective actions of PPARA agonists.
Inflammation-related gene expression was assessed in hepatocyte- and macrophage-specific Ppara knockout mouse livers. Results indicate that receptor activation in both cell types suppresses proinflammatory pathways. Hepatocyte-specific PPARA activation induced Cd36 and Il1rn mRNA expression, whereas Il1rap and Il6ra mRNA levels were suppressed. Changes in the expression of these genes were solely dependent on hepatocyte-specific PPARA activation, since levels were unaffected in PparaΔHep mice. CD36 is a member of the scavenger receptor family that is known to play a role in PPARA-mediated lipid metabolism by promoting uptake of fatty acids (7). It also plays a role in internalization of apoptotic cells and may therefore influence response to tissue damage and repair (9). The Il1rn gene encodes a protein that has anti-inflammatory actions and binds to the interleukin-1 receptor (IL1R), preventing the proinflammatory actions of interleukin-1β (IL1B). IL1B signaling would be further suppressed by downregulation of IL1RAP, which is a required subunit of the IL1 receptor complex. Il6ra suppression would have a similar anti-inflammatory effect, since it encodes the receptor for proinflammatory IL-6. IL-15 and IL-18 were also significantly downregulated in response to Wy-14643 in wild-type and PparaΔHep mice, indicating suppression is dependent on macrophage PPARA activation. Proinflammatory M1-activated monocyte-derived macrophages and Kupffer cells are the main producers of IL-15 and IL-18 in the liver, suggesting that PPARA activation may prevent M1 polarization (11, 47). IL-15 contributes to a number of immune functions but predominantly is involved in tissue-specific immune responses and activation of the innate immune system (11). IL-18 is a proinflammatory cytokine that is responsible for promoting acute injury following lipopolysaccharide (LPS) (47). Interestingly, PPARA agonists protect against LPS-induced lung and liver injury (17, 55), and conventional knockout mice are more susceptible to liver damage caused by acute LPS treatment (56). Macrophage-specific PPARA activation and subsequent suppression of IL-15 and -18 could provide a possible mechanistic explanation for protection toward LPS.
The above in vivo studies indicate hepatocyte- and macrophage-specific PPARA activation may differentially influence expression of target genes in response to Wy-14643. To further explore the cell type-specific functions of PPARA, primary hepatocytes, Kupffer cells, and intraperitoneal macrophage populations were isolated from Ppara+/+, Ppara−/−, Ppara△Hep, and Ppara△Mac mice. Cultured cells were then used to directly compare agonist response in primary hepatocytes and hepatic Kupffer cells, as well as two different macrophage populations, namely Kupffer cells and peritoneal macrophages. Primary hepatocytes treated with agonist revealed PPARA-dependent upregulation of target genes involved in lipid catabolism, including Acadm, Cpt1b, and Cd36. Hepatocytes also displayed significant upregulation of the anti-inflammatory cytokine Il1rn. Cultured Kupffer cells also responded to agonist treatment. Both Acadm and Cpt1b displayed slight but significant upregulation. Interestingly, macrophage M2 polarization triggers upregulation of genes associated with fatty acid (FA) oxidation, and studies have shown that M2 activation triggered by IL-4 increases expression of Cd36, Cpt1b, and Acadm through a mechanism involving STAT6 and peroxisome proliferator-activated receptor-γ coactivator 1-β (PPARGC1B) (48). It could be that hepatic PPARA activation also plays a role in M2 polarization both directly via transcriptional activity in macrophages and indirectly through hepatocyte-specific upregulation of IL1RN and other genes that promote M2 polarization by blocking IL1B signaling. The impact of PPARA on these pathways needs to be further explored using in vivo models for M1 and M2 macrophage polarization. Wy-14643 may prime activation of hepatic macrophages, but inflammatory signals are needed to elicit a physiological response.
In summary, this study has conclusively shown that NPC PPARA expression does not significantly contribute to agonist-induced proliferation in vivo. Moreover, hepatocyte-specific PPARA activation is necessary and sufficient for the regulation of genes associated with hepatic lipid metabolism. These studies conclusively show that PPARA activation within resident Kupffer cells or monocyte-recruited macrophages does not contribute to the hypolipidemic or proliferative effects of agonist treatment. Furthermore, these data provide direct evidence that Kupffer cell PPARA activation at least partially mediates the anti-inflammatory actions of agonist treatment through the suppression of proinflammatory cytokines IL-15 and IL-18.
GRANTS
This work was funded by the intramural research program at the National Cancer Institute, National Institutes of Health (C. N. Brocker, J. Yue, D. Kim, A. Qu, J. A. Bonzo, and F. J. Gonzalez). C. N. Brocker and J. A. Bonzo were supported by the Postdoctoral Research Associate Training program through the National Institute of General Medical Sciences, National Institutes of Health.
DISCLOSURES
No conflicts of interest, financial or otherwise, are declared by the authors.
AUTHOR CONTRIBUTIONS
C.N.B., J.A.B., and F.J.G. conception and design of research; C.N.B., J.Y., D.K., and A.Q. performed experiments; C.N.B. analyzed data; C.N.B. and F.J.G. interpreted results of experiments; C.N.B. prepared figures; C.N.B. drafted manuscript; C.N.B. and F.J.G. edited and revised manuscript; C.N.B., J.Y., D.K., A.Q., J.A.B., and F.J.G. approved final version of manuscript.
ACKNOWLEDGMENTS
The LysMCre transgenic mice were provided by Christopher Glass at the University of California, San Diego. AlbCre mice were provided by Derek LeRoith at the Mount Sinai School of Medicine.
Present addresses: J. A. Bonzo, Primary & Stem Cell Systems, Life Technologies, Frederick, MD; A. Qu, Capital Medical University, Beijing, P.R. China; and J. Yue, Dept. of Pharmacology, Wuhan University, Wuhan, Hubei, P.R. China.
REFERENCES
- 1.Ann SJ, Chung JH, Park BH, Kim SH, Jang J, Park S, Kang SM, Lee SH. PPARα agonists inhibit inflammatory activation of macrophages through upregulation of β-defensin 1. Atherosclerosis 240: 389–397, 2015. doi: 10.1016/j.atherosclerosis.2015.04.005. [DOI] [PubMed] [Google Scholar]
- 2.Bonzo JA, Brocker C, Jiang C, Wang RH, Deng CX, Gonzalez FJ. Hepatic sirtuin 1 is dispensable for fibrate-induced peroxisome proliferator-activated receptor-α function in vivo. Am J Physiol Endocrinol Metab 306: E824–E837, 2014. doi: 10.1152/ajpendo.00175.2013. [DOI] [PMC free article] [PubMed] [Google Scholar]
- 3.Bustin SA, Benes V, Garson JA, Hellemans J, Huggett J, Kubista M, Mueller R, Nolan T, Pfaffl MW, Shipley GL, Vandesompele J, Wittwer CT. The MIQE guidelines: minimum information for publication of quantitative real-time PCR experiments. Clin Chem 55: 611–622, 2009. doi: 10.1373/clinchem.2008.112797. [DOI] [PubMed] [Google Scholar]
- 4.Clausen BE, Burkhardt C, Reith W, Renkawitz R, Förster I. Conditional gene targeting in macrophages and granulocytes using LysMcre mice. Transgenic Res 8: 265–277, 1999. doi: 10.1023/A:1008942828960. [DOI] [PubMed] [Google Scholar]
- 5.Desvergne B, Wahli W. Peroxisome proliferator-activated receptors: nuclear control of metabolism. Endocr Rev 20: 649–688, 1999. [DOI] [PubMed] [Google Scholar]
- 6.Dixon LJ, Barnes M, Tang H, Pritchard MT, Nagy LE. Kupffer cells in the liver. Compr Physiol 3: 785–797, 2013. doi: 10.1002/cphy.c120026. [DOI] [PMC free article] [PubMed] [Google Scholar]
- 7.Drover VA, Abumrad NA. CD36-dependent fatty acid uptake regulates expression of peroxisome proliferator activated receptors. Biochem Soc Trans 33: 311–315, 2005. doi: 10.1042/BST0330311. [DOI] [PubMed] [Google Scholar]
- 8.Eckert C, Klein N, Kornek M, Lukacs-Kornek V. The complex myeloid network of the liver with diverse functional capacity at steady state and in inflammation. Front Immunol 6: 179, 2015. doi: 10.3389/fimmu.2015.00179. [DOI] [PMC free article] [PubMed] [Google Scholar]
- 9.Ferracini M, Rios FJ, Pecenin M, Jancar S. Clearance of apoptotic cells by macrophages induces regulatory phenotype and involves stimulation of CD36 and platelet-activating factor receptor. Mediators Inflamm 2013: 950273, 2013. doi: 10.1155/2013/950273. [DOI] [PMC free article] [PubMed] [Google Scholar]
- 10.Forman BM, Chen J, Evans RM. Hypolipidemic drugs, polyunsaturated fatty acids, and eicosanoids are ligands for peroxisome proliferator-activated receptors alpha and delta. Proc Natl Acad Sci USA 94: 4312–4317, 1997. doi: 10.1073/pnas.94.9.4312. [DOI] [PMC free article] [PubMed] [Google Scholar]
- 11.Golden-Mason L, Kelly AM, Doherty DG, Traynor O, McEntee G, Kelly J, Hegarty JE, O’Farrelly C. Hepatic interleuklin 15 (IL-15) expression: implications for local NK/NKT cell homeostasis and development. Clin Exp Immunol 138: 94–101, 2004. doi: 10.1111/j.1365-2249.2004.02586.x. [DOI] [PMC free article] [PubMed] [Google Scholar]
- 12.Goldenson B, Crispino JD. The aurora kinases in cell cycle and leukemia. Oncogene 34: 537–545, 2015. doi: 10.1038/onc.2014.14. [DOI] [PMC free article] [PubMed] [Google Scholar]
- 13.Gonzalez FJ, Shah YM. PPARalpha: mechanism of species differences and hepatocarcinogenesis of peroxisome proliferators. Toxicology 246: 2–8, 2008. doi: 10.1016/j.tox.2007.09.030. [DOI] [PubMed] [Google Scholar]
- 14.Gyamfi MA, Wan YJ. Mechanisms of resistance of hepatocyte retinoid X receptor alpha-null mice to WY-14,643-induced hepatocyte proliferation and cholestasis. J Biol Chem 284: 9321–9330, 2009. doi: 10.1074/jbc.M808861200. [DOI] [PMC free article] [PubMed] [Google Scholar]
- 15.Hasmall S, James N, Hedley K, Olsen K, Roberts R. Mouse hepatocyte response to peroxisome proliferators: dependency on hepatic nonparenchymal cells and peroxisome proliferator activated receptor alpha (PPARalpha). Arch Toxicol 75: 357–361, 2001. doi: 10.1007/s002040100246. [DOI] [PubMed] [Google Scholar]
- 16.Hasmall SC, West DA, Olsen K, Roberts RA. Role of hepatic non-parenchymal cells in the response of rat hepatocytes to the peroxisome proliferator nafenopin in vitro. Carcinogenesis 21: 2159–2165, 2000. doi: 10.1093/carcin/21.12.2159. [DOI] [PubMed] [Google Scholar]
- 17.Jiao M, Ren F, Zhou L, Zhang X, Zhang L, Wen T, Wei L, Wang X, Shi H, Bai L, Zhang X, Zheng S, Zhang J, Chen Y, Han Y, Zhao C, Duan Z. Peroxisome proliferator-activated receptor α activation attenuates the inflammatory response to protect the liver from acute failure by promoting the autophagy pathway. Cell Death Dis 5: e1397, 2014. doi: 10.1038/cddis.2014.361. [DOI] [PMC free article] [PubMed] [Google Scholar]
- 18.Ju C, Tacke F. Hepatic macrophages in homeostasis and liver diseases: from pathogenesis to novel therapeutic strategies. Cell Mol Immunol 13: 316–327, 2016. doi: 10.1038/cmi.2015.104. [DOI] [PMC free article] [PubMed] [Google Scholar]
- 19.Karnitz LM, Zou L. Molecular Pathways: Targeting ATR in Cancer Therapy. Clin Cancer Res 21: 4780–4785, 2015. doi: 10.1158/1078-0432.CCR-15-0479. [DOI] [PMC free article] [PubMed] [Google Scholar]
- 20.Kinoshita M, Uchida T, Sato A, Nakashima M, Nakashima H, Shono S, Habu Y, Miyazaki H, Hiroi S, Seki S. Characterization of two F4/80-positive Kupffer cell subsets by their function and phenotype in mice. J Hepatol 53: 903–910, 2010. doi: 10.1016/j.jhep.2010.04.037. [DOI] [PubMed] [Google Scholar]
- 21.Kliewer SA, Sundseth SS, Jones SA, Brown PJ, Wisely GB, Koble CS, Devchand P, Wahli W, Willson TM, Lenhard JM, Lehmann JM. Fatty acids and eicosanoids regulate gene expression through direct interactions with peroxisome proliferator-activated receptors alpha and gamma. Proc Natl Acad Sci USA 94: 4318–4323, 1997. doi: 10.1073/pnas.94.9.4318. [DOI] [PMC free article] [PubMed] [Google Scholar]
- 22.Kmiec Z. Cooperation of liver cells in health and disease. Adv Anat Embryol Cell Biol 161: III–XIII, 1–151, 2001. [DOI] [PubMed] [Google Scholar]
- 23.Kong L, Ren W, Li W, Zhao S, Mi H, Wang R, Zhang Y, Wu W, Nan Y, Yu J. Activation of peroxisome proliferator activated receptor alpha ameliorates ethanol induced steatohepatitis in mice. Lipids Health Dis 10: 246, 2011. doi: 10.1186/1476-511X-10-246. [DOI] [PMC free article] [PubMed] [Google Scholar]
- 24.Kowalczykowski SC. An overview of the molecular mechanisms of recombinational dna repair. Cold Spring Harb Perspect Biol 7: 7, 2015. doi: 10.1101/cshperspect.a016410. [DOI] [PMC free article] [PubMed] [Google Scholar]
- 25.Krey G, Braissant O, L’Horset F, Kalkhoven E, Perroud M, Parker MG, Wahli W. Fatty acids, eicosanoids, and hypolipidemic agents identified as ligands of peroxisome proliferator-activated receptors by coactivator-dependent receptor ligand assay. Mol Endocrinol 11: 779–791, 1997. doi: 10.1210/mend.11.6.0007. [DOI] [PubMed] [Google Scholar]
- 26.Lee SS, Pineau T, Drago J, Lee EJ, Owens JW, Kroetz DL, Fernandez-Salguero PM, Westphal H, Gonzalez FJ. Targeted disruption of the alpha isoform of the peroxisome proliferator-activated receptor gene in mice results in abolishment of the pleiotropic effects of peroxisome proliferators. Mol Cell Biol 15: 3012–3022, 1995. doi: 10.1128/MCB.15.6.3012. [DOI] [PMC free article] [PubMed] [Google Scholar]
- 27.Li PZ, Li JZ, Li M, Gong JP, He K. An efficient method to isolate and culture mouse Kupffer cells. Immunol Lett 158: 52–56, 2014. doi: 10.1016/j.imlet.2013.12.002. [DOI] [PubMed] [Google Scholar]
- 28.Libertini S, Abagnale A, Passaro C, Botta G, Portella G. Aurora A and B kinases—targets of novel anticancer drugs. Recent Patents Anticancer Drug Discov 5: 219–241, 2010. doi: 10.2174/157489210791760517. [DOI] [PubMed] [Google Scholar]
- 29.Ling G, Waxman DJ. Isolation of nuclei for use in genome-wide DNase hypersensitivity assays to probe chromatin structure. Methods Mol Biol 977: 13–19, 2013. doi: 10.1007/978-1-62703-284-1_2. [DOI] [PMC free article] [PubMed] [Google Scholar]
- 30.Luedde T, Schwabe RF. NF-κB in the liver—linking injury, fibrosis and hepatocellular carcinoma. Nat Rev Gastroenterol Hepatol 8: 108–118, 2011. doi: 10.1038/nrgastro.2010.213. [DOI] [PMC free article] [PubMed] [Google Scholar]
- 31.Marra F, Tacke F. Roles for chemokines in liver disease. Gastroenterology 147: 577–594, 2014. doi: 10.1053/j.gastro.2014.06.043. [DOI] [PubMed] [Google Scholar]
- 32.Nikonova AS, Astsaturov I, Serebriiskii IG, Dunbrack RL Jr, Golemis EA. Aurora A kinase (AURKA) in normal and pathological cell division. Cell Mol Life Sci 70: 661–687, 2013. doi: 10.1007/s00018-012-1073-7. [DOI] [PMC free article] [PubMed] [Google Scholar]
- 33.Patsouris D, Reddy JK, Müller M, Kersten S. Peroxisome proliferator-activated receptor alpha mediates the effects of high-fat diet on hepatic gene expression. Endocrinology 147: 1508–1516, 2006. doi: 10.1210/en.2005-1132. [DOI] [PubMed] [Google Scholar]
- 34.Patterson AD, Shah YM, Matsubara T, Krausz KW, Gonzalez FJ. Peroxisome proliferator-activated receptor alpha induction of uncoupling protein 2 protects against acetaminophen-induced liver toxicity. Hepatology 56: 281–290, 2012. doi: 10.1002/hep.25645. [DOI] [PMC free article] [PubMed] [Google Scholar]
- 35.Peters JM, Cattley RC, Gonzalez FJ. Role of PPAR alpha in the mechanism of action of the nongenotoxic carcinogen and peroxisome proliferator Wy-14,643. Carcinogenesis 18: 2029–2033, 1997. doi: 10.1093/carcin/18.11.2029. [DOI] [PubMed] [Google Scholar]
- 36.Peters JM, Rusyn I, Rose ML, Gonzalez FJ, Thurman RG. Peroxisome proliferator-activated receptor alpha is restricted to hepatic parenchymal cells, not Kupffer cells: implications for the mechanism of action of peroxisome proliferators in hepatocarcinogenesis. Carcinogenesis 21: 823–826, 2000. doi: 10.1093/carcin/21.4.823. [DOI] [PubMed] [Google Scholar]
- 37.Pfaffl MW. A new mathematical model for relative quantification in real-time RT-PCR. Nucleic Acids Res 29: e45, 2001. doi: 10.1093/nar/29.9.e45. [DOI] [PMC free article] [PubMed] [Google Scholar]
- 38.Qu A, Jiang C, Cai Y, Kim JH, Tanaka N, Ward JM, Shah YM, Gonzalez FJ. Role of Myc in hepatocellular proliferation and hepatocarcinogenesis. J Hepatol 60: 331–338, 2014. doi: 10.1016/j.jhep.2013.09.024. [DOI] [PMC free article] [PubMed] [Google Scholar]
- 39.Qu A, Shah YM, Matsubara T, Yang Q, Gonzalez FJ. PPARalpha-dependent activation of cell cycle control and DNA repair genes in hepatic nonparenchymal cells. Toxicol Sci 118: 404–410, 2010. doi: 10.1093/toxsci/kfq259. [DOI] [PMC free article] [PubMed] [Google Scholar]
- 40.Ray A, Dittel BN. Isolation of mouse peritoneal cavity cells. J Vis Exp 35: 1488, 2010. doi: 10.3791/1488. [DOI] [PMC free article] [PubMed] [Google Scholar]
- 41.Roberts RA, Ganey PE, Ju C, Kamendulis LM, Rusyn I, Klaunig JE. Role of the Kupffer cell in mediating hepatic toxicity and carcinogenesis. Toxicol Sci 96: 2–15, 2007. doi: 10.1093/toxsci/kfl173. [DOI] [PubMed] [Google Scholar]
- 42.Roberts RA, Kimber I. Cytokines in non-genotoxic hepatocarcinogenesis. Carcinogenesis 20: 1397–1401, 1999. doi: 10.1093/carcin/20.8.1397. [DOI] [PubMed] [Google Scholar]
- 43.Rose ML, Rusyn I, Bojes HK, Germolec DR, Luster M, Thurman RG. Role of Kupffer cells in peroxisome proliferator-induced hepatocyte proliferation. Drug Metab Rev 31: 87–116, 1999. doi: 10.1081/DMR-100101909. [DOI] [PubMed] [Google Scholar]
- 44.Rusyn I, Tsukamoto H, Thurman RG. WY-14 643 rapidly activates nuclear factor kappaB in Kupffer cells before hepatocytes. Carcinogenesis 19: 1217–1222, 1998. doi: 10.1093/carcin/19.7.1217. [DOI] [PubMed] [Google Scholar]
- 45.Stienstra R, Saudale F, Duval C, Keshtkar S, Groener JE, van Rooijen N, Staels B, Kersten S, Müller M. Kupffer cells promote hepatic steatosis via interleukin-1beta-dependent suppression of peroxisome proliferator-activated receptor alpha activity. Hepatology 51: 511–522, 2010. doi: 10.1002/hep.23337. [DOI] [PubMed] [Google Scholar]
- 46.Tanaka N, Takahashi S, Zhang Y, Krausz KW, Smith PB, Patterson AD, Gonzalez FJ. Role of fibroblast growth factor 21 in the early stage of NASH induced by methionine- and choline-deficient diet. Biochim Biophys Acta 1852: 1242–1252, 2015. doi: 10.1016/j.bbadis.2015.02.012. [DOI] [PMC free article] [PubMed] [Google Scholar]
- 47.Tsutsui H, Nishiguchi S. Importance of Kupffer cells in the development of acute liver injuries in mice. Int J Mol Sci 15: 7711–7730, 2014. doi: 10.3390/ijms15057711. [DOI] [PMC free article] [PubMed] [Google Scholar]
- 48.Vats D, Mukundan L, Odegaard JI, Zhang L, Smith KL, Morel CR, Wagner RA, Greaves DR, Murray PJ, Chawla A. Oxidative metabolism and PGC-1beta attenuate macrophage-mediated inflammation. Cell Metab 4: 13–24, 2006. doi: 10.1016/j.cmet.2006.05.011. [DOI] [PMC free article] [PubMed] [Google Scholar]
- 49.Woods CG, Burns AM, Bradford BU, Ross PK, Kosyk O, Swenberg JA, Cunningham ML, Rusyn I. WY-14,643 induced cell proliferation and oxidative stress in mouse liver are independent of NADPH oxidase. Toxicol Sci 98: 366–374, 2007. doi: 10.1093/toxsci/kfm104. [DOI] [PubMed] [Google Scholar]
- 50.Xie C, Li L, Xu YP, Zhu YY, Jiang JJ. Anti-fibrosis effects of fenofibrate in mice with hepatic fibrosis. Zhonghua Gan Zang Bing Za Zhi 21: 914–919, 2013. doi: 10.3760/cma.j.issn.1007-3418.2013.12.008. [DOI] [PubMed] [Google Scholar]
- 51.Yakar S, Liu JL, Stannard B, Butler A, Accili D, Sauer B, LeRoith D. Normal growth and development in the absence of hepatic insulin-like growth factor I. Proc Natl Acad Sci USA 96: 7324–7329, 1999. doi: 10.1073/pnas.96.13.7324. [DOI] [PMC free article] [PubMed] [Google Scholar]
- 52.Yang J, Zhang L, Yu C, Yang XF, Wang H. Monocyte and macrophage differentiation: circulation inflammatory monocyte as biomarker for inflammatory diseases. Biomark Res 2: 1, 2014. doi: 10.1186/2050-7771-2-1. [DOI] [PMC free article] [PubMed] [Google Scholar]
- 53.Yang Q, Ito S, Gonzalez FJ. Hepatocyte-restricted constitutive activation of PPAR alpha induces hepatoproliferation but not hepatocarcinogenesis. Carcinogenesis 28: 1171–1177, 2007. doi: 10.1093/carcin/bgm046. [DOI] [PMC free article] [PubMed] [Google Scholar]
- 54.Yin C, Evason KJ, Asahina K, Stainier DY. Hepatic stellate cells in liver development, regeneration, and cancer. J Clin Invest 123: 1902–1910, 2013. doi: 10.1172/JCI66369. [DOI] [PMC free article] [PubMed] [Google Scholar]
- 55.Yoo SH, Abdelmegeed MA, Song BJ. Activation of PPARα by Wy-14643 ameliorates systemic lipopolysaccharide-induced acute lung injury. Biochem Biophys Res Commun 436: 366–371, 2013. doi: 10.1016/j.bbrc.2013.05.073. [DOI] [PMC free article] [PubMed] [Google Scholar]
- 56.Yoo SH, Park O, Henderson LE, Abdelmegeed MA, Moon KH, Song BJ. Lack of PPARα exacerbates lipopolysaccharide-induced liver toxicity through STAT1 inflammatory signaling and increased oxidative/nitrosative stress. Toxicol Lett 202: 23–29, 2011. doi: 10.1016/j.toxlet.2011.01.013. [DOI] [PMC free article] [PubMed] [Google Scholar]