Abstract
Although seasonal modifications of brown adipose tissue (BAT) in hibernators are well documented, we know little about functional regulation of BAT in different phases of hibernation. In the 13-lined ground squirrel, liver mitochondrial respiration is suppressed by up to 70% during torpor. This suppression is reversed during arousal and interbout euthermia (IBE), and corresponds with patterns of maximal activities of electron transport system (ETS) enzymes. Uncoupling of BAT mitochondria is controlled by free fatty acid release stimulated by sympathetic activation of adipocytes, so we hypothesized that further regulation at the level of the ETS would be of little advantage. As predicted, maximal ETS enzyme activities of isolated BAT mitochondria did not differ between torpor and IBE. In contrast to this pattern, respiration rates of mitochondria isolated from torpid individuals were suppressed by ~60% compared with rates from IBE individuals when measured at 37°C. At 10°C, however, mitochondrial respiration rates tended to be greater in torpor than IBE. As a result, the temperature sensitivity (Q10) of mitochondrial respiration was significantly lower in torpor (~1.4) than IBE (~2.4), perhaps facilitating energy savings during entrance into torpor and thermogenesis at low body temperatures. Despite the observed differences in isolated mitochondria, norepinephrine-stimulated respiration rates of isolated BAT adipocytes did not differ between torpor and IBE, perhaps because the adipocyte isolation requires lengthy incubation at 37°C, potentially reversing any changes that occur in torpor. Such changes may include remodeling of BAT mitochondrial membrane phospholipids, which could change in situ enzyme activities and temperature sensitivities.
Keywords: uncoupled thermogenesis, Q10, electron transport system, hibernation, mitochondria
as endotherms, mammals maintain a core body temperature (Tb) despite variations in environmental (ambient) temperature (Ta). Although this strategy is beneficial in many ways, especially regarding habitat selection, it comes at a great energetic cost in winter because very low Ta is usually accompanied by diminished availability of food energy required to fuel thermogenic metabolism. Mammalian hibernators cope with this high-energy demand and low fuel supply by undergoing a profound suppression of metabolic rate (MR) while tolerating a large reduction in Tb.
The 13-lined ground squirrel (Ictidomys tridecemlineatus) is a well-studied experimental model that copes with the energetic challenge of winter by hibernating from midautumn through early spring. In this species, the hibernation season is characterized by recurrent torpor bouts that are spontaneously interrupted by short periods of euthermia every 7–12 days. During these interbout euthermia (IBE) periods, MR increases by >20-fold, and Tb rises from 5°C to ~37°C within a few hours and remains elevated for as long as 12 h (6). The rapid increase in Tb during arousal from torpor to IBE is realized largely through activation of brown adipose tissue (BAT) located mostly near the cervical and axillary regions of the thorax. In other sciurid hibernators, nonshivering thermogenesis appears to be the principal source of heat during arousal and IBE. For example, during arousal in arctic ground squirrels, whole animal oxygen consumption increases >5-fold before shivering is observed and remains high during IBE after shivering ceases (32).
During entrance into torpor, a reduction in the thermoregulatory set point (Tset) shifts the lower limit of the thermoneutral zone (TNZ) to lower ambient temperatures (27). This drop in Tset would cease sympathetic activation of BAT, effectively halting thermogenesis in this tissue. During arousal from torpor, Tset increases toward euthermic levels (16) so that ambient temperatures that had been within the TNZ during torpor suddenly become well below the lower limit of the TNZ. As a result, thermogenesis is presumably initiated, resulting in large increases in MR, due primarily to BAT activation (32), even before Tb increases.
Activation of BAT thermogenesis occurs through a signaling cascade initiated by norepinephrine (NE) release (10). The NE activates β3-adrenergic G protein-coupled receptors on the surface of the brown adipocyte, which stimulate cAMP production and activation of cytosolic protein kinase A, which subsequently activates hormone-sensitive lipase (HSL) and adipose triglyceride lipase (ATGL). The activation of HSL and ATGL triggers free fatty acid release from triglyceride stores within the brown adipocyte cytosol. These free fatty acids are transported across the outer mitochondrial membrane, into the intermembrane space, leading to dissipation of inner mitochondrial membrane proton motive force (PMF). This dissipation, mediated by uncoupling protein 1 (UCP1; Ref. 10), stimulates substrate oxidation and flux through the electron transport system (ETS). Because BAT mitochondria express little F1FO ATPase (11a), substrate oxidation is effectively uncoupled from ATP synthesis, and virtually all of the free energy released by substrate oxidation and ETS function is effectively released as heat. This heat release is amplified by the dissipation of the PMF (29).
As ground squirrels prepare for hibernation, both water-fat MRI (A. D. V. MacCannell, K. Sinclair, L. Friesen-Waldner, and J. F. Staples, unpublished observations) and tissue dissection (17) show that the mass of thoracic BAT depots increase, even in the absence of cold acclimation. This tissue growth is accompanied by an increase in the abundance of BAT mitochondria (22). These changes correspond with increased expression of several genes involved in BAT uncoupled thermogenesis, such as those encoding for UCP1 (15). These responses increase the BAT thermogenic capacity of hibernators before and throughout the winter.
The adrenergic regulation of BAT function is well understood (10), and the seasonal modifications of BAT are becoming clearer in hibernators. Recently, interest has also turned to the investigation of functional regulation of BAT mitochondria as hibernators cycle through the different phases of a torpor bout (e.g., Ref. 3). In recent years, several research groups, including our own, have demonstrated profound reversible suppression of liver mitochondrial metabolism among these phases (23). Isolated liver mitochondria show a ~70% suppression of succinate-fueled state 3 (coupled to ATP synthesis) respiration rates during torpor compared with IBE (5). This suppression at the organelle level is accompanied by suppression of maximal activities of ETS complexes I and II (13a). The liver represents a high contribution to whole animal metabolism, relative to its mass, so the observed suppression of liver mitochondrial metabolism is estimated to contribute 5% to whole animal energy savings, even without any change in Tb (29). During arousal and IBE, BAT accounts for a high proportion of whole animal metabolism (32), but during entrance into torpor when Tset decreases, sympathetic activation of BAT free fatty acid release ceases and uncoupled thermogenesis likely no longer contributes significantly to MR. Because the activity of BAT is tightly regulated at the cellular level, we hypothesized that further suppression of BAT mitochondrial respiration in torpor would be of little advantage. We predicted that, unlike liver, there would be no further suppression of BAT mitochondrial respiration between torpor and IBE and that maximal activities of ETS enzymes would not differ between these two states. The first objective of this study was to test this hypothesis.
In the early stages of arousal, BAT mitochondria begin functioning at very low temperatures, near 5°C, but as Tb rises they function closer to euthermic temperatures. The in vitro assay temperature affects the degree of metabolic suppression seen in ground squirrel liver mitochondria, and the temperature sensitivity of mitochondrial respiration is greater in torpor than IBE (5). The second objective of this study was to assess the effects of temperature on the respiration rates and maximal ETS enzyme activity of BAT mitochondria isolated from torpid and IBE animals.
To examine further the differences between torpor and IBE in this tissue at a higher level of organization, our third objective was to compare the NE stimulatory effects on respiration of isolated, intact BAT adipocytes between torpor and IBE and evaluate the effects of temperature on this respiration.
MATERIALS AND METHODS
Experimental animals.
All procedures were approved by the University of Western Ontario Animal Use Subcommittee and followed guidelines of the Canadian Council on Animal Care. The 13-lined ground squirrels (I. tridecemlineatus) used in this study were either live-trapped in Carman, Manitoba, Canada (49.4° N, 98.0° W; see Ref. 7) or bred in captivity at the University of Western Ontario following husbandry guidelines published previously (33). The squirrels were housed at 25°C ± 3°C and with the same photoperiod as Carman, Manitoba (adjusted weekly) until November. In November, animals were moved to environmental chambers where the temperature was decreased 1°C/day until reaching 4°C ± 2°C. At this time, photoperiod was reduced to 2-h light (allowing for animal care procedures) and 22-h dark. Food and water were provided ad libitum until torpor was observed, after which food was withdrawn because this species does not eat throughout the hibernation season. Hibernation state was evaluated by Tb, which was monitored continuously using temperature-sensitive radiotelemeters (Data Sciences International, St. Paul, MN) that were surgically implanted in each animal in the preceding summer (23).
Squirrels in this study were considered either torpid (with a stable Tb near 5°C for 3–4 days) or spontaneously aroused into IBE (with a stable Tb near 37°C for 2–4 h). IBE animals were euthanized with an anesthetic overdose (Euthanyl, 240 mg/ml, 0.2 ml/100 g). Euthanyl does not affect mitochondrial metabolism (31). Torpid animals were euthanized by cervical dislocation, as handling and an injection of Euthanyl may have forced an arousal. Brown adipose tissue was collected from both left and right axillary regions of each animal. Approximately 2 g was used for each mitochondrial or adipocyte isolation (see following sections). There were no significant differences (P = 0.46, t-test) in body mass between the animals in the torpor (185.3 ± 8.7 g SE) or IBE groups for this study (175.2 ± 10.3 g SE).
Isolation of mitochondria.
Mitochondria were isolated through differential centrifugation following methods outlined by Cannon and Nedergaard (11) and Muleme et al. (23). Brown adipose tissue was minced using single-edged razor blades and then gently homogenized using a glass mortar with a Teflon pestle (4–5 strokes) in homogenization buffer (250 mM sucrose, 1 mM EGTA, 10 mM HEPES, pH 7.4). Both mincing and homogenization were performed in glassware cooled on ice. The homogenate was then filtered through 2 layers of cheesecloth and centrifuged for 10 min at 8,700 g (all centrifugation steps were performed at 4°C). The pellet was then resuspended in ice-cold homogenization buffer and centrifuged for 10 min at 800 g. The supernatant (containing mitochondria) was then transferred carefully to a clean, ice-cold tube, and the pellet was discarded. The supernatant was then centrifuged at 8,700 g for 10 min. The resulting mitochondrial pellet was resuspended in ice-cold homogenization buffer and centrifuged again at 8,700 g for 10 min twice more. The pellet was then resuspended in ice-cold homogenization buffer. Isolated mitochondria were used immediately for assessment of respiration (see next section), and aliquots were frozen at −80°C for subsequent enzyme assays.
Mitochondrial respiration.
Respiration rates of isolated BAT mitochondria were evaluated with high-resolution respirometry using Clark-type polarographic oxygen electrodes (Oxygraph-2k; Oroboros, Innsbruck, Austria) in 2 ml of respiration buffer (110 mM sucrose, 60 mM K-lactobionate, 20 mM HEPES, 20 mM taurine, 10 mM KH2PO4, 3 mM MgCl2, 0.5 mM EGTA, 1 g/l BSA, pH 7.1). The Oxygraph-2k was calibrated to air-saturated and oxygen-depleted (obtained with a yeast suspension) buffer. All measurements were performed with constant stirring (750 rpm) and constant temperature, either 10°C or 37°C. These two temperatures were chosen to simulate Tb during both torpor and IBE. Although the Tb of these squirrels in torpor is ~5°C, the Oxygraph-2k only produced consistent results at temperatures of 10°C or higher. Respiration rates were determined in the presence of 1 mM malate with pyruvate (1 mM) and octanoyl carnitine (2.5 mM) as substrates. These rates were later standardized to mitochondrial protein content determined by Bradford assay. To ensure that these respiration rates were UCP1-mediated, GDP (1 mM) was added (11). ADP (1 mM) was then added to assess state 3 respiration rates, which were then inhibited by oligomycin (1.25 μM).
Enzyme assays.
Mitochondrial ETS enzyme assays were adapted from methods outlined by Kirby et al. (18). Frozen isolated mitochondrial aliquots were thawed and centrifuged at 20,000 g and 4°C for 10 min. These pellets were resuspended in hypotonic medium (25 mM K2HPO4, 5 mM MgCl2, pH 7.4) containing phosphatase and deacetylase inhibitors (1% Phosphatase Inhibitor Cocktail 3, Sigma-Aldrich; 1% Deacetylation Inhibition Cocktail, Santa Cruz Biotechnology) to a concentration of 1 mg protein/ml and freeze-thawed three times using liquid nitrogen and cold water.
All assays that were performed at 37°C used a SpectraMax plate spectrophotometer (Molecular Devices, Sunnyvale, CA) and were conducted in 96-well polystyrene microplates rather than individual cuvettes. Assay conditions were adapted accordingly for triplicate assays in 350-μl wells. Reaction conditions are outlined in Table 1.
Table 1.
ETS enzyme assay reaction conditions for both 37°C and 10°C
| Enzyme | Assay Temperature, °C | Mitochondrial Sample, μg of Total Protein | Reaction Conditions | Absorbance Wavelength, nm |
|---|---|---|---|---|
| Complex I | 37 | 10 | 25 mM K2HPO4 (pH 7.2) | 340 |
| 10 | 50 | 2 μg/ml antimycin A 2 mM KCN 2.5 mg/ml BSA 0.2 mM NADH |
||
| Complex II | 37 | 5 | 25 mM K2HPO4 (pH 7.2) | 600 |
| 10 | 50 | 2 μg/ml rotenone 2 μg/ml antimycin A 2 mM KCN 20 mM succinate 50 μM dichlorophenolindophenol 0.1 mM ubiquinone1 |
||
| Complex III | 37 | 1 | 25 mM K2HPO4 (pH 7.2) | 550 |
| 10 | 10 | 2 μg/ml rotenone 2 mM KCN 2.5 mg/ml BSA 0.6 mM n-dodecyl-β-d-maltoside 15 mM oxidized cytochrome c 0.26 mM ubiquinone2 |
||
| Complex IV | 37 | 1 | 25 mM K2HPO4 (pH 7.2) | 550 |
| 10 | 5 | 5 mM MgCl2 2.5 mg/ml BSA 0.6 mM lauryl maltoside 50 μM reduced cytochrome c |
||
| Complex V | 37 | 3 | 5 mM ATP | 340 |
| 10 | 40 | 1 mM phosphoenolpyruvate 0.2 mM NADH 1 U/ml pyruvate kinase 1 U/ml lactate dehydrogenase |
All assays performed at 10°C used a Cary 100 UV-Vis spectrophotometer (Varian, Palo Alto, CA) with disposable polystyrene cuvettes and a 1-ml reaction volume. Temperature was maintained using a Peltier temperature control module.
Isolation of brown adipocytes.
Brown adipocytes were isolated following methods adapted from Cannon and Nedergaard (11). Briefly, the axillary BAT (~2 g) of one squirrel was dissected out and placed in a small volume of ice-cold Krebs-Ringer phosphate buffer (109 mM NaCl, 6.9 mM KCl, 1.5 mM CaCl2, 1.4 mM MgSO4, 16.7 mM Na2HPO4, 5.6 mM NaH2PO4, 20 mM glucose, 4% fatty-acid-free bovine serum albumin, pH 7.4) and carefully cleaned of contaminating tissues. The tissue was preincubated for 5 min in a slowly shaking water bath at 37°C in Krebs-Ringer phosphate buffer with 1.66 mg/ml collagenase (Collagenase Type II; Worthington Biochemical) and vortexed for 5 s. The tissue was filtered onto 250-μm nylon mesh, minced with scissors, and incubated in Krebs-Ringer phosphate buffer with collagenase for 25 min at 37°C with 5 s of vortexing every 5 min. The tissue was vortexed for 15 s and filtered through nylon mesh, and the filtrate was collected and placed on ice. The remaining tissue pieces were incubated for 15 min more at 37°C, vortexed for 15 s, filtered through 250-μm nylon mesh, and kept on ice. The remaining tissue pieces were collected again and incubated as above to increase yield. The above filtrates were combined and centrifuged at 60 g for 5 min at 4°C and left to stand and settle for at least 30 min on ice. Cells were carefully collected from the adipocyte layer using a Pasteur pipette. The isolated cells were kept on ice for ~4 h. Cells were counted using a hemocytometer at room temperature (~22°C), and viability was determined using trypan blue exclusion (0.4% Trypan Blue solution; Sigma-Aldrich). All cell suspensions had >95% viability.
Adipocyte respiration.
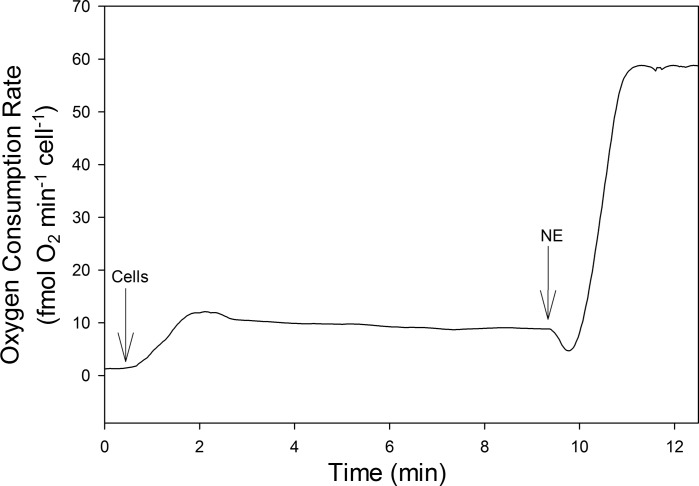
Respiration rates of isolated brown adipocytes were evaluated with high-resolution respirometry using the Oxygraph-2k in 2 ml of Krebs-Ringer bicarbonate buffer (118 mM NaCl, 6 mM KCl, 2.5 mM CaCl2, 1.2 mM MgSO4, 1.2 mM NaH2PO4, 25.3 mM NaHCO3, 20 mM glucose, 4% fatty-acid-free BSA, pH 7.4, equilibrated with 5% CO2 in air). All measurements were performed at constant temperature, either 10°C or 37°C. Cells were added to Oxygraph-2k chamber to a final concentration of 80,000 cells/ml buffer, and a basal respiration rate was recorded. The chamber lights were turned off, as norepinephrine (NE; l-norepinephrine d-bitartrate salt monohydrate) is light-sensitive, and NE was added to a final concentration of 1 mM to achieve the NE-stimulated rate. An example trace of data collected from the Oxygraph-2k is shown in Fig. 1.
Fig. 1.
Oxygen consumption of isolated brown adipose tissue adipocytes from 1 interbout euthermia (IBE) animal measured at 10°C. Arrows indicate times at which the following additions were made: cells were added and a basal respiration rate was recorded; norepinephrine (NE) was added to achieve the NE-stimulated rate.
Statistical analyses.
All values are represented as means ± SE unless otherwise stated. All statistical analyses were conducted using R software (R Core Team 2015). Statistical significance was determined by two-tailed Student's t-tests for two-group comparisons [body mass, ETS enzyme assays, and temperature sensitivity (Q10) values]. Split-plot ANOVAs with Fisher least significant difference post hoc analyses were used to assess significant differences between hibernation state and assay temperature for mitochondrial (both fuels) and cellular respiration rates (basal and NE-stimulated rates and the fold change between basal and stimulated rates). Statistical differences were considered significant when P < 0.05.
RESULTS
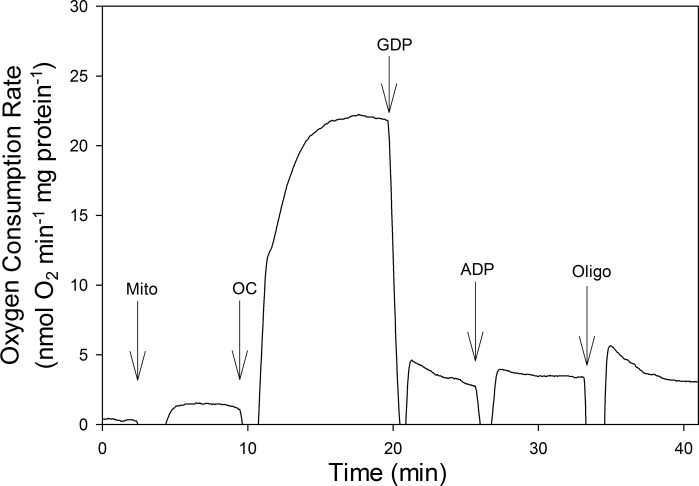
Respiration was assessed in BAT mitochondria isolated from both torpid and IBE ground squirrels. An example of the data collected is depicted in Fig. 2, which shows that the addition of octanoyl carnitine, with malate, produced a high uncoupled respiration rate. Most of this uncoupled respiration was UCP1-mediated, as the addition of GDP, an inhibitor of UCP1, caused an immediate and substantial decrease in oxygen consumption. Subsequent addition of ADP and oligomycin did not significantly alter respiration, consistent with very low concentrations of complex V compared with other ETS enzymes (reviewed in Ref. 11).
Fig. 2.
Oxygen consumption of isolated brown adipose tissue mitochondria from 1 IBE animal measured at 10°C using octanoyl carnitine as a fuel. Arrows indicate times at which the following additions were made: Mito, isolated mitochondria; OC, octanoyl carnitine and malate; GDP, guanosine 5′-diphosphate; ADP, adenosine 5′-diphosphate; Oligo, oligomycin.
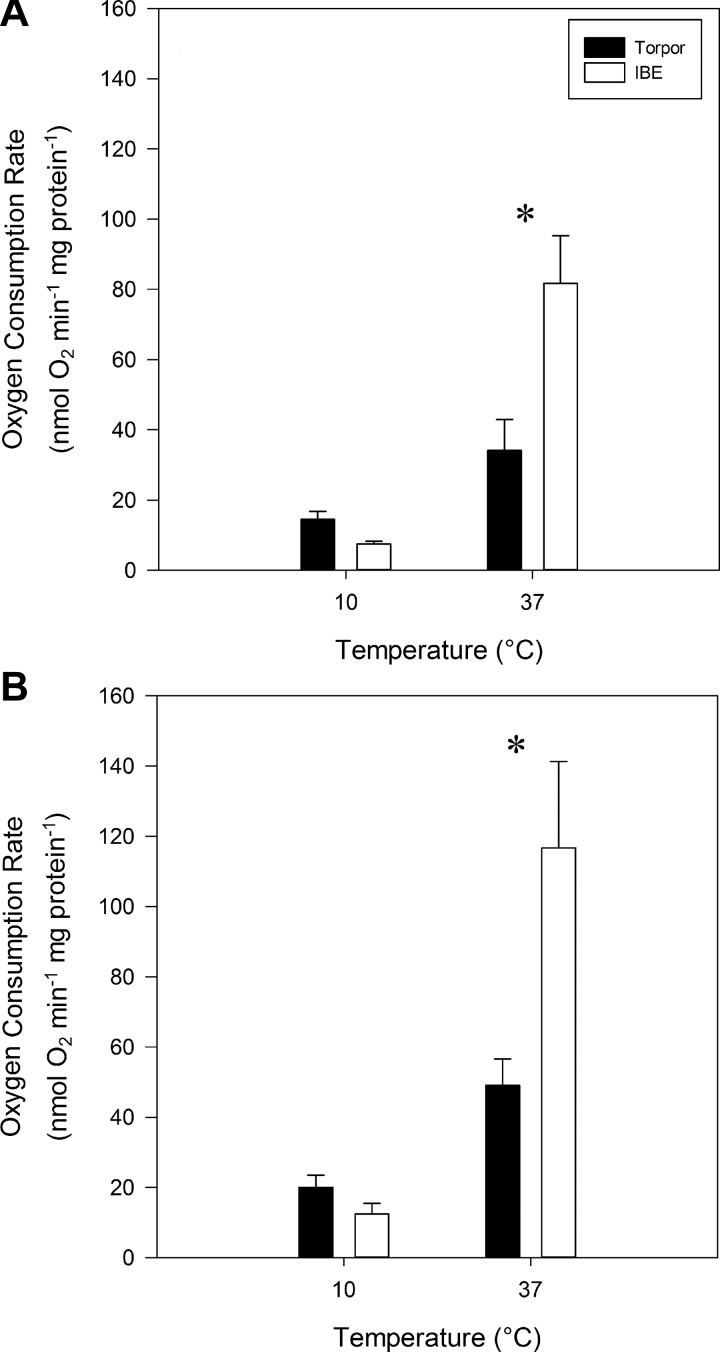
When assayed at an in vitro temperature of 37°C, mitochondria isolated from IBE animals displayed 62% higher uncoupled respiration rates than those from torpor using both fuels, pyruvate (Fig. 3A; P = 0.015) and octanoyl carnitine (Fig. 3B; P = 0.021). When measured at 10°C, we saw the opposite trend, with respiration rates from torpid animals appearing to be higher than IBE, although there were no statistically significant differences between the hibernation states (Fig. 3). At 10°C, the respiration data are quite variable and yield statistical powers ranging from 0.25 to 0.46. Unfortunately, the infrequent and somewhat unpredictable nature of spontaneous arousals within the short hibernation season precluded larger sample sizes for this study. Nonetheless, taken as a whole, our respirometry results demonstrate that BAT mitochondria experience reversible suppression in torpor compared with IBE.
Fig. 3.
Uncoupled respiration rates from isolated brown adipose tissue mitochondria using pyruvate (A) and octanoyl carnitine (B) as fuel. Respiration rates of isolated mitochondria were standardized to protein concentration. Values represent means + SE and n = 4 for all groups. Statistical significance between torpor and IBE is denoted with an asterisk (P < 0.05).
We also measured maximal activities of ETS enzymes using homogenized, isolated mitochondria. There were no significant differences in maximal enzyme activity between IBE and torpor for any of the five ETS complexes, regardless of whether assays were performed at 10°C or 37°C (Fig. 4). These results indicate that temperature sensitivity differences between torpor and IBE in BAT mitochondrial respiration are not due to individual ETS enzyme activity suppression but that some other interactions may be occurring.
Fig. 4.
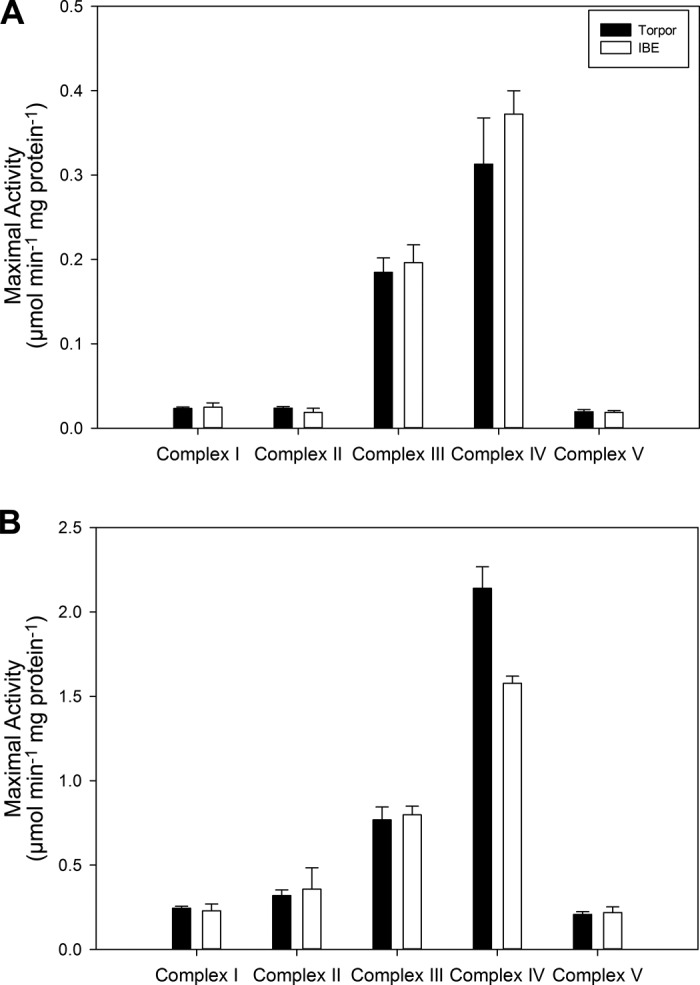
Maximal enzyme activity of electron transport system complexes using homogenized, isolated, brown adipose tissue mitochondria assayed at 10°C (A) and 37°C (B) and standardized to protein content. Values are means + SE except where sample size <3, in which case error bars represent range. Sample sizes for 10°C activities are 6 (torpor) and 2 (IBE) for all 5 complexes. Sample sizes for 37°C activities are 9 (torpor) and 7 (IBE) for complexes I–III and V. Sample sizes for complex IV 37°C rates are 5 (torpor) and 2 (IBE). No significant differences were observed between hibernation states for any of the complexes (P > 0.05).
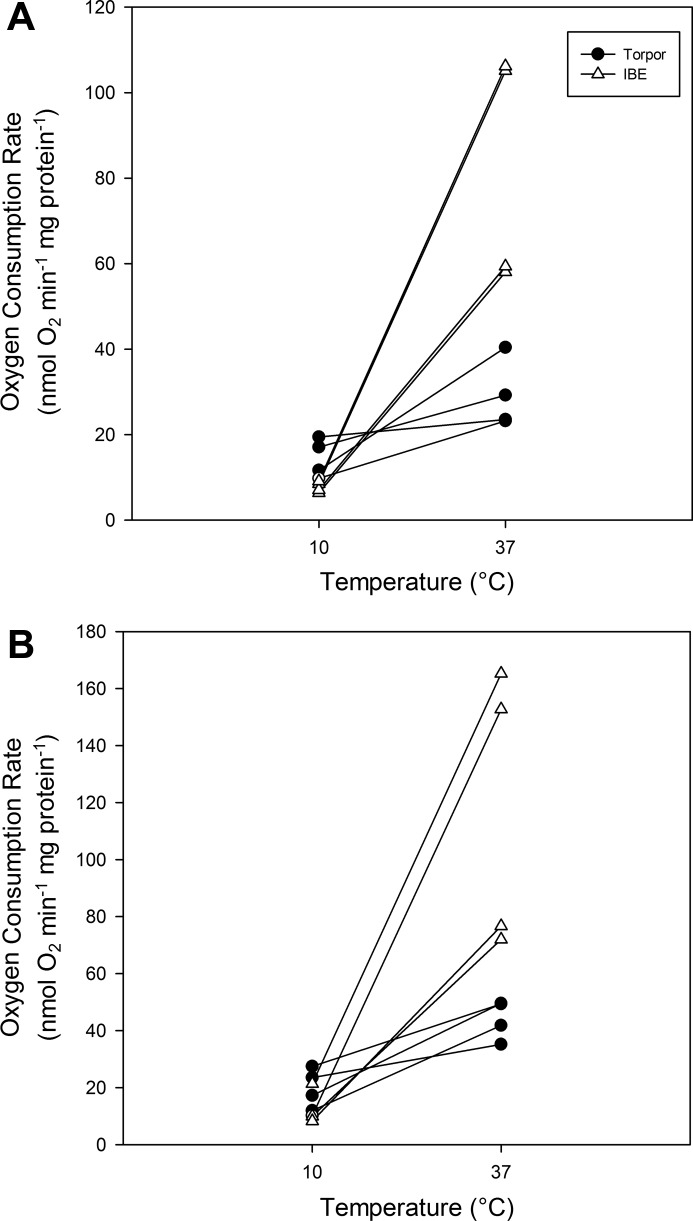
To examine further the effects of temperature on mitochondria, we constructed interactions plots of respiration rates for mitochondria preparations isolated from the same individuals (Fig. 5). This plot shows limited overlap among torpor and IBE individuals at 10°C but no overlap whatsoever at 37°C. From these data, we calculated individual Q10 values. The mean Q10 values of mitochondria isolated from torpid animals were significantly lower than those isolated during IBE (Table 2; P = 0.002). In contrast to the intact mitochondria, there were no differences in the temperature sensitivity of maximal ETS enzyme activity between torpor and IBE, regardless of assay temperature; the Q10 values ranged from 1.68 to 2.97 and were quite similar between torpor and IBE for individual enzyme complexes (Table 3).
Fig. 5.
Interaction plots of mitochondrial respiration rates from isolated brown adipose tissue mitochondria at 10°C and 37°C using pyruvate (A) and octanoyl carnitine (B) as fuel. Points connected by a line represent data from the same individual.
Table 2.
Mean Q10 values for state 2 respiration rates of BAT mitochondria isolated from torpid or interbout euthermic (IBE) 13-lined ground squirrels measured in vitro at 10°C and 37°C
| Q10 |
||
|---|---|---|
| Oxidative Substrate | IBE | Torpor |
| Pyruvate | 2.40 ± 0.06 | 1.38 ± 0.17* |
| Octanoyl carnitine | 2.30 ± 0.15 | 1.42 ± 0.13* |
Values are means ± SE and derived from mitochondrial respiration rates from individual animals and measured at both temperatures, plotted in Fig. 5.
Significantly lower values (2-tailed Student's t-test, P < 0.05).
Table 3.
Q10 values for maximal ETS enzyme activities calculated from mean maximal enzyme activities at 10°C and 37°C
| Q10 |
||
|---|---|---|
| Enzyme | IBE | Torpor |
| Complex I | 2.27 | 2.38 |
| Complex II | 2.61 | 2.97 |
| Complex III | 1.69 | 1.68 |
| Complex IV | 1.71 | 2.04 |
| Complex V | 2.47 | 2.40 |
Values were calculated from the mean maximal activities of each ETS complex, as small sample sizes in some groups did not allow for individual calculations.
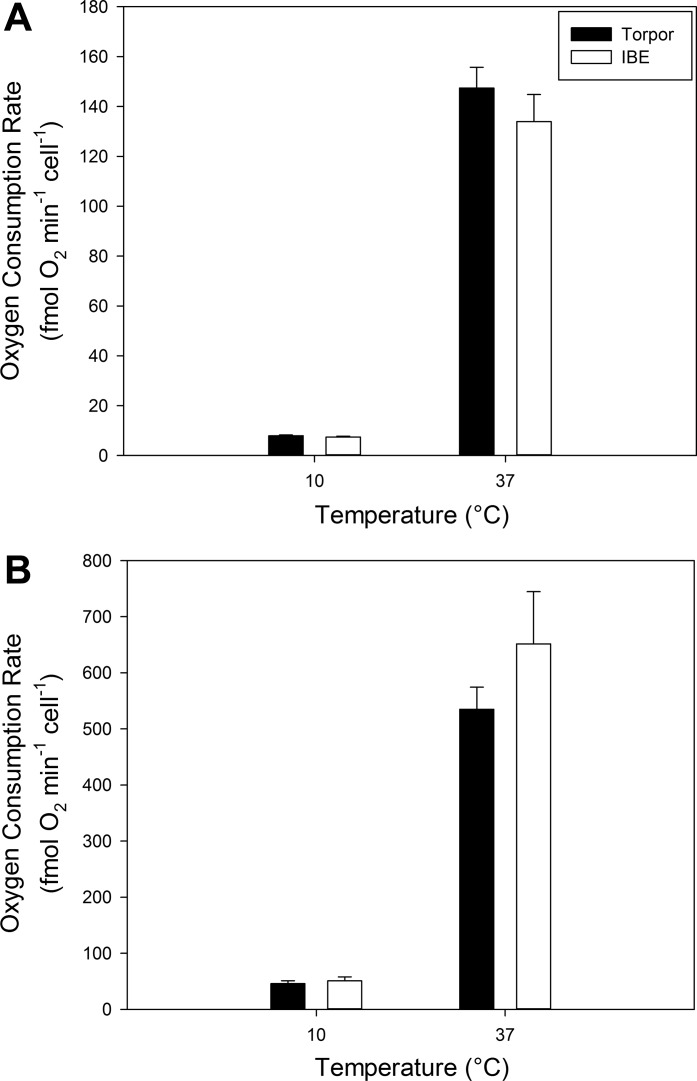
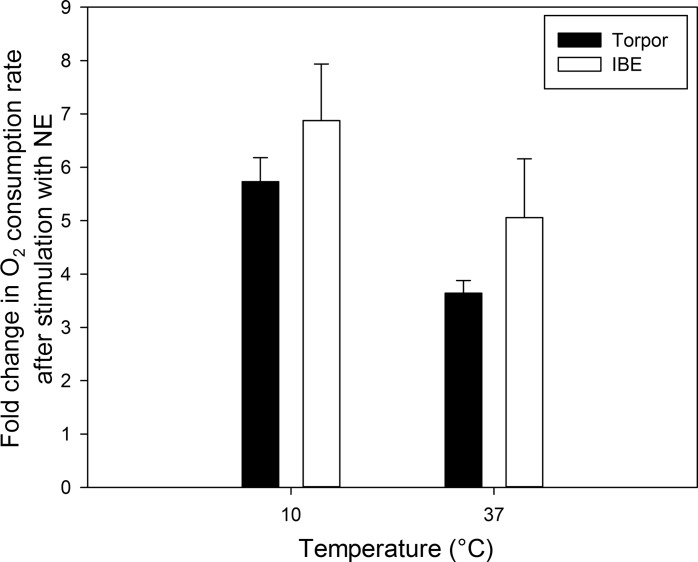
Basal and NE-stimulated adipocyte respiration rates did not differ significantly between torpor and IBE at either in vitro temperature (Fig. 6; Basal P = 0.365 and NE-stimulated P = 0.251). The Q10 values for these respiration rates were all between 2 and 3 (Table 4) and did not differ significantly between torpor and IBE, which suggests that the temperature sensitivity of BAT adipocyte respiration does not differ between these states. To assess any potential differences in NE sensitivity and its ability to stimulate respiration rates, we calculated the fold change in respiration rate from basal to NE-stimulated conditions for each individual preparation and at both temperatures. There were no significant differences in the response of adipocyte respiration to NE between torpor and IBE regardless of in vitro assay temperature, with respiration increasing 3.6- to 6.8-fold following NE treatment (Fig. 7; P = 0.680).
Fig. 6.
Basal (A) and norepinephrine (NE; B)-stimulated oxygen consumption rates of isolated brown adipocytes. Rates are standardized to cell concentration. Values represent means + SE. There were no significant differences between torpor (n = 5) and IBE (n = 4).
Table 4.
Mean Q10 values for adipocyte respiration rates at 10°C and 37°C
| Q10 |
||
|---|---|---|
| Adipocyte Respiration Rate | IBE | Torpor |
| Basal | 2.91 ± 0.06 | 2.95 ± 0.09 |
| NE-stimulated | 2.57 ± 0.05 | 2.50 ± 0.24 |
Values are means ± SE derived from adipocyte respiration rates from each individual measured at both temperatures. Mean adipocyte respiration rates for all groups are shown in Fig. 6.
Fig. 7.
Response of oxygen consumption rate to norepinephrine (NE) stimulation in isolated brown adipocytes. The fold change in respiration rate from the basal rate to the NE-stimulated rate was calculated for each individual. Values represent means + SE. There were no significant differences between torpor (n = 5) and IBE (n = 4).
DISCUSSION
One goal of this study was to determine whether brown adipose tissue mitochondria showed reversible metabolic suppression between hibernation states. In several tissues of hibernators, including liver, skeletal muscle, and cardiac muscle, the transition from IBE to torpor corresponds with a significant suppression of mitochondrial respiration (4, 5, 8). We hypothesized that there would be no suppression of mitochondrial respiration rates or ETS complex activity between torpor and IBE because BAT mitochondrial uncoupling through UCP1 is regulated by free fatty release within the cytosol, which is stimulated by sympathetic activation. During entrance into torpor, as Tset decreases, sympathetic activation of BAT would cease, the levels of free fatty acids would decrease, and BAT uncoupled mitochondrial respiration would fall to a minimum. As a result, acute suppression of BAT mitochondrial respiration, for example by posttranslational modification of ETS enzymes (13), would be of no further advantage.
To test this hypothesis, we measured oxygen consumption rates of isolated mitochondria. These rates are in close agreement with those reported for BAT mitochondria isolated from rats and mice (11, 26). As predicted, we found no differences in the maximal activities of ETS complexes (Fig. 4) or the adipocyte respiration rates (Fig. 6) between IBE and torpor at either temperature. Contrary to our predictions, however, we saw significant suppression in the mitochondrial respiration rates for both fuels at 37°C, whereas the respiration rates at 10°C showed the opposite trend (Fig. 3). A very recent study found no significant differences in BAT mitochondrial respiration rates between torpor and IBE, regardless of assay temperature, although some other seasonal differences were reported (3). However, we feel that methodological differences between this study and our own preclude direct comparisons. The study by Ballinger et al. (3) used succinate as a primary substrate with the addition of ADP but not GDP. In rat BAT mitochondria, such incubation conditions result in respirations rates that reach only ~25% of maximal rates (13a). Moreover, without additions of GDP, it is not possible to determine what proportion of these rates can be attributed to coupled (i.e., complex V-mediated) versus uncoupled (i.e., UCP1-mediated) respiration. We measured UCP1-mediated respiration using relevant oxidative substrates (e.g., fatty acids; Ref. 24) allowing us to better assess potential differences in uncoupled thermogenesis in BAT mitochondria between hibernation states.
Differential temperature effects on the uncoupled mitochondrial respiration rates suggest that some level of functional regulation differs between IBE and torpor. For IBE animals, Q10 values of mitochondrial respiration rates were between 2 and 3 (Fig. 5 and Table 2). In contrast, the respiration rates from torpid animals were comparatively insensitive to temperature with Q10 values closer to 1 (Fig. 5 and Table 2). Liver mitochondrial respiration rates from the same species also showed higher temperature sensitivity in IBE relative to torpor (23). However, the Q10 values for liver mitochondrial respiration (state 3 with succinate) of torpid individuals were >2 (5, 23), suggesting that liver mitochondria are more sensitive to temperature in torpor than are BAT mitochondria. The large change in body temperature between torpor and IBE would alter the rates of enzyme-catalyzed reactions but could also alter other enzyme properties, including substrate affinities and subunit associations. These properties are determined by weak bond interactions that are temperature sensitive (28). For membrane-bound enzymes, such temperature effects can be mitigated or amplified by interactions with closely associated membrane components, including phospholipids. For example, changes in membrane composition and fluidity can be essential for regulating enzyme function in tissues that must function at low temperatures (24, 34). Our data suggest that the differential temperature sensitivity of BAT mitochondrial respiration likely involves such changes to the organelle as a whole, rather than effects on ETS enzymes themselves.
In 13-lined ground squirrels, the suppression of liver mitochondria respiration in torpor is associated with decreased maximal activities of ETS complexes I and II (1) even though the amount of these enzymes (as determined by immunoblot) does not change between torpor and IBE (20). This reduction in enzyme activity in torpor may be due to posttranslational modifications of ETS enzymes (Ref. 14; K. E. Mathers and J. F. Staples, unpublished observations). In the current study, however, we found no changes in ETS enzyme activities in BAT mitochondria, so it is unlikely that these enzymes themselves are modified between torpor and IBE. The brown adipocyte respiration results also contradicted the BAT mitochondrial respiration results in that we found no differences between torpor and IBE in terms of oxygen consumption or temperature sensitivity. A similar pattern was observed in liver metabolism studies on golden-mantled ground squirrels (Callospermophilus lateralis), where the metabolic suppression during torpor, known to occur in isolated liver mitochondria, was not observed in isolated hepatocytes (30). As with hepatocytes, the adipocyte isolation process requires long incubations at high (37°C) temperatures, which likely reversed any changes involved in the mechanism of metabolic suppression that were apparent in the isolated mitochondria. These changes would not likely involve direct alteration of ETS enzymes, the activities of which do not change between torpor and IBE. However, such changes could involve enzyme-mediated remodeling of mitochondrial membranes.
In Syrian hamsters (Mesocricetus auratus), remodeling of cardiac sarcoplasmic reticulum membranes does occur between torpor and IBE with significant effects on the activity of membrane-associated enzymes such as sarcoplasmic/endoplasmic reticulum Ca2+-ATPase 2a (SERCA; Ref. 14). Moreover, in ground squirrels, membrane remodeling has been reported in liver mitochondria throughout hibernation stages, and some aspects of phospholipid composition correlated with mitochondrial respiration (2, 12). Such changes in mitochondrial membrane composition have been linked with elevated activity of carnitine palmitoyl transferase 1 (CPT1) and diminished sensitivity to malonyl-CoA, a CPT1 inhibitor (25). In BAT, long-chain fatty acyl-CoAs are the predominate substrate, powering uncoupled thermogenesis via β-oxidation (10) so changes in CPT1 activity could have profound effects on mitochondrial respiration rates via substrate availability limitations, especially because CPT1 and CPT2 are highly expressed during the hibernation season (3). Remodeling of membrane phospholipids can involve changes in acyl chains catalyzed by phospholipase A and transacylase enzymes, some of which are localized to the mitochondria. Differential regulation of these enzymes could account for the suppressed respiratory capacity of BAT mitochondria in torpor.
If BAT mitochondrial membranes are remodeled between IBE and torpor, the effects would likely be reflected in our measurement from intact organelles. The homogenization and centrifugation at low temperatures (4°C or lower) would inhibit the activity of membrane remodeling enzymes and rapidly separate mitochondria from any cytosolic signals that might activate them. We feel, therefore, that isolated mitochondria accurately represent the “native” metabolic state of BAT. Such membrane effects, however, would likely not be reflected in our spectrophotometric enzyme assays, as the mitochondria were lysed and homogenized, removing the enzymes from membranes. Moreover, any suppression of mitochondrial metabolism in torpor may have been reversed during isolation of intact BAT adipocytes. The adipocyte isolation procedure requires long incubations at 37°C, potentially allowing membrane remodeling enzymes to reverse any changes initiated during torpor.
Perspectives and Significance
Several studies have demonstrated suppression of mitochondrial respiration between hibernation states. To our knowledge, our findings are the first to demonstrate this pattern in mitochondria isolated from the BAT of animals in torpor versus IBE. Especially during entrance into a torpor bout, such reversible suppression of uncoupled BAT metabolism could augment whole animal energy savings beyond the effects of decreasing Tset. Beyond implications for hibernation energetics, our results also suggest that, within a single species, mechanisms of mitochondrial metabolic suppression may differ among tissues. In liver mitochondria, changes in respiration rates and temperature sensitivity correspond with changes in ETS complex enzyme activities (20). In BAT, however, reversible suppression of mitochondrial respiration was not accompanied by such ETS changes. Further comparisons of mitochondria from these tissues may help to elucidate the different molecular mechanisms underlying these patterns.
GRANTS
This research was supported in part by a Discovery Grant from the Natural Sciences and Engineering Research Council of Canada (J. F. Staples) and the Queen Elizabeth II Graduate Scholarship in Science and Technology (S. V. McFarlane and K. E. Mathers).
DISCLOSURES
The authors declare no competing or financial interests.
AUTHOR CONTRIBUTIONS
S.V.M. performed the experiments, analyzed the data, and wrote the majority of the manuscript. K.E.M. designed and assisted with the spectrophotometric experiments. J.F.S. helped design the experiments and assisted with manuscript preparation. All authors read and approved the final manuscript.
ACKNOWLEDGMENTS
We thank Drs. Chris Guglielmo and Allison McDonald for the use of their spectrophotometer and Oxygraph, without which this research would not have been possible. We also thank Alvin Iverson and the staff of the University of Manitoba Ian N. Morrison Research Farm for assistance with obtaining ground squirrels and Amanda MacCannell and Natalie Po for help with animal care.
REFERENCES
- 1.Armstrong C, Staples JF. The role of succinate dehydrogenase and oxaloacetate in metabolic suppression during hibernation and arousal. J Comp Physiol B 180: 775–783, 2010. doi: 10.1007/s00360-010-0444-3. [DOI] [PubMed] [Google Scholar]
- 2.Armstrong C, Thomas RH, Price ER, Guglielmo CG, Staples JF. Remodeling mitochondrial membranes during arousal from hibernation. Physiol Biochem Zool 84: 438–449, 2011. doi: 10.1086/660892. [DOI] [PubMed] [Google Scholar]
- 3.Ballinger MA, Hess C, Napolitano MW, Bjork JA, Andrews MT. Seasonal changes in brown adipose tissue mitochondria in a mammalian hibernator: from gene expression to function. Am J Physiol Regul Integr Comp Physiol 311: R325–R336, 2016. doi: 10.1152/ajpregu.00463.2015. [DOI] [PubMed] [Google Scholar]
- 4.Barger JL, Brand MD, Barnes BM, Boyer BB. Tissue-specific depression of mitochondrial proton leak and substrate oxidation in hibernating arctic ground squirrels. Am J Physiol Regul Integr Comp Physiol 284: R1306–R1313, 2003. doi: 10.1152/ajpregu.00579.2002. [DOI] [PubMed] [Google Scholar]
- 5.Brown JC, Chung DJ, Belgrave KR, Staples JF. Mitochondrial metabolic suppression and reactive oxygen species production in liver and skeletal muscle of hibernating thirteen-lined ground squirrels. Am J Physiol Regul Integr Comp Physiol 302: R15–R28, 2012. doi: 10.1152/ajpregu.00230.2011. [DOI] [PubMed] [Google Scholar]
- 6.Brown JC, Chung DJ, Cooper AN, Staples JF. Regulation of succinate-fuelled mitochondrial respiration in liver and skeletal muscle of hibernating thirteen-lined ground squirrels. J Exp Biol 216: 1736–1743, 2013. doi: 10.1242/jeb.078519. [DOI] [PubMed] [Google Scholar]
- 7.Brown JC, Staples JF. Substrate-specific changes in mitochondrial respiration in skeletal and cardiac muscle of hibernating thirteen-lined ground squirrels. J Comp Physiol B 184: 401–414, 2014. doi: 10.1007/s00360-013-0799-3. [DOI] [PubMed] [Google Scholar]
- 8.Brustovetsky NN, Mayevsky EI, Grishina EV, Gogvadze VG, Amerkhanov ZG. Regulation of the rate of respiration and oxidative phosphorylation in liver mitochondria from hibernating ground squirrels, Citellus undulatus. Comp Biochem Physiol B 94: 537–541, 1989. [DOI] [PubMed] [Google Scholar]
- 10.Cannon B, Nedergaard J. Brown adipose tissue: function and physiological significance. Physiol Rev 84: 277–359, 2004. doi: 10.1152/physrev.00015.2003. [DOI] [PubMed] [Google Scholar]
- 11.Cannon B, Nedergaard J. Studies of thermogenesis and mitochondrial function in adipose tissues. Methods Mol Biol 456: 109–121, 2008. doi: 10.1007/978-1-59745-245-8_8. [DOI] [PubMed] [Google Scholar]
- 11a.Cannon B, Vogel G. The mitochondrial ATPase of brown adipose tissue. Purification and comparison with the mitochondrial ATPase from beef heart. FEBS Lett 76: 284–289, 1977. doi: 10.1016/0014-5793(77)80169-5. [DOI] [PubMed] [Google Scholar]
- 12.Chung D, Lloyd GP, Thomas RH, Guglielmo CG, Staples JF. Mitochondrial respiration and succinate dehydrogenase are suppressed early during entrance into a hibernation bout, but membrane remodeling is only transient. J Comp Physiol B 181: 699–711, 2011. doi: 10.1007/s00360-010-0547-x. [DOI] [PubMed] [Google Scholar]
- 13.Chung DJ, Szyszka B, Brown JC, Hüner NP, Staples JF. Changes in the mitochondrial phosphoproteome during mammalian hibernation. Physiol Genomics 45: 389–399, 2013. doi: 10.1152/physiolgenomics.00171.2012. [DOI] [PubMed] [Google Scholar]
- 13a.De Meis L, Ketzer LA, Camacho-Pereira J, Galina A. Brown adipose tissue mitochondria: modulation by GDP and fatty acids depends on the respiratory substrates. Biosci Rep 32: 53–59, 2012. doi: 10.1042/BSR20100144. [DOI] [PMC free article] [PubMed] [Google Scholar]
- 14.Giroud S, Frare C, Strijkstra A, Boerema A, Arnold W, Ruf T. Membrane phospholipid fatty acid composition regulates cardiac SERCA activity in a hibernator, the Syrian hamster (Mesocricetus auratus). PLoS One 8: e63111, 2013. doi: 10.1371/journal.pone.0063111. [DOI] [PMC free article] [PubMed] [Google Scholar]
- 15.Hampton M, Melvin RG, Andrews MT. Transcriptomic analysis of brown adipose tissue across the physiological extremes of natural hibernation. PLoS One 8: e85157, 2013. doi: 10.1371/journal.pone.0085157. [DOI] [PMC free article] [PubMed] [Google Scholar]
- 16.Heller HC, Hammel HT. CNS control of body temperature during hibernation. Comp Biochem Physiol A 41: 349–359, 1972. doi: 10.1016/0300-9629(72)90066-7. [DOI] [PubMed] [Google Scholar]
- 17.Hindle AG, Martin SL. Intrinsic circannual regulation of brown adipose tissue form and function in tune with hibernation. Am J Physiol Endocrinol Metab 306: E284–E299, 2014. doi: 10.1152/ajpendo.00431.2013. [DOI] [PMC free article] [PubMed] [Google Scholar]
- 18.Kirby DM, Thorburn DR, Turnbull DM, Taylor RW. Biochemical assays of respiratory chain complex activity. Methods Cell Biol 80: 93–119, 2007. doi: 10.1016/S0091-679X(06)80004-X. [DOI] [PubMed] [Google Scholar]
- 19.Malhotra A, Xu Y, Ren M, Schlame M. Formation of molecular species of mitochondrial cardiolipin. 1. A novel transacylation mechanism to shuttle fatty acids between sn-1 and sn-2 positions of multiple phospholipid species. Biochim Biophys Acta 1791: 314–320, 2009. doi: 10.1016/j.bbalip.2009.01.004. [DOI] [PMC free article] [PubMed] [Google Scholar]
- 20.Mathers KE, McFarlane SV, Zhao L, Staples JF. Regulation of mitochondrial metabolism during hibernation by reversible suppression of electron transport system enzymes. J Comp Physiol B 187: 227–234, 2017. doi: 10.1007/s00360-016-1022-0. [DOI] [PubMed] [Google Scholar]
- 22.Milner RE, Wang LC, Trayhurn P. Brown fat thermogenesis during hibernation and arousal in Richardson’s ground squirrel. Am J Physiol Regul Integr Comp Physiol 256: R42–R48, 1989. [DOI] [PubMed] [Google Scholar]
- 23.Muleme HM, Walpole AC, Staples JF. Mitochondrial metabolism in hibernation: metabolic suppression, temperature effects, and substrate preferences. Physiol Biochem Zool 79: 474–483, 2006. doi: 10.1086/501053. [DOI] [PubMed] [Google Scholar]
- 24.Pehowich DJ, Macdonald PM, McElhaney RN, Cossins AR, Wang LC. Calorimetric and spectroscopic studies of lipid thermotropic phase behavior in liver inner mitochondrial membranes from a mammalian hibernator. Biochemistry 27: 4632–4638, 1988. doi: 10.1021/bi00413a008. [DOI] [PubMed] [Google Scholar]
- 25.Power GW, Yaqoob P, Harvey DJ, Newsholme EA, Calder PC. The effect of dietary lipid manipulation on hepatic mitochondrial phospholipid fatty acid composition and carnitine palmitoyltransferase I activity. Biochem Mol Biol Int 34: 671–684, 1994. [PubMed] [Google Scholar]
- 26.Shabalina IG, Vrbacký M, Pecinová A, Kalinovich AV, Drahota Z, Houštěk J, Mráček T, Cannon B, Nedergaard J. ROS production in brown adipose tissue mitochondria: the question of UCP1-dependence. Biochim Biophys Acta 1837: 2017–2030, 2014. doi: 10.1016/j.bbabio.2014.04.005. [DOI] [PubMed] [Google Scholar]
- 27.Snapp BD, Heller HC. Suppression of metabolism during hibernation in ground squirrels (Citellus lateralis). Physiol Zool 54: 297–307, 1981. doi: 10.1086/physzool.54.3.30159944. [DOI] [Google Scholar]
- 28.Somero GN, Hochachka PW. Biochemical adaptation to the environment. Am Zool 11: 159–167, 1971. doi: 10.1093/icb/11.1.159. [DOI] [Google Scholar]
- 29.Staples JF. Metabolic flexibility: hibernation, torpor, and estivation. Compr Physiol 6: 737–771, 2016. doi: 10.1002/cphy.c140064. [DOI] [PubMed] [Google Scholar]
- 30.Staples JF, Hochachka PW. Liver energy metabolism during hibernation in the golden-mantled ground squirrel, Spermophilus lateralis. Can J Zool 75: 1059–1065, 1997. doi: 10.1139/z97-127. [DOI] [Google Scholar]
- 31.Takaki M, Nakahara H, Kawatani Y, Utsumi K, Suga H. No suppression of respiratory function of mitochondrial isolated from the hearts of anesthetized rats with high-dose pentobarbital sodium. Jpn J Physiol 47: 87–92, 1997. doi: 10.2170/jjphysiol.47.87. [DOI] [PubMed] [Google Scholar]
- 32.Tøien Ø, Drew KL, Chao ML, Rice ME. Ascorbate dynamics and oxygen consumption during arousal from hibernation in Arctic ground squirrels. Am J Physiol Regul Integr Comp Physiol 281: R572–R583, 2001. [DOI] [PubMed] [Google Scholar]
- 33.Vaughan DK, Gruber AR, Michalski ML, Seidling J, Schlink S. Capture, care, and captive breeding of 13-lined ground squirrels, Spermophilus tridecemlineatus. Lab Anim (NY) 35: 33–40, 2006. doi: 10.1038/laban0406-33. [DOI] [PubMed] [Google Scholar]
- 34.Willis JS. Membrane transport at low temperatures in hibernators and nonhibernators. In: Living in the Cold: Physiological and Biochemical Adaptations, edited by Heller CH, Musacchia XJ, and Wang LC. New York: Elsevier, 1986, p. 27–34. [Google Scholar]


