

Abstract
The National Institutes of Health (NIH) Magnetic Resonance Imaging (MRI) Study of Normal Brain Development is a landmark study in which structural and metabolic brain development and behavior are followed longitudinally from birth to young adulthood in a population-based sample of healthy children. Cross-sectional findings from the neuropsychological test battery have been previously described (Waber et al., 2007). The present report details 4-year longitudinal neuropsychological outcomes for those children who were aged 6 to 18 years at baseline (N=383), of whom 219 (57.2%) completed all 3 visits. Primary observations were (1) individual children displayed considerable variation in scores across visits on the same measures; (2) income-related differences were more prominent in the longitudinal than in the cross-sectional data; (3) no association between cognitive and behavioral measures and body mass index; and (4) several measures showed practice effects, despite the 2-year interval between visits. These data offer an unparalleled opportunity to observe normative performance and change over time on a set of standard and commonly used neuropsychological measures in a population-based sample of healthy children. They thus provide important background for the use and interpretation of these instruments in both research settings and clinical practice.
Keywords: Psychological tests, Child behavior, Child development, Adolescent development, Neuropsychology, Achievement, educational
The National Institutes of Health (NIH) Magnetic Resonance Imaging (MRI) Study of Normal Brain Development was undertaken to compile a database for describing the normative developmental trajectories of the human brain and correlating developmental and individual variation, particularly in brain structures, with behavior and cognition (Evans, 2006). This landmark study documents structural brain development and behavior in an accelerated longitudinal design spanning birth to young adulthood in a population based sample of healthy children. The sample was recruited to be demographically representative of the United States population based on the 2000 Census. The database includes anatomic MRI, magnetic resonance spectroscopy (MRS), and diffusion tensor imaging (DTI), with coordinated neuropsychological, neurological and behavioral data.
We previously documented the recruitment strategy along with performance on the neuropsychological battery at the first (cross-sectional) visit among participants in the Objective 1 component of the project, who were between the ages of 6 and 18 (Waber et al., 2007). In the present report, we extend these findings to the longitudinal data, comprising three time points spaced at two-year intervals. These data provide a rare opportunity to examine developmental stability or change associated with well-standardized and widely used neuropsychological measures in a large population-based sample of healthy children.
In addition to the longitudinal design and representativeness, several features of this database render it particularly valuable for appreciating normative performance on these measures. First, because of the strict quality control procedures, reliability of test administration and scoring was carefully monitored across visits and sites. Moreover, the sample was carefully screened for factors that could impact brain development and/or function, and thus test performance (Evans et al., 2006; Waber et al., 2007).
The study included a comprehensive battery of widely used neuropsychological instruments. The prior report (Waber et al., 2007), based on data from the baseline visit, documented clear effects of family income for IQ and achievement. Effects of sex favoring males were detected for visuospatial skills; females excelled at processing speed, manual dexterity and verbal learning. The general level of performance on the battery was higher than population norms, most likely because of the strict inclusion and exclusion criteria, which would have had their greatest impact on the low-income group, who were excluded at the highest rate (Waber et al., 2007).
The Brain Development Cooperative Group recently reported cross-sectional baseline findings on brain volumes (Brain Development Cooperative Group, 2011). There was an intriguing association between brain volumes and body mass index (BMI): BMI was associated positively with white matter and negatively with grey matter volumes. The anatomical findings suggested that it would be important to explore a potential association between BMI and neuropsychological functioning.
The present report describes outcomes based on the longitudinal measurement at all time points and addresses three aims:
To describe normative stability or change over time in scores on measures included in the neuropsychological battery.
To evaluate individual differences related to age, sex, income and BMI.
To estimate effects of repeated administration of instruments at 2-year intervals on performance.
Methods
Details of the methods, including study organization, recruitment, design and measures, have been previously described (Waber et al., 2007) and are presented here in summary form. This study is based on Release 4 of the database (public release).
Study Organization
Data were collected at six Pediatric Study Centers (PSCs) across the U.S.: Children’s Hospital, Boston; Children’s Hospital Medical Center of Cincinnati; Children’s Hospital of Philadelphia; University of California at Los Angeles; University of Texas, Houston; and Washington University, St. Louis.
Design
Participants were evaluated at baseline (N=383, age range 6 to 18) and followed at two-year intervals thereafter, spanning a total of four years, ultimately providing longitudinal data through age 22. Follow-up data were captured within a 20 to 28 month window of the initial visit. Sampling density was higher at younger ages, during which rapid developmental changes were expected, and lower at ages thought to be more stable.
Participants
The study sample was initially recruited between February 2001 and October 2003. The sampling plan was based on available U.S. Census data to define low (< $35,000 per year), medium ($35,000 to $75, 000 per year), and high income (over $75,000 per year) categories. This distribution was further subdivided based on the national distribution of families within race/ethnicity categories within each income level. The targets within these race/ethnicity–by-income categories were then distributed across age and sex categories based on the target age distribution, with males and females represented equally across age. Although the sample was recruited to match the distribution in the target cells, low-income white children were under-represented, presumably because study sites were in urban centers (Waber et al., 2007).
Consenting families with a child meeting all criteria for a target cell were screened for exclusionary criteria: pregnancy, birth and perinatal history, physical/medical or growth impairment; significant behavioral or psychiatric disorder; and family history of significant neurologic or psychiatric disorder in first order relative (Evans, 2006; Waber, 2007). Those eligible were invited to the PSC for clinical assessment, which included neurological evaluation, neuropsychological testing and structural MRI imaging, typically carried out in one day.
Informed consent, and assent as age appropriate, were obtained in compliance with standards for human research for all participating institutions and in accordance with the Helsinki Declaration.
Measures
The neuropsychological battery was comprised primarily of commonly used measures, most with standardized age norms, to assess general intelligence, processing speed, verbal and spatial short term and working memory, verbal learning, verbal fluency, and fine motor dexterity (Table 1). Parent questionnaires assessed psychosocial adjustment and executive functioning in everyday situations. Detailed descriptions of the tests and modifications for this study were previously reported (Waber et al., 2007).
Table 1.
Functional Domains and Measures in NIH Study of Normal Brain Development Neuropsychological Battery.
| Functional Domain | Measure |
|---|---|
| Intelligence | Wechsler Abbreviated Scale of IntellXigence (WASI) (Wechsler, 1999) |
| Processing Speed | Wechsler Intelligence Scale for Children – Third Edition (WISC-III) Coding (Wechsler, 1991) |
| Verbal Short-Term and Working Memory | Wechsler Intelligence Scale for Children – Third Edition (WISC-III) Digit Span (Wechsler, 1991) |
| Verbal Learning | California Verbal Learning Test for Children (CVLT-C) (Delis et al., 1994) |
| Verbal Fluencya | NEPSY Verbal Fluency (Korkman, Kirk & Kemp, 1997) |
| Spatial Short-Term and Working Memory | Cambridge Neuropsychological Test Battery (CANTAB) Spatial Span and Spatial Working Memory (CeNeS, 1998) |
| Set Shifting | Cambridge Neuropsychological Test Battery (CANTAB) Intradimensional/Extradimensional Shift (CeNeS, 1998) |
| Fine Motor Dexterity | Purdue Pegboard (Gardner & Broman, 1979; Tiffin & Asher, 1948) |
| Academic Skills | Woodcock-Johnson III (WJ-III) Letter-Word Identification, Passage Comprehension, Calculation (Woodcock et al., 2001) |
| Executive Function (Everyday) | Behavior Rating Inventory of Executive Functions (BRIEF) – Parent Version (Gioia et al., 2000) |
| Psychosocial Adjustment | Child Behavior Checklist (Achenbach, 2001) |
Administered at all ages but norms available only for ages 7 to 12.
BMI was computed according to the standard formula (weight in kilograms/height in centimeters2) and also converted to percentile scores for age and sex according to Center for Disease Control norms.
Procedures
The testing took approximately three hours and typically occurred on the same day as the MRI scan, prior to the scan. Quality confirmation procedures implemented by the Clinical Coordinating Center (CCC) required that each instrument be scored accurately and administered verbatim according to the instrument’s manual so that administration and scoring would be consistent across testers, sites and visits. After pilot videos established that the examiner was consistently “passing”, examiners began testing study participants. Recordings were reviewed on a frame-by-frame basis. The initial test batteries were videotaped and examiners were certified once five protocols met quality control criteria. Errors required the examiner to record a correct administration of the measure on which the error occurred. Certified testers then submitted video recordings of every 6th participant to guard against drift. Detailed QC procedures at the CCC and Data Coordinating Center (DCC) assured accurate scoring.
Analyses were carried out to evaluate the effectiveness of these procedures using the WASI Full Scale IQ scores. Scores of demographically matched participants whose test administration did (6th administration, N=75) or did not (1st to 5th administration, N=75 per group) undergo QC did not differ (p>0.20). Moreover, the rate of non-passing test administrations was equivalent for tests administered during the first and second halves of the study, before or after the middle of Visit 2 (2.2% vs. 1.7% non-passing, p>0.70 by chi-squared test).
Statistical Methods
T-tests and chi-squared tests were used to compare demographics of the subjects completing all three visits with those completing fewer visits.
Longitudinal stability or within-individual change over time was evaluated by inter-visit correlations as well as individual-level change scores (i.e., differences between the individual’s score for each pair of visits). Distributions of changes in scores across visits were then examined. Only standardized tests and only children who completed all three visits were included in these analyses; missing data were not imputed in order to describe the distributions of change actually observed. Since only participants whose entire 4-year span fell within the age range could be included, sample sizes varied across measures reflecting the age ranges for which the measure was standardized. 95% confidence intervals were derived from the standard error of measurement for each visit to visit comparison.
For longitudinal models evaluating effects of age, sex, income, visit and BMI on neuropsychological outcomes, missing values (mostly due to attrition) were imputed using the Markov Chain Monte Carlo Method (Shafer, 1997) of multiple imputation implemented in SAS PROC MI (SAS version 9.2), which uses data available at any time-point to impute missing values. Multiple imputation produces unbiased estimates assuming the data are missing at random (Donders, van der Heijden, Stignen & Moons, 2006) and is the preferred method in longitudinal developmental studies (McCartney, Burchinal, & Bub, 2006). Multiple imputation is preferable to imputation methods that do not account for variability in imputed values (such as last value carried forward or other single imputation methods), and preferable to complete-case analysis that can produce biased results (Fitzmaurice, Laird, & Ware, 2004). Ten imputations were created and results were summarized across the ten datasets according to the algorithm developed by Rubin (1976, 1987), implemented in SAS PROC MIANALYZE. For tests with a limited age range (e.g., WISC Digit Span not valid over 16), scores were not imputed outside the allowable range. Results based on complete case analysis (non-imputed) did not in fact differ meaningfully from those obtained using multiply imputed data. Results based on imputation are presented, however, to provide the best model estimates.
For each outcome, mixed models were used with subject treated as a random effect to account for the correlation of repeated observations from individuals. Models testing the effect of visit included that main effect as the primary predictor. For models testing the effects of age, sex, income, and BMI, these main effects were the primary predictor. Models tested the effect repeated measurement or visit adjusting for age, sex, income (three levels), and BMI. Visit was treated as a categorical variable. For the five participants who missed the second visit but completed the third, the third visit was treated as the second although it occurred at the time of the third visit.
The regression coefficients associated with visit represent the effect of additional visits on the mean outcome. Age was treated as a time-varying covariate. For exploratory analyses examining the potential moderating effects of age and baseline IQ on repeated measurement, separate models were analyzed including interaction terms for baseline age and IQ with Visit. Because of the large sample size and power to detect effects, the criterion for significance was set at p<0.01 (two-tailed) for all analyses.
Results
Participant Retention
Table 2 displays demographic characteristics of the sample at each visit. The Visit 1 sample included 383 participants. Two hundred and nineteen (57.2%) completed all 3 visits, 112 (29.2%) completed Visits 1 and 2; 5 (1.3%) completed Visits 1 and 3; 47 (12.2%) completed Visit 1 only. Those with fewer than 3 visits were older (mean 11.54 vs. 10.26, t(381)=−2.64, p<.01). Anecdotally, adolescents were often more reluctant to return for repeat visits. There were no differences in retention related to sex, income, or parental race/ethnicity.
Table 2.
Demographic Characteristics of Sample at each Visit.
| Visit 1 (N=383) |
Visit 2 (N=331) |
Visit 3 (N=224) |
||
|---|---|---|---|---|
| Age in years (N, %) | 6 | 64 (17%) | 0 | 0 |
| 7 | 41 (11%) | 12 (4%) | 0 | |
| 8 | 36 (9%) | 48 (15%) | 0 | |
| 9 | 36 (9%) | 36 (11%) | 9 (4%) | |
| 10 | 35 (9%) | 34 (10%) | 43 (19%) | |
| 11 | 27 (7%) | 27 (8%) | 23 (10%) | |
| 12 | 24 (6%) | 27 (8%) | 21 (9%) | |
| 13 | 27 (7%) | 25 (8%) | 12 (5%) | |
| 14 | 23 (6%) | 19 (6%) | 22 (10%) | |
| 15 | 24 (6%) | 18 (5%) | 21 (9%) | |
| 16 | 19 (5%) | 29 (9%) | 20 (9%) | |
| 17 | 21 (5%) | 18 (5%) | 13 (6%) | |
| 18 | 6 (2%) | 17 (5%) | 11 (5%) | |
| 19 | 15 (5%) | 8 (4%) | ||
| 20 | 1 (0%) | 10 (4%) | ||
| 21 | 9 (4%) | |||
| 22 | 3 (1%) | |||
| Sex (N, % male) | 185 (48%) | 157 (47%) | 104 (46%) | |
| Handedness (N, % right-handed) | 336 (87%) | 294 (89%) | 197 (88%) | |
| Family income (N, %) | Low | 93 (24%) | 81 (24%) | 52 (23%) |
| Medium | 156 (41%) | 133 (40%) | 96 (43%) | |
| High | 134 (35%) | 117 (35%) | 76 (34%) | |
| Mother’s Racial identity (N, %) | White | 312 (81%) | 271 (82%) | 184 (83%) |
| African-American | 32 (8%) | 27 (8%) | 18 (8%) | |
| Native American | 1 (0%) | 1 (0%) | 0 (0%) | |
| Asian | 6 (2%) | 4 (1%) | 1 (0%) | |
| Mixed | 3 (1%) | 2 (1%) | 1 (0%) | |
| Not provided | 29 (8%) | 26 (8%) | 20 (9%) | |
| Father’s Racial identity (N, %) | White | 300 (78%) | 261 (79%) | 177 (79%) |
| African-American | 33 (9%) | 27 (8%) | 18 (8%) | |
| Native American | 2 (1%) | 4 (1%) | 2 (1%) | |
| Asian | 7 (2%) | 6 (2%) | 3 (1%) | |
| Mixed | 5 (1%) | 5 (2%) | 3 (1%) | |
| Not provided | 34 (9%) | 28 (8%) | 21 (9%) | |
| Ethnicity (N, % Hispanic) | Mother | 29 (8%) | 28 (8%) | 21 (9%) |
| Father | 38 (10%) | 32 (10%) | 22 (10%) |
Aim 1: Longitudinal Stability
Table 3 displays Pearson correlations across visits and corresponding 95% confidence intervals, derived from the observed standard error of measurement. This confidence interval will contain the true mean 95% of the time if the confidence interval is computed with repeated samples. Table 3 also shows the actual distribution of individuals by the number of points (absolute value) that the scores changed for each two-year interval. Since only participants whose entire four-year span fell within the age range of a given test were included, sample sizes vary depending on the age ranges for which the measure is standardized.
Table 3.
Correlations between scores across visits, 95% Confidence Interval for Change between Visits; Mean, Median, and 25th and 75th %iles of Absolute Value of Change in Scores between Visits.
| Comparison | r | 95% Confidence Interval (+/−) | N | Mean | Median | 25%ile | 75%ile | |
|---|---|---|---|---|---|---|---|---|
| WASI Full Scale IQ (Standard Score) | V2-V1 V3-V1 V3-V2 |
.81 .75 .80 |
12.8 14.7 13.1 |
216 216 216 |
6.11 6.86 5.50 |
5.00 5.00 4.00 |
2.00 3.00 2.00 |
9.00 9.50 8.00 |
| WASI VIQ (Standard Score) | V2-V1 V3-V1 V3-V2 |
.73 .68 .77 |
15.3 16.6 14.1 |
216 216 216 |
7.57 8.14 6.26 |
6.00 7.00 5.00 |
3.00 3.00 2.00 |
10.00 11.00 10.00 |
| WASI PIQ (Standard Score) | V2-V1 V3-V1 V3-V2 |
.78 .70 .76 |
13.8 16.1 14.4 |
217 217 217 |
6.81 7.92 6.47 |
6.00 7.00 5.00 |
3.00 3.00 2.00 |
10.00 11.00 10.00 |
| WJIII Calculation (Standard Score) | V2-V1 V3-V1 V3-V2 |
.61 .52 .69 |
18.4 20.4 16.4 |
200 200 200 |
8.02 9.59 7.43 |
6.00 8.00 6.00 |
3.00 4.00 3.00 |
12.00 14.00 12.00 |
| WJIII Letter-Word (Standard Score) | V2-V1 V3-V1 V3-V2 |
.69 .66 .78 |
16.4 17.1 13.8 |
203 203 203 |
6.29 7.09 4.97 |
5.00 5.00 4.00 |
2.00 3.00 2.00 |
9.00 11.00 7.00 |
| WJIII Passage Comprehension (Standard Score) | V2-V1 V3-V1 V3-V2 |
.50 .56 .51 |
20.8 19.5 20.6 |
202 202 202 |
7.76 7.52 7.50 |
7.00 6.00 6.00 |
3.00 2.00 3.00 |
11.00 11.00 10.00 |
| NEPSY Verbal Fluency (Scaled Score) | V2-V1 V3-V1 V3-V2 |
.40 .60 .58 |
4.6 3.7 3.8 |
51 51 51 |
2.43 2.25 1.98 |
2.00 2.00 2.00 |
1.00 1.00 1.00 |
3.00 3.00 3.00 |
| WISC-III Coding (Scaled Score) | V2-V1 V3-V1 V3-V2 |
.50 .52 .66 |
4.2 4.1 3.4 |
155 155 155 |
2.32 2.36 1.97 |
2.00 2.00 2.00 |
1.00 1.00 1.00 |
3.00 3.00 3.00 |
| WISC-III Digit Span (Scaled Score) | V2-V1 V3-V1 V3-V2 |
.48 .55 .62 |
4.2 3.9 3.6 |
162 162 162 |
2.17 2.10 1.95 |
2.00 2.00 1.50 |
1.00 1.00 1.00 |
3.00 3.00 3.00 |
| CVLT-C T1 to T5 (T-Score) | V2-V1 V3-V1 V3-V2 |
.35 .27 .35 |
15.8 16.7 15.8 |
141 141 141 |
8.43 8.85 8.33 |
6.00 7.00 7.00 |
3.00 3.00 4.00 |
12.00 13.00 11.00 |
| BRIEF BRI (T-Score) | V2-V1 V3-V1 V3-V2 |
.57 .44 .56 |
12.9 14.7 13.0 |
175 175 175 |
5.27 5.81 4.94 |
4.00 5.00 4.00 |
2.00 2.00 1.00 |
8.00 8.00 7.00 |
| BRIEF MI (T-Score) | V2-V1 V3-V1 V3-V2 |
.64 .58 .63 |
11.8 12.7 11.9 |
176 176 176 |
5.30 5.81 5.34 |
4.00 5.00 4.00 |
2.00 2.00 2.00 |
7.50 8.00 7.00 |
| BRIEF GEC (T-Score) | V2-V1 V3-V1 V3-V2 |
175 175 175 |
5.07 5.53 5.13 |
4.00 4.00 4.00 |
2.00 2.00 2.00 |
7.00 8.00 6.50 |
||
| CBCL Externalizing (T-Score) | V2-V1 V3-V1 V3-V2 |
.50 .35 .60 |
13.9 15.8 12.4 |
206 206 206 |
6.06 7.01 5.63 |
5.00 6.00 5.00 |
2.00 2.00 2.00 |
8.00 10.00 8.00 |
| CBCL Internalizing (T-Score) | V2-V1 V3-V1 V3-V2 |
.48 .49 .50 |
14.1 14.0 13.9 |
206 206 206 |
6.88 6.72 6.35 |
6.00 6.00 5.00 |
3.00 2.00 1.00 |
10.00 10.00 10.00 |
| CBCL Competence (T-Score) | V2-V1 V3-V1 V3-V2 |
.53 .49 .59 |
13.4 14.0 12.6 |
141 141 141 |
6.81 6.99 6.44 |
5.00 5.00 5.00 |
2.00 3.00 3.00 |
10.00 10.00 10.00 |
| CBCL Attention Problems (T-Score) | V2-V1 V3-V1 V3-V2 |
.36 .41 .53 |
15.7 15.2 13.3 |
206 206 206 |
2.51 2.22 2.12 |
1.00 1.00 1.00 |
0.00 0.00 0.00 |
4.00 3.00 3.00 |
Note: Table includes scores of children who completed measure at all three visits.
Note: The 95% confidence interval is based on the standard error of measurement (SEM = SD*(1−r)1/2), where r is the Pearson correlation of the measurements between two visits. This interval will contain the true mean 95% of the time if the confidence interval were computed with repeated samples.
As expected, scores are highly correlated across Visits, but fall well short of unity. Correlations are highest for the WASI Full Scale IQ (0.75–0.81) and lowest for the CVLT-C (0.27–0.35). Most range from 0.4 to 0.6. The confidence intervals are correspondingly wide. They range from just under one standard deviation (±12.8 standard score points) for the WASI Full Scale IQ to just under 1.5 standard deviations for the CVLT-C (±15.8 t-score points).
Aim 2: Age, Sex, Income and BMI
Table 4 displays standardized parameter estimates (indicative of effect sizes) for the effects of age, sex and income within the regression models. BMI showed no significant effects and was dropped from the models.
Table 4.
Standardized Parameter Estimates and Probability Levels for Effects of Age, Sex, Income and Visit on Standardized Test Scores and Behavioral Scales.
| Age | Sex (Female Baseline) |
Income (Medium Income Baseline) |
Visit (Visit 1 Baseline) |
|||||||
|---|---|---|---|---|---|---|---|---|---|---|
| Year | p | Male | p | Low | High | p | Visit 2 | Visit 3 | p | |
| WASI Full Scale IQ (Standard Score) | −0.11 | ns | 0.07 | ns | −.16*** | .26*** | <.0001 | .09*** | .12** | <.01 |
| WASI Verbal IQ (Standard Score) | −0.13 | p<.01 | −0.03 | ns | −0.09 | 0.20*** | <.0001 | 0.07 | 0.06 | ns |
| WASI Performance IQ (Standard Score) | −0.06 | ns | 0.15 | <.001 | −0.17*** | 0.23*** | <.0001 | 0.09*** | 0.15*** | <.0001 |
| WISC-III Coding (Scaled Score) | 0.03 | ns | −0.24 | <.0001 | −0.10 | 0.16*** | <.0001 | −0.04 | −0.06 | ns |
| WISC-III Digit Span (Scaled Score) | −0.02 | ns | 0.00 | ns | −0.05 | 0.14** | <.01 | 0.02 | 0.02 | ns |
| CVLT-C T1 to T5 (T-Score) | −0.06 | ns | −0.10 | ns | −0.06 | 0.09 | ns | .01 | .07 | ns |
| WJIII Calculation (Standard Score) | −0.14 | p<.01 | 0.02 | ns | −0.15** | 0.23*** | <.0001 | 0.05 | 0.08 | ns |
| WJIII Letter-Word (Standard Score) | −0.25 | <.0001 | −0.01 | ns | −0.06 | 0.10 | ns | −0.00 | −0.01 | ns |
| WJIII Passage Comprehension (Standard Score) | 0.08 | .ns | .05 | ns | −0.09 | 0.17*** | <.0001 | 0.01 | −0.02 | ns |
| NEPSY Verbal Fluency (Scaled Score) | 0.03 | ns | −0.08 | ns | −0.04 | 0.11 | ns | −0.03 | 0.14 | <.01 |
| BRIEF BRI (T-Score) | −0.04 | ns | 0.01 | ns | 0.01 | −0.08 | ns | −0.05 | −0.01 | ns |
| BRIEF MI (T-Score) | 0.04 | ns | −0.03 | ns | 0.02 | −0.11 | .ns | −0.01 | 0.04 | ns |
| BRIEF GEC (T-Score) | −0.00 | ns | −0.01 | ns | 0.02 | −0.12 | .ns | −0.03 | 0.02 | ns |
| CBCL Externalizing Scale (T-Score) | −0.12 | .ns | −0.01 | ns | 0.03 | −0.15*** | <.01 | 0.03 | 0.04 | ns |
| CBCL Internalizing Scale (T-Score) | −0.06 | ns | 0.05 | ns | 0.04 | −0.08 | ns | −0.00 | −0.06 | ns |
| CBCL Total Competence (T-Score) | 0.01 | ns | 0.00 | ns | −0.07 | 0.17*** | <.0001 | −0.03 | −0.06 | ns |
| CBCL Attention Problems (T-Score) | −0.05 | ns | −0.05 | ns | 0.08 | −0.12* | <.001 | 0.06 | 0.08 | ns |
| CANTAB IED Stages | 0.36 | <.0001 | 0.08 | ns | −0.04 | 0.08 | <.01 | 0.16*** | 0.17*** | <.0001 |
| CANTAB Spatial Span (Span) | 0.60 | <.0001 | 0.07 | ns | −0.09* | 0.06 | <.001 | 0.07 | 0.08 | ns |
| CANTAB Spatial Working Memory (Errors) | −0.62 | <.0001 | −0.00 | ns | 0.12*** | −0.08* | <.0001 | −0.04 | −0.01 | ns |
| Pegboard preferred hand (# Pegs) | 0.52 | <.0001 | −0.15 | <.0001 | −0.05 | 0.08 | <.01 | 0.07* | 0.11*** | <.0001 |
| Pegboard non-preferred hand (# Pegs) | 0.53 | <.0001 | −0.09 | <.01 | −0.05 | 0.07 | ns | 0.10* | 0.14*** | <.0001 |
| Pegboard Both (# Pegs) | 0.44 | <.0001 | −0.08 | ns | −0.06 | 0.09* | <.01 | 0.14*** | 0.14*** | <.0001 |
| Verbal Fluency Total (# Words) | 0.66 | <.0001 | −0.05 | ns | −0.02 | 0.08 | ns | 0.02 | 0.05 | ns |
| Verbal Fluency Phonemic (# Words) | 0.64 | <.0001 | −0.04 | ns | −0.05 | 0.06 | ns | 0.05 | 0.08 | ns |
| Verbal Fluency Semantic (# Words) | 0.54 | <.0001 | −0.07 | ns | −0.03 | 0.09 | ns | −0.02 | 0.00 | ns |
p<0.01,
p<0.001,
p<0.0001
Note: Standardized parameter estimates indicate effect size.
Age effects were of course prominent on the unstandardized measures, but also observed for several standardized measures. Scores decreased with increasing age for the WASI Verbal IQ as well as the WJ-III Letter-Word Identification and Calculation.
Sex differences favoring boys were documented for the WASI Performance IQ. Follow-up analyses, not shown in the Table, indicated that boys’ scores averaged 2.8 scaled score points higher on Block Design (p=.001). Girls performed better on the Pegboard and Coding. There were no significant interactions of sex with age, indicating that age did not moderate the sex effects.
Effects of income were documented for many measures. Where such differences did not reach statistical significance, their direction was consistent, with higher income participants achieving better scores (or showing fewer behavioral symptoms). The parameter estimates, which compare the High and Low groups to the Middle group, indicate that the differences between the High and Middle group were generally larger than those between the Low and Middle group. Most effect sizes, however, were in the small range.
Aim 3: Effects of Repeated Administration
Table 4 also provides estimates of the effects of Visit, adjusted for age, sex, and income. Despite the two-year interval between visits, positive effects of repeated testing emerged for some measures. Visit affected WASI Performance IQ; follow-up analysis indicated that Block Design scores improved an estimated 1.79 scaled score points for each visit (p<.0001). There was also a small but statistically significant Visit effect for Full Scale IQ.
Effects of Visit were detected for the CANTAB IED and Pegboard. To assure that the observed effects truly reflected Visit and not age for these unstandardized measures, we plotted score distributions for a single age group by Visit (i.e., raw score for distributions for 10 year olds performing the task at their first, second or third visit). These confirmed that the effects of Visit were not attributable to age. Figure 1, for example, illustrates the Visit effect for the pegboard in the both hands condition among 10-year-olds. They performed better if testing occurred on their second or third visit rather than their first, corroborating the models. Moreover, the increment appeared to be greater for the second than the third visit. Accordingly, correlations between Visits 2 and 3 are generally higher than those between Visits 1 and 2 (Table 3).
Figure 1.
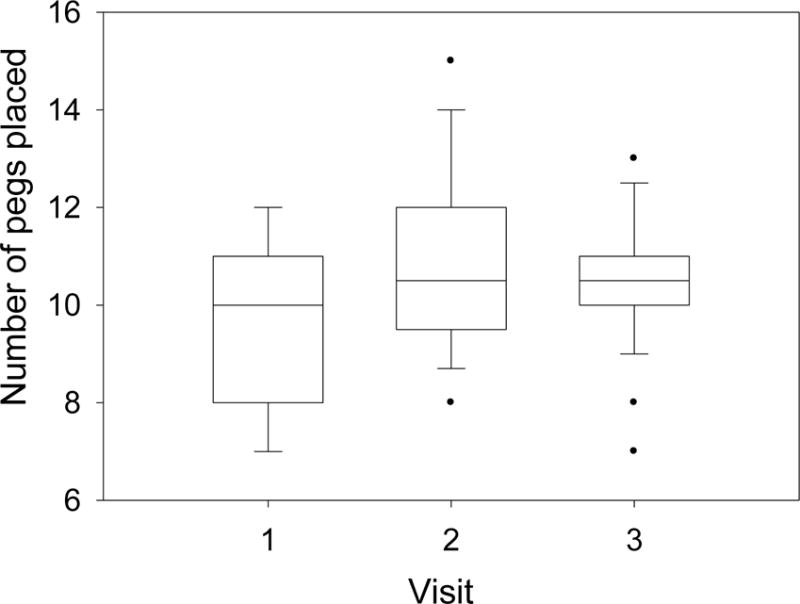
Box-plots showing median, 25th and 75th percentile and range of Pegboard Both Hands scores for children who were 10 years of age on their first, second or third visit. (F(2,106)=7.35, p=.001).
Exploratory analyses were implemented to determine whether the Visit effects were moderated by baseline age or ability level. Baseline IQ interacted with Visit for the WASI (Verbal, Performance, Full Scale IQ) and the WJ-III Passage Comprehension (all p<.001). The pattern of these interactions, illustrated in Figure 2 for WJ-III Passage Comprehension, suggests regression to the mean.
Figure 2.
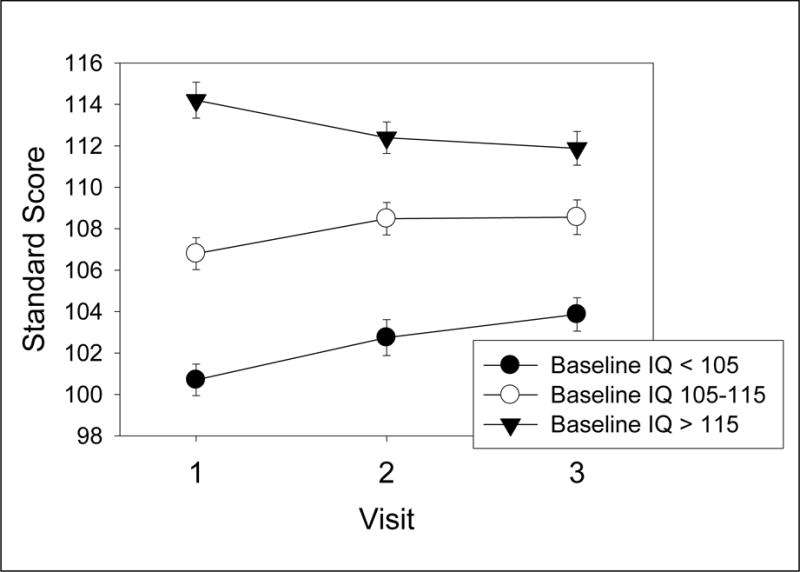
Means and standard errors of standard scores for Woodcock-Johnson III Passage Comprehension subtest for low, medium and high IQ groups (baseline score) at each of the 3 visits illustrating IQ × Visit interaction.
Interactions between Visit and age emerged for WJ-III Calculation (p<0.0001), and semantic (p<0.0001) but not phonemic fluency, Spatial Span, Pegboard (p<0.0001), and CBCL Internalizing and Total Competence (p<0.01). Figure 3 illustrates the interaction, consistent across affected variables, for the CANTAB Spatial Span; the Visit effect was greater for younger children (6–12 years) than for adolescents (13–18 years).
Figure 3.

Means and standard errors of CANTAB Spatial Span scores for groups classified according to baseline age, illustrating Age × Visit interaction.
Discussion
This first report on the longitudinal neuropsychological data from the NIH MRI Study of Normal Brain Development database addressed three issues: normative variability in performance over time, individual differences related to age, sex, income and BMI, and effects of prior testing. To summarize, first, even though these measures were administered under well-controlled conditions, with rigorous QC, individual children displayed considerable variability across visits on the same measures. Second, individual differences emerged clearly. Sex differences were consistent with those previously reported in the psychological literature, differences related to income level emerged for many measures, both cognitive and behavioral, and BMI was unrelated to outcomes. Finally, despite the two-year interval between visits, considerably longer than the one year minimum typically recommended in clinical practice, some measures showed effects of prior testing. The effect sizes for both visit and individual differences, however, are relatively small, achieving statistical significance because of the very high power to detect effects.
Aim 1: Longitudinal Stability
The NIH database provides the rare opportunity to observe normative stability or change across development in measures that are standard in the armamentarium of pediatric neuropsychologists. Although correlations between visits were robust, their magnitude fell far short of unity, meaning that there was considerable fluctuation across visits for individuals. The extent of this fluctuation is perhaps the most significant finding of this study.
Table 3 provides a backdrop for interpreting observed changes in scores over time for individuals, both clinically and in research settings. Thus, for example, for the WASI Full Scale IQ, the median change is five standard score points after two years, meaning that for 50%, scores changed more than five points, and more than nine points for 25%. For the CVLT-C, the median is six t-score points; 50% of children had scores that changed more than six points and 25% more than 12 points, that is, more than one standard deviation for the test.
The fluctuation is noteworthy in light of the well-controlled conditions of this study. Indeed, the standard deviations observed in this sample are actually somewhat smaller than those of the standardization samples (Waber et al., 2007, Table 5). The children themselves were screened for attention and behavioral disorders that could have affected reliability of performance, and administration and scoring procedures were carefully monitored. Although repeated measurement (practice effects) could account to some extent for changes over time, the effect size estimates were small and did not affect most measures. Even in these well controlled conditions, then, a high degree of variation over time, for some children substantial, appears normative, substantiating cautions about assumptions of stability in intelligence testing (Matarazzo & Herman, 1984; McCall, Appelbaum & Hogarty, 1973).
Test-retest reliability coefficients provided by test developers are typically based on brief intervals. For example, the mean test-retest interval for the WASI IQ (Wechsler, 1999) was 31 days, yielding a correlation of 0.93 in the age group that participated in this study. The standard error of measurement reported in the manual (3.03), yields a 95% confidence interval of ± 6 points. We observed a 0.81 test-retest correlation after a two-year interval and 0.75 after a 4-year interval. Thus, the confidence interval more than doubles over two years to ± 12.8 points and widens further at four years. Table 3 clearly illustrates the implications of the observed test-retest reliability over two-year intervals.
The question of stability or change over developmental time in psychological test scores is not novel. In the mid-20th century, child psychologists undertook ambitious longitudinal studies, documenting diverse aspects of development from infancy through adolescence and adulthood (Bayley, 1949; McCall, Appelbaum & Hogarty, 1973). Although IQ scores were relatively stable after about age 6, with correlations between 6 and 18 years of about .80 (Bayley, 1949), there was significant variation in individual trajectories (McCall, Appelbaum & Hogarty, 1973). This variation was related to factors such as child characteristics (e.g., independent, self-initiating, most likely reflecting the contemporary construct of executive function) and parenting practices. The variability documented here is entirely consistent with these classic studies and expands the array of outcomes to many commonly used neuropsychological instruments.
A further possibility — one that this database is uniquely prepared to inform — is that changes are associated with underlying discontinuities in the typical trajectories of human development, which may also be highly variable across individuals. Developmental psychologists have long emphasized that cognitive development does not follow a monotonic linear trajectory, but is characterized by periodic functional reorganization, leading to spurts and plateaus that may be highly individual in their timing if not their process (Elman, 2005; Thelen & Smith, 1998). These discontinuities presumably underlie the superficially linear trajectories observed in group data.
Aim 2: Age, Sex, Income, and BMI
Although associations with sex and income were documented in the cross-sectional data, they were more prominent in these longitudinal data, especially for income. This finding most likely reflected the power conferred by the repeated measures design, since the effect sizes were generally small. With respect to sex, the findings were similar for the cross-sectional and longitudinal analyses and consistent with those previously documented in the psychological literature — a male advantage for visuospatial skills and a female advantage for fine motor skills and processing speed (Bors & Vigneau, 2011; Jensen & Reynolds, 1983; Reite et al., 1993).
The more widespread income-related differences are striking, although the effect sizes are relatively modest. Whereas the cross-sectional data documented income-related differences primarily for IQ and achievement, these longitudinal analyses revealed significant income-related differences for many more measures. For the measures for which these differences failed to reach the designated criterion of statistical significance, the effects were consistent in their direction.
These findings highlight the potential impact of socioeconomic influences on neuropsychological measures. In this database, socioeconomic status is coded by a gross measure of family income, presumably reflecting a nexus of social, experiential, genetic, and epigenetic processes on cognitive and social development. The parameter estimates in Table 4 indicate that children in the high income group differed more prominently from the middle income group than did the low income group. Importantly, the participants were carefully screened for adverse health and behavioral conditions, including in first-degree relatives. Those from lower income backgrounds were excluded at a higher rate, consistent with the higher prevalence of these disorders in less advantaged populations (Mackenbach et al., 2008; Muntaner et al., 1998). Exclusion of low income children with these morbidities may explain to some extent why their performance was more similar to that of the middle income group.
The small but growing literature on relationships between poverty and neuropsychological functioning indicates that socioeconomic factors affect basic neurocognitive functioning from early in life (Mezzacappa, 2004) and at low levels of processing (D’Angiulli et al., 2008; Waber et al., 1984), most salient in language and executive functioning (Noble, McCandliss, & Farah, 2007; Noble, Norman, & Farah, 2005). In the prior report (Waber et al., 2007), we suggested that income levels had their greatest impact on more integrative skills, meaning those that entail orchestrating multiple cognitive operations to achieve a goal. That continues to be the pattern here. For example, the magnitude of the income effect is greater for WJ-III Calculation and Passage Comprehension, which can require more strategic and inferential reasoning, than for Letter-Word Identification, which measures single word reading, a more practiced skill.
Cross-sectional analyses of the structural MRI data did not document associations of income with lobar brain volumes or total gray or white matter (Brain Development Cooperative Group, 2011). Other studies derived from this database, however, have found clear associations between a general intelligence factor (or g) and measures of cortical thickness in association areas that underlie more integrative functions (Ganjavi et al., 2011; Karama et al., 2009; Luders et al., 2011). These findings suggest that a biological substrate for the association between income and cognitive functions may yet be detected. Since cortical thickness can reflect both genetic (Joshi et al., 2011) and experiential (Engvig et al. 2010; Haier et al., 2009) influences, any causal route is likely complex.
Finally, although the volumetric data documented small but reliable and consistent associations between BMI and volumes, no such associations were found in the neuropsychological data. The absence of associations is at variance with published studies suggesting that overweight and obese children display compromise of cognitive functioning (Lee, Dai, Jackson & Zhang, 2008; Parisi et al., 2010). Since 12% of the sample was classified as obese (but without diabetes or other health impairment) and an additional 14% were overweight (Brain Development Cooperative Group, 2011), there was sufficient variability to detect associations. The functional significance of the association with BMI in the structural data is thus unclear.
Aim 3: Effects of Repeated Administration
Effects of repeated administration were few and modest in size. The literature on practice effects on standard psychological test measures is scant, pertaining mostly to IQ tests. Practice effects have been demonstrated on WISC and WAIS subtests, albeit with much briefer test-retest intervals than was the case here, one year at most (Basso et al., 2002; Siders, Kaufman, & Reynolds, 2006; Sirois et al., 2002). The present data, therefore, provide the opportunity to evaluate the effects of repeated administration of standard neuropsychological test instruments over a more extended time frame, which is more typical clinically.
The large sample size allowed us to reliably detect small effects. The effect was substantial for Block Design, however, contributing to an effect for Full Scale IQ. More robust practice effects for Performance IQ have been previously reported (Sirois et al., 2002; Tuma & Appelbaum, 1980). Practice effects also emerged for the CANTAB ID/ED, perhaps reflecting the importance of strategy on this measure of set-shifting, which could more easily transfer across administrations. More surprising, however, were the effects of visit for the pegboard (Figure 1), a motor task that would not superficially be expected to show benefit from a single experience, especially after two years. For perspective, the magnitude of the effect of visit, albeit small, was in the same range as the effect of sex. Since practice effects were detected after such a long interval, they could theoretically be of greater magnitude in shorter intervals of 6 months or even a year.
There were also significant interactions between visit and IQ and age. Baseline IQ interacted with visit for the IQ scales and reading comprehension in a pattern that suggested regression to the mean. The effect of visit was also larger for younger children. Since the interactions primarily involved unstandardized measures, the finding likely reflects an asymptotic relationship of performance to age, with stronger relationships in younger children than adolescents (Waber et al., 2007).
Limitations
The NIH database provides a unique opportunity to describe the performance of a large population-based sample of healthy children on a standard neuropsychological battery, with instruments that are widely used in both research and clinical practice. The database also has limitations. There was considerable sample attrition; however, multiple imputation likely provided an accurate estimate of model effects. Also, the socioeconomic measure, income, was crude and does not allow for analysis of processes contributing to variation. Finally, because of restrictions in the length of the battery, as well as concerns about reliability of administration across sites and visits, measures that are commonly used and could have been of interest were not included.
Implications
In research settings, change over developmental time on neuropsychological testing must be evaluated against a background of the normative range of change, as illustrated by these data, as well as potential effects of repeated testing, which were detectable for several measures, even after two years. The potential impact of socioeconomic and other social circumstances on test performance cannot be overemphasized. Obtained scores may reflect the impact of environmental circumstances on neurobehavioral development and not necessarily neurological impairment or lack thereof. Indeed, the boundaries between nature and nurture, especially in low-income settings, can become quite indistinct (Turkheimer et al., 2003). Even for clinical conditions with known neurobiological implications, adjusting for potential socioeconomic effects is essential to adequately estimate the impact of the condition. Users of this database who are undertaking brain-behavior correlation should also be mindful of the probabilistic and fluid nature of the behavioral measurements.
From a clinical perspective, these findings are especially relevant. As McCall et al. pointed out in 1973, developmental fluctuations are expectable on a statistical basis, even in the context of high test-retest correlations. Our data illustrate that fluctuation in standardized test scores over time, sometimes substantial, can be typical, and observed changes in scores across development should be interpreted accordingly. Test-retest correlations over long intervals, such as the two years reported here, may be more relevant to clinical practice than those obtained over very brief intervals as reported in manuals. Knowing the range of expectable variation provides essential context for interpreting variations in scores over developmental time.
Standardized tests are tools, probabilistic estimates of functioning that cannot and should not be interpreted in isolation or in absolute terms like measures of height. For example, given the observed variability, a child could easily move in or out of “eligibility” range for learning disability on the WJ-III on a normative basis, with material consequences for educational decision-making. Indeed, such fluidity has been observed in other longitudinal studies (Francis et al., 2005). Especially in the clinical setting, an individual score can only be interpreted in light of the broader context, including prior testing, converging evidence from other measures, clinical limit testing, teacher observed school performance, access to instruction, intervening social history, affective presentation, and the challenges of environmental demands, integrated by an overarching theoretical framework (Waber, 2010). The present findings, however, should sound a note of caution with regards to reliance on any of these measures as criterion indicators without consideration of the context and the apparently normative range of typical variation over time. Test scores provide data, not answers.
Conclusion
These data from the NIH MRI Study on Normal Brain Development afford an excellent opportunity to observe normative performance and change over time on a set of standard and frequently used neuropsychological measures in a population-based sample of healthy children. They thus constitute important background for the use and interpretation of these instruments in both research settings and clinical practice. Because this database is freely available for use by qualified researchers, it can serve as an invaluable resource for neuropsychological studies.
Acknowledgments
This research was supported by the Department of Psychiatry, Children’s Hospital Boston. The NIH MRI Study of Normal Brain Development was supported with Federal funds from the National Institute of Child Health and Human Development, the National Institute on Drug Abuse, the National Institute of Mental Health, and the National Institute of Neurological Disorders and Stroke (Contract #s N01-HD02-3343, N01-MH9-0002, and N01-NS-9-2314, -2315, -2316, -2317, -2319 and -2320 and NS347.
Footnotes
BRAIN DEVELOPMENT COOPERATIVE GROUP AUTHORSHIP LIST
The MRI Study of Normal Brain Development is a cooperative study performed by six pediatric study centers in collaboration with a Data Coordinating Center (DCC), a Clinical Coordinating Center (CCC), a Diffusion Tensor Processing Center (DPC), and staff of the National Institute of Child Health and Human Development (NICHD), the National Institute of Mental Health (NIMH), the National Institute on Drug Abuse (NIDA), and the National Institute for Neurological Diseases and Stroke (NINDS), Rockville, Maryland.
Key personnel from the six pediatric study centers are as follows: Children’s Hospital Medical Center of Cincinnati, Principal Investigator William S. Ball, M.D., Investigators Anna Weber Byars, Ph.D., Mark Schapiro, M.D., Wendy Bommer, R.N., April Carr, B.S., April German, B.A., Scott Dunn, R.T.; Children’s Hospital Boston, Principal Investigator Michael J. Rivkin, M.D., Investigators Deborah Waber, Ph.D., Robert Mulkern, Ph.D., Sridhar Vajapeyam, Ph.D., Abigail Chiverton, B.A., Peter Davis, B.S., Julie Koo, B.S., Jacki Marmor, M.A., Christine Mrakotsky, Ph.D., M.A., Richard Robertson, M.D., Gloria McAnulty, Ph.D; University of Texas Health Science Center at Houston, Principal Investigators Michael E. Brandt, Ph.D., Jack M. Fletcher, Ph.D., Larry A. Kramer, M.D., Investigators Grace Yang, M.Ed., Cara McCormack, B.S., Kathleen M. Hebert, M.A., Hilda Volero, M.D.; Washington University in St. Louis, Principal Investigators Kelly Botteron, M.D., Robert C. McKinstry, M.D., Ph.D., Investigators William Warren, Tomoyuki Nishino, M.S., C. Robert Almli, Ph.D., Richard Todd, Ph.D., M.D., John Constantino, M.D.; University of California Los Angeles, Principal Investigator James T. McCracken, M.D., Investigators Jennifer Levitt, M.D., Jeffrey Alger, Ph.D., Joseph O’Neil, Ph.D., Arthur Toga, Ph.D., Robert Asarnow, Ph.D., David Fadale, B.A., Laura Heinichen, B.A., Cedric Ireland B.A.; Children’s Hospital of Philadelphia, Principal Investigators Dah-Jyuu Wang, Ph.D. and Edward Moss, Ph.D., Investigators Robert A. Zimmerman, M.D., and Research Staff Brooke Bintliff, B.S., Ruth Bradford, Janice Newman, M.B.A. The Principal Investigator of the data coordinating center at McGill University is Alan C. Evans, Ph.D., Investigators Rozalia Arnaoutelis, B.S., G. Bruce Pike, Ph.D., D. Louis Collins, Ph.D., Gabriel Leonard, Ph.D., Tomas Paus, M.D., Alex Zijdenbos, Ph.D., and Research Staff Samir Das, B.S., Vladimir Fonov, Ph.D., Luke Fu, B.S., Jonathan Harlap, Ilana Leppert, B.E., Denise Milovan, M.A., Dario Vins, B.C., and at Georgetown University, Thomas Zeffiro, M.D., Ph.D. and John Van Meter, Ph.D. Nicholas Lange, Sc.D., Harvard University/McLean Hospital, is a biostatistical study design and data analysis Investigator to the Data Coordinating Center, assisted by Michael P. Froimowitz, M.S. The Principal Investigator of the Clinical Coordinating Center at Washington University is Kelly Botteron, M.D., Investigators C. Robert Almli Ph.D., Cheryl Rainey, B.S., Stan Henderson M.S., Tomoyuki Nishino, M.S., William Warren, Jennifer L. Edwards M.SW., Diane Dubois R.N., Karla Smith, Tish Singer and Aaron A. Wilber, M.S. The Principal Investigator of the Diffusion Tensor Processing Center at the National Institutes of Health is Carlo Pierpaoli, M.D., Ph.D., Investigators Peter J. Basser, Ph.D., Lin-Ching Chang, Sc.D., Chen Guan Koay, Ph.D. and Lindsay Walker, M.S. The Principal Collaborators at the National Institutes of Health are Lisa Freund, Ph.D. (NICHD), Judith Rumsey, Ph.D. (NIMH), Lauren Baskir, Ph.D. (NIMH), Laurence Stanford, PhD. (NIDA), Karen Sirocco, Ph.D. (NIDA) and from NINDS, Katrina Gwinn-Hardy, M.D., and Giovanna Spinella, M.D. The Principal Investigator of the Spectroscopy Processing Center at the University of California Los Angeles is James T. McCracken, M.D., Investigators Jeffry R. Alger, Ph.D., Jennifer Levitt, M.D., Joseph O’Neill, Ph.D.
DISCLAIMER
The views herein do not necessarily represent the official views of the National Institute of Child Health and Human Development, the National Institute on Drug Abuse, the National Institute of Mental Health, the National Institute of Neurological Disorders and Stroke, the National Institutes of Health, the U.S. Department of Health and Human Services, or any other agency of the United States Government.
DATA ACCESS
Access to the NIH Pediatric MRI Data Repository is freely available to qualified researchers whose institutions are covered by a federal-wise assurance (FWA), who are studying normal brain development, disorders or diseases and/or developing image processing tools, and who agree to the terms of the Data Use Certification. Please see www.NIH-PediatricMRI.org for specific information on how to apply.
References
- Achenbach T. Child Behavior Checklist (CBCL 6–18) Burlington, Vermont: University Associates in Psychiatry; 2001. [Google Scholar]
- Basso MR, Carona FD, Lowery N, Axelrod BN. Practice Effects on the WAIS-III Across 3- and 6-Month Intervals. Clinical Neuropsychologist. 2002;16(1):57. doi: 10.1076/clin.16.1.57.8329. [DOI] [PubMed] [Google Scholar]
- Bayley N. Consistency and variability in the growth of intelligence from birth to eighteen years. Journal of Genetic Psychology. 1949;75:165–196. doi: 10.1080/08856559.1949.10533516. [DOI] [PubMed] [Google Scholar]
- Bors DA, Vigneau F. Sex differences on the mental rotation test: An analysis of item types. Learning and Individual Differences. 2011;21(1):129–132. [Google Scholar]
- Brain Development Cooperative Group. Total and regional brain volumes in a population-based normative sample from 4 to 18 years: The NIH MRI Study of Normal Brain Development. Cerebral Cortex. 2011 doi: 10.1093/cercor/bhr018. [DOI] [PMC free article] [PubMed] [Google Scholar]
- CeNeS. Cambridge Neurospychological Test Automated Battery (Version 2.35) Cambridge, UK: CeNeS Cognition; 1998. [Google Scholar]
- D’Angiulli A, Herdman A, Stapells D, Hertzman C. Children’s event-related potentials of auditory selective attention vary with their socioeconomic status. Neuropsychology. 2008;22(3):293–300. doi: 10.1037/0894-4105.22.3.293. [DOI] [PubMed] [Google Scholar]
- Delis D, Kramer J, Kaplan E, Ober BA. California Verbal Learning Test - Children’s Version. San Antonio, TX: The Psychological Corporation; 1994. [Google Scholar]
- Donders ART, van der Heijden GJMG, Stignen T, Moons KGM. Review: A gentile introduction to imputation of missing values. Journal of Clinical Epidemiology. 2006;59:1087–1091. doi: 10.1016/j.jclinepi.2006.01.014. [DOI] [PubMed] [Google Scholar]
- Elman JL. Connectionist models of cognitive development: where next? Trends In Cognitive Sciences. 2005;9(3):111–117. doi: 10.1016/j.tics.2005.01.005. [DOI] [PubMed] [Google Scholar]
- Engvig A, Fjell AM, Westlye LT, Moberget T, Sundseth O, Larsen VA, Walhovd KB. Effects of memory training on cortical thickness in the elderly. Neuroimage. 2010;52(4):1667–1676. doi: 10.1016/j.neuroimage.2010.05.041. [DOI] [PubMed] [Google Scholar]
- Evans AC. The NIH MRI study of normal brain development. Neuroimage. 2006;30(1):184–202. doi: 10.1016/j.neuroimage.2005.09.068. [DOI] [PubMed] [Google Scholar]
- Fitzmaurice GM, Laird NM, Ware JH. Applied Longitudinal Analysis. Hoboken, NJ: Wiley & Sons; 2004. [Google Scholar]
- Francis DJ, Fletcher JM, Stuebing KK, Lyon GR, Shaywitz BA, Shaywitz SE. Psychometric approaches to the identification of LD: IQ and achievement scores are not sufficient. Journal Of Learning Disabilities. 2005;38(2):98–108. doi: 10.1177/00222194050380020101. [DOI] [PubMed] [Google Scholar]
- Ganjavi H, Lewis JD, Belloc P, MacDonald PA, Waber DP, Evans AC, Karama S, Brain Development Cooperative Group Negative associations between corpus callosum midsagittal area and IQ in a representative sample of healthy children and adolescents. PLoS One. 2011;6(5):e19698. doi: 10.1371/journal.pone.0019698. [DOI] [PMC free article] [PubMed] [Google Scholar]
- Gardner RA, Broman M. The Purdue Pegboard: Normative data on 1334 school children. Journal of Clinical Child Psychology. 1979;8(3):156–162. [Google Scholar]
- Gioia GA, Isquith PK, Guy SC, Kenworthy L. Behavior Rating Inventory of Executive Function. Odessa, FL: Psychological Assessment Resources; 2000. [Google Scholar]
- Haier RJ, Karama S, Leyba L, Jung RE. MRI assessment of cortical thickness and functional activity changes in adolescent girls following three months of practice on a visual-spatial task. BMC Research Notes. 2009;2:174–174. doi: 10.1186/1756-0500-2-174. [DOI] [PMC free article] [PubMed] [Google Scholar]
- Jensen AR, Reynolds CR. Sex differences on the WISC-R. Personality and Individual Differences. 1983;4(2):223–226. [Google Scholar]
- Joshi AA, Leporé N, Joshi SH, Lee AD, Barysheva M, Stein JL, Thompson PM. The contribution of genes to cortical thickness and volume. Neuroreport. 2011;22(3):101–105. doi: 10.1097/WNR.0b013e3283424c84. [DOI] [PMC free article] [PubMed] [Google Scholar]
- Karama S, Ad-Dab’bagh Y, Haier RJ, Deary IJ, Lyttelton OC, Lepage C, Brain Development Cooperative Group Positive association between cognitive ability and cortical thickness in a representative US sample of healthy 6 to 18 year-olds. Intelligence. 2009;37(2):145–155. doi: 10.1016/j.intell.2008.09.006. [DOI] [PMC free article] [PubMed] [Google Scholar]
- Korkman M, Kirk U, Kemp S. NEPSY. New York: Psychological Corporation; 1997. [Google Scholar]
- Li Y, Dai Q, Jackson JC, Zhang J. Overweight Is Associated With Decreased Cognitive Functioning Among School-age Children and Adolescents. Obesity. 2008;16(8):1809–1815. doi: 10.1038/oby.2008.296. [DOI] [PubMed] [Google Scholar]
- Luders E, Thompson P, Narr K, Zamanyan A, Chou YY, Gutman B, Toga AW. The link between callosal thickness and intelligence in healthy children and adolescents. NeuroImage. 2011;54(3):1823–1830. doi: 10.1016/j.neuroimage.2010.09.083. [DOI] [PMC free article] [PubMed] [Google Scholar]
- Mackenbach JP, Stirbu I, Roskam AJ, Schaap MM, Menvielle G, Leinsalu M, Kunst AE. Socioeconomic inequalities in health in 22 European countries. N Engl J Med. 2008;358:2468–2481. doi: 10.1056/NEJMsa0707519. [DOI] [PubMed] [Google Scholar]
- Matarazzo JD, Herman DO. Base rate data for the WAIS-R: test-retest stability and VIQ-PIQ differences. Journal Of Clinical Neuropsychology. 1984;6(4):351–366. doi: 10.1080/01688638408401227. [DOI] [PubMed] [Google Scholar]
- McCall RB, Appelbaum MI, Hogarty PS. Developmental Changes in Mental Performance. Monographs of the Society for Research in Child Development. 1973;38(3):1–84. Serial No., 150. [PubMed] [Google Scholar]
- McCartney K, Burchinal MR, Bub KL. Best Practices in Quantitative Methods for Developmentalists. Monographs of the Society for Research in Child Development. 2006;38(3):1–84. doi: 10.1111/j.1540-5834.2006.07103001.x. Serial No., 150. [DOI] [PubMed] [Google Scholar]
- Mezzacappa E. Alerting, orienting, and executive attention: developmental properties and sociodemographic correlates in an epidemiological sample of young, urban children. Child Development. 2004;75(5):1373–1386. doi: 10.1111/j.1467-8624.2004.00746.x. [DOI] [PubMed] [Google Scholar]
- Milner B. Interhemispheric differences in the localization of psychological processes in man. British Medical Bulletin. 1971;27(3):272–277. doi: 10.1093/oxfordjournals.bmb.a070866. (Print) [DOI] [PubMed] [Google Scholar]
- Muntaner C, Eaton WW, Diala C, Kessler RC, Sorlie PD. Social class, assets, organizational control and the prevalence of common groups of psychiatric disorders. Social Science & Medicine (1982) 1998;47(12):2043–2053. doi: 10.1016/s0277-9536(98)00309-8. [DOI] [PubMed] [Google Scholar]
- Noble KG, McCandliss BD, Farah MJ. Socioeconomic gradients predict individual differences in neurocognitive abilities. Developmental Science. 2007;10(4):464–480. doi: 10.1111/j.1467-7687.2007.00600.x. [DOI] [PubMed] [Google Scholar]
- Noble KG, Norman MF, Farah MJ. Neurocognitive correlates of socioeconomic status in kindergarten children. Developmental Science. 2005;8(1):74–87. doi: 10.1111/j.1467-7687.2005.00394.x. [DOI] [PubMed] [Google Scholar]
- Parisi P, Verrotti A, Paolino MC, Urbano A, Bernabucci M, Villa MP. Cognitive profile, parental education and BMI in children: reflections on common neuroendrocrinobiological roots. Journal of Pediatric Endocrinology and Metabolism. 2010;23:1133–1141. doi: 10.1515/jpem.2010.178. [DOI] [PubMed] [Google Scholar]
- Reite M, Cullum CM, Stocker J, Teale P, Kozora E. Neuropsychological test performance and MEG-based brain lateralization: sex differences. Brain Research Bulletin. 1993;32(3):325–328. doi: 10.1016/0361-9230(93)90195-h. [DOI] [PubMed] [Google Scholar]
- Rubin D. Inference and Missing Data. Biometrika. 1976;63(3):581–592. [Google Scholar]
- Rubin D. Multiple Imputation for Nonresponse in Surveys. New York, New York: John Wiley & Co.; 1987. [Google Scholar]
- Shafer J. Analysis of Incomplete Multivariate Data. New York: Chapman & Hall; 1997. [Google Scholar]
- Shaffer D, Fischer P, Lucas C, Comer J. Diagnostic Inerview for Children (DISC-V) New York: Columbia University; 2003. [Google Scholar]
- Siders A, Kaufman AS, Reynolds CR. Do Practice Effects on Wechsler’s Performance Subtests Relate to Children’s General Ability, Memory, Learning Ability, or Attention? Applied Neuropsychology. 2006;13(4):242–250. doi: 10.1207/s15324826an1304_5. [DOI] [PubMed] [Google Scholar]
- Sirois PA, Posner M, Stehbens JA, Loveland KA, Nichols S, Donfield S, Hemophilia Growth and Development Study Quantifying practice effects in longitudinal research with the WISC-R and WAIS-R: A study of children and adolescents with hemophilia and male siblings without hemophilia. Journal of Pediatric Psychology. 2002;27(2):121–131. doi: 10.1093/jpepsy/27.2.121. [DOI] [PubMed] [Google Scholar]
- Thelen E, Smith LB. Dynamic Systems Theories. In: Damon W, Lerner RM, editors. Handbook of Child Psychology (5th Edition) Volume 1: Theoretical Models of Human Development. New York: John Wiley & Sons; [Google Scholar]
- Tiffin J, Asher EJ. The Purdue Pegboard: norms and studies of reliability and validity. Journal of Applied Psychology. 1948;32:234–247. doi: 10.1037/h0061266. [DOI] [PubMed] [Google Scholar]
- Tuma JM, Appelbaum AS. Reliability and practice effects of WISC-R IQ estimates in a normal population. Educational and Psychological Measurement. 1980;40:671–678. [Google Scholar]
- Turkheimer E, Haley A, Waldron M, D’Onofrio B, Gottesman II. Socioeconomic status modifies heritability of IQ in young children. Psychological Science. 2003;14(6):623–628. doi: 10.1046/j.0956-7976.2003.psci_1475.x. [DOI] [PubMed] [Google Scholar]
- Waber DP. Rethinking Learning Disabilities: Understanding Children Who Struggle in School. New York: Guilford; 2010. [Google Scholar]
- Waber DP, Carlson D, Mann M, Merola J, Moylan P. SES-related aspects of neuropsychological performance. Child Development. 1984;55(5):1878–1886. [PubMed] [Google Scholar]
- Waber DP, de Moor C, Forbes PW, Almli CR, Botteron KN, Brain Development Cooperative Group The NIH MRI study of normal brain development: Performance of a population based sample of healthy children aged 6 to 18 years on a neuropsychological battery. Journal of the International Neuropsychological Society. 2007;13(5):729–746. doi: 10.1017/S1355617707070841. [DOI] [PubMed] [Google Scholar]
- Wechsler D. Wechsler Intelligence Scale for Children Third Edition. New York: Psychological Corporation; 1991. [Google Scholar]
- Wechsler D. Wechsler Abbreviated Scale of Intelligence. New York: Psychological Corporation; 1999. [Google Scholar]
- Woodcock RW, McGrew KS, Mather N. Woodcock-Johnson III. Itasca, IL: Riverside Publishing; 2001. [Google Scholar]