

Abstract
Introduction:
In recent years the quality of life of patients is very important in monitoring the treatment and therapeutic procedure success. It has become a significant factor in assessing the therapeutic procedure accomplishment, and for the first time the patient alone can access the success of the respective therapy. Cancer of the oral cavity is one of the most common cancers of the head and neck, and is one of the ten most common causes of death in the world. In the majority of cases, cancer of the oral cavity is detected in an advanced stage when therapeutic options are reduced, and the prognosis is much worse. Cancer of the oral cavity is 10 times more common in men. Assessment of quality of life should be an indicator of the multidisciplinary treatment success and it should point to areas in which the affected person requires support.
Aim of the study:
To examine the quality of life of patients with oral cavity cancer.
Materials and methods:
The study was conducted at the Clinic of Maxillofacial Surgery of the Clinical Center University of Sarajevo (CCUS), through a survey on patients with verified oral cavity cancer, questionnaire related to socio-demographic characteristics of the patients and the University of Washington Quality of Life Questionnaire (UW-QOL). The results were included in the database and statistically processed in the SPSS program, 19.0 version for Windows. Afterwards, the results were thoroughly analyzed and documented, presented in absolute numbers and statistical values using statistical indicators in simple and understandable tables and figures.
Results:
The study results showed that out of the total score of 100, the median value of quality of life of patients with oral cavity cancer, for the physical health component in the definition of quality was M=69.75 ±29.12 and for social-emotional health M=65.11 ± 27.47.
Conclusion:
This could be considered as satisfactory quality of life, in the sphere above half of the rating scale, although both values significantly deviate from the UW-QOL scale norm. Physical and socio-emotional health components are in a strong positive correlation, R2=0.750, p=0.0001.
Keywords: quality of life, cancer of the oral cavity, University of Washington Quality of Life Questionnaire
1. INTRODUCTION
In recent years the quality of life of patients is very important in monitoring the treatment and therapeutic procedure success. It has become a significant factor in assessing the therapeutic procedure accomplishment and for the first time the patient alone can access the success of the respective therapy (1).
Quality of life is defined as an individual’s perception of their position in life in the context of the culture and value systems in which they live and in relation to their goals, expectations, standards and concerns (2).
Cancer of the oral cavity is one of the most common cancers of the head and neck, and is one of the ten most common causes of death in the world (3, 4). In the majority of cases, cancer of the oral cavity is detected in an advanced stage when therapeutic options are reduced, and the prognosis is much worse (3). Cancer of the oral cavity is 10 times more common in men (5, 6).
Surgical removal of extensive head and neck tumors inevitably results in the loss of vital functions such as swallowing, speech and senses of taste and smell (7).
The consequences may affect the psychological, physical, social and emotional well-being and quality of life of patients (8).
Assessment of quality of life should be an indicator of the multidisciplinary treatment success and it should point to areas in which the affected person requires support.
The aim of the study was to examine the quality of life of patients with oral cavity cancer.
2. MATERIALS AND METHODS
The research was conducted at the Clinic of Maxillofacial Surgery of the UCCS in the period from July to late October 2015. The inclusion criteria implied that all patients had verified oral cavity cancer diagnosis that they were treated at the UCCS, and were over 18 years of age, whereas the exclusion criteria related to all patients under the age of 18 without verified oral cavity cancer. Instruments of the study included: questionnaire related to socio-demographic characteristics of the patients and the University of Washington Quality of Life Questionnaire (UW-QOL). The UW-QOL is used to evaluate the quality of life of patients treated for head and neck cancer. It consists of 12 domains divided into two components: physical function (appearance, swallowing, chewing, speech, taste, saliva) and socio-emotional function (pain, activity, recreation, shoulder, mood, anxiety), which describe the important areas of everyday life influencing the treatment. Each of the stated categories has several possibilities enabling the patient to describe his/her functional status. Scoring is scaled so that a score of 0 represents the worst possible response and a score of 100 represents the best possible response (9). Normative values of Derel Lowe and Simon N Rogers (2012) (10) were used for comparison of the results.
3. RESULTS
During the course of the study one hundred questionnaires were divided. Out of the total number of questionnaires 96 (96%) were returned of which seven were not adequately filled and therefore could not be included in the study. Accordingly, the final overall sample included 89 respondents.
Out of the total of 89 (100%) respondents 55 men (62%) and significantly smaller number of women, specifically 34 (38%), were included in the study.
The age structure of respondents was balanced, p=0.089. Male participants were somewhat older (M=58.50 ± 13.4 years) than female participants (M=52.88 ± 15.1 years), with no statistically significant difference.
Over half of participants, specifically 58 (65%) of them were married and 14 (16%) were single. Out of the total number of participants 12 (13%) were widowers/widows, and 5 (6%) were divorced.
Majority of participants were with high school, specifically 39 (44%) of them, followed by 23 (26%) of participants with elementary education. There was 15 (17%) participants with higher education and 12 (13%) with university degree.
The participants’ quality of life was presented through components of physical and socio-emotional function. The physical health component related to appearance, swallowing, chewing, speech, taste and saliva where a score of 100 related to undisturbed and complete functioning and a score of 0 to complete dysfunction.
Analysis of the physical health components showed that the minimum median value, M=66.29 ± 28.72 and the worst assessed component related to appearance, and the highest median values, M=73.26 ± 34.20, to speech component.
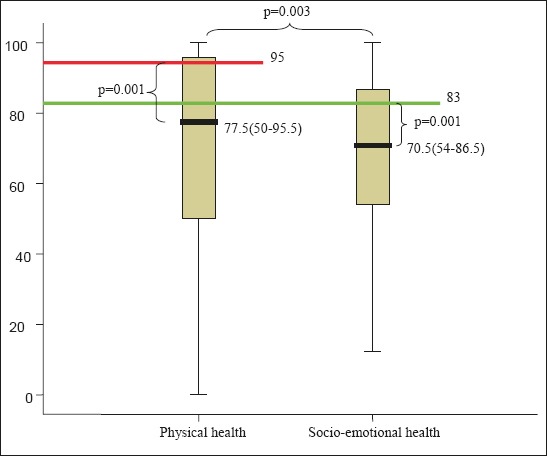
Figure 1 shows physical health component median score (interquartile range).
Figure 1.
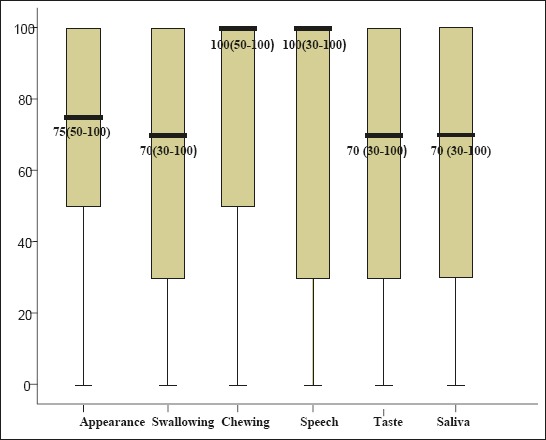
Physical health components median score.
The socio-emotional health component of our participants is shown in Table 2. This component relate to pain assessment, activity of participants, recreation, shoulder function, mood and anxiety, where a score of 100 related to undisturbed and full functioning and a score of 0 to complete dysfunction
Table 2.
Median value of socio-emotional health components.
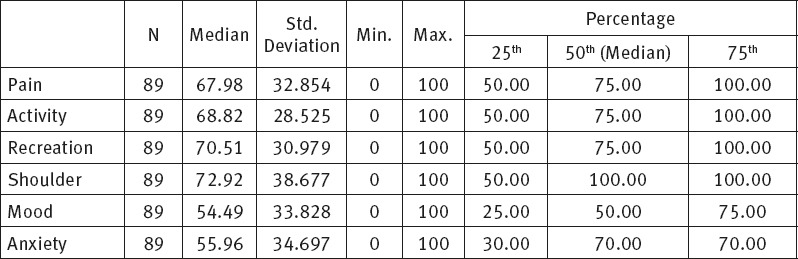
Table 1.
Median value of physical health components.
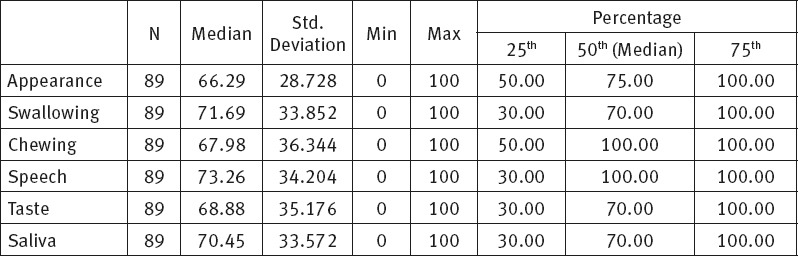
Table 2 shows subjective assessment of socio-emotional health of the participants.
Within the socio-emotional health the mood component has the worst score, M=54.49 ± 33.82. Similar median value is related to anxiety component, M=55.96 ± 34.69. The shoulder component was assessed as the least problem among participants, with median values, M=72.92 ± 38.67. Figure 2 shows socio-emotional health component median score (interquartile range). Analysis of the relation between physical and socio-emotional components, using the Wilcoxon Signed-Rank Test, revealed that there was statistically significant difference in median values between physical and socio-emotional health, p=0.003. The relation between the respective components is shown in Figure 3.
Figure 2.
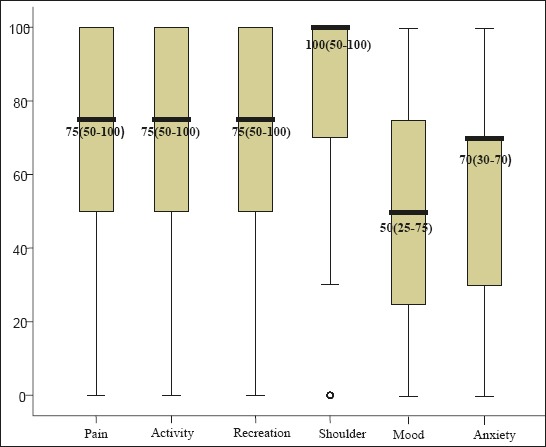
Socio-emotional health components median score.
Figure 3.
Relation between median values of physical and socio-emotional health.
The physical health components median values are higher, Me=77.5 (50-95.5) than socio-emotional health components, with median values Me=70.5 (54-86.5).
Table 3 shows physical and socio-emotional component values, with statistically significantly deviation from the Derek Lowe and Simon N. Rogers standards, p=0.0001, where physical health standard is 95 and socio-emotional health standard is 83 (10).
Table 3.
Comparison of physical and socio-emotional components to standards
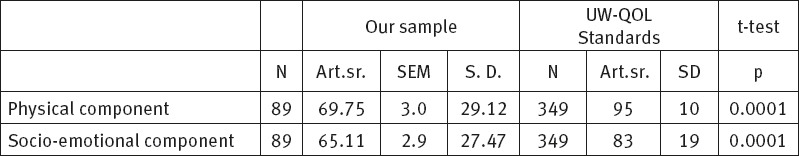
Analysis of physical component of our respondents with respect to the UW-QOL standard values, the t-test showed statistically significant deviations (median values are significantly lower) from the recommended standards, p=0.0001. The respective value in our sample was M=69.75±29.12, whereas this component’s standard is M=95±10.
The same test also confirmed statistically significant deviations between socio-emotional component median values and the recommended standards, p=0.0001. The median value of this quality of life component in our respondents was M=65.11±27.47, whereas this component’s standard is M=83±19.
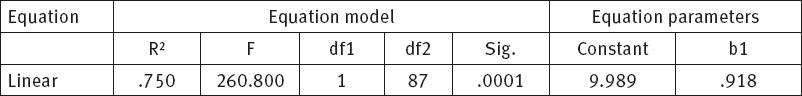
Physical and socio-emotional health components are strongly correlated. This correlation is statistically significant, p<0.001. Increase in socio-emotional component results in the increase of physical health component, R2=0.750, which can be presented in a dispersion diagram and linear regression equation.
Figure 4 shows a dispersion diagram (scatter plot) and mutual correlation between physical and socio-emotional health component. This correlation is very strong, almost linear R2=0.750. Consequently, higher level of socio-emotional component corresponds to a higher level of physical health component.
Figure 4.
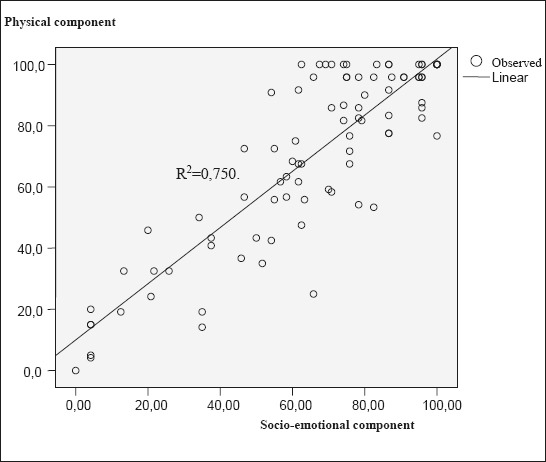
Dispersion diagram of mutual correlation between physical and socio-emotional health component.
Table 5 shows ranking components of physical and socio-emotional health according to their significance for the respondents, and prevalence of significant components in the overall number of respondents.
Table 5.
Significant problems of respondents.
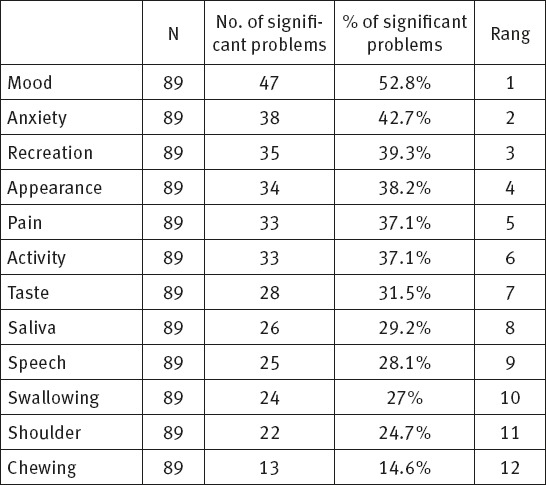
Table 4.
Correlation between physical and socio-emotional health component.
Change in mood takes the first place in the table given that 47 (52.8%) respondents had related problems. It is followed by anxiety since 38 (42.7%) respondents had significant problems related to fear of disease. The third place is reserved for recreation impossibility and relates to 35 (39.3%) respondents. Appearance is on the forth place given that 34 (38.2%) respondents considered it as a problem. Pain is on the fifth place as stated by 33 (37.1%) respondents, followed by reduced physical activity complained of by 33 (37.1%) respondents, taste problems as stated by 28 (31.5%) respondents, uncontrolled salivation complained of by 26 (29.2%) respondents, speech problems recorded in 25 (28.1%) respondents and swallowing problems in 24 (27%) respondents, whereas the least problems related to shoulder function, 22 (24.7%) and chewing problems complained of by 13 (14.6%) respondents.
4. DISCUSSION
The study related to quality of life of patients diagnosed with oral cavity cancer and treated at the Clinic of Maxillofacial Surgery of the CCUS showed that majority of respondents were males (62%), which is in accordance with the existing studies related to oral cavity cancer patients. This is in accordance with the results of Gritz 2:1 (1999), Nagy 66% (2011), Hassan 2:1 (1993), Hassanein 2:1 (2005) and Lam Tang 2:1 (2008), but differs from the results of Lopez 4:1 (2009), Kim 3.6:1 (2010) and Nazar 3:1 (2010). (11,12,13,14,15,16,17,18).
Age structure of the respondents was balanced. Male respondents were somewhat older, M=58.50 ± 13.4 years as compared to female respondents, 52.88 ±15.1 years, but without any statistically significant difference, p=0.089. In the Gritz study the average age of patients was M=58.4 years, in the study of Nagy it was M=53.8 years, the Hassan study M=55 years, the Hassanein study M=58 years and in the Lam Tang study M=55.5 years (11, 12, 13, 14, 15), which is approximately similar age structure as in our respondents. In several studies the average age structure was slightly over 60 years of age: Nazar M=64.4 and Rogers M=62 years of age, whereas only one study had results for under 50 years of age, specifically Kazi study M=49.6 years (18,19,20).
More than half of the respondents, specifically 58 (65%) of them, who took part in the study were married, 14 (16%) participants were single, 12 (13%) of them were widowers/widows, whereas 5 (6%) participants were divorced. Similar results were produced by Pinjatela (2008) whose study included 61.1% of married participants, 9.3% of single participants and 14.8% of widowers/widows and divorced participants respectively (21).
Out of the total number of respondents 44% was with high school, 26% with elementary education, 17% of participants were with higher education, whereas 13% of them were with university degree. In the Pinjatela study (2008) 53.6% of respondent had high school diploma, 20.4% of them had higher education, 16.7% of participant had university degree, whereas 9.3% of the respondents were with elementary education (21).
After completed study we obtained median values for physical health components which were within good interval range, given that a score of 100 represents the best socio-emotional health quality and full functioning, whereas a score of 0 represents complete dysfunction. We presented physical health components median values and concluded that problems related to swallowing (M=71.69±33.85), taste (M=68.88 ± 35.17) and saliva (M= 70.45±33.57) components had minimum score. In the studies of Nagy (Hungary) and Kazi the patients faced the biggest problem with chewing, whereas Rogers (USA) in his study showed that 45% of patients included in his study did not experience any chewing problems (12,19,20).
The median values of socio-emotional health components of the respondents were within good interval range. Regarding the socio-emotional health components respondents from our study stated that the biggest problem related to mood (M=54.49 ± 33.82) and anxiety (M=55.96 ± 34.69). The same results were obtained by Bhanja (2016) in whose study the respondents experienced the biggest problems with mood and anxiety. The median mood values in his study were M=46.5 ± 23.7, while median anxiety values were M=56.4 ± 26.9 (22).
Following the statistical data processing we reached a conclusion that there is a correlation between physical and socio-emotional health components, p=0.0001, R2 =0.750, that the respective correlation is strong and that higher level of socio-emotional component corresponds to higher level of physical health component. Physical and socio-emotional health components were subsequently compared to standard values of Derek Lowe and Simon N. Rogers (2012) who used a set of data from 349 patients without cancer (10). Physical and socio-emotional component values among our respondents statistically significantly deviated from the recommended standards, p=0.0001 (10).
The values of physical health component in our study were M=69.75±29.12, while in the Bhanja (2016) study the values of physical health components were slightly higher in relation to ours, amounting to M=74.6±18.2 (22). The values of socio-emotional health component in our study were M=65.11±27.47, while in the Bhanja (2016) study the values of socio-emotional component were M=65.2±17.6 (22). The values of physical and socio-emotional health component statistically significantly deviate from the recommended values, p=0.0001 (10).
5. CONCLUSION
Median quality of life value of patients with oral cavity cancer in our sample was M=69.75 ±29.12 for physical health component and M=65.11 ± 27.47 for socio-emotional health component out of the total of 100 points. This could be considered as satisfactory quality of life, in the sphere above half of the rating scale, although both values significantly deviate from the UW-QOL scale norm. Physical and socio-emotional health components are in a strong positive correlation, R2=0.750, p=0.0001.
Footnotes
• Conflict of interest: none declared.
REFERENCES
- 1.Birim O, Bogers AJ, Kappetein AP. Cost effectiveness of coronary revascularisation. Euro Intervention. 2010;5(7):763–7. doi: 10.4244/eijv5i7a128. [DOI] [PubMed] [Google Scholar]
- 2.World Health Organisation. WHO Expert Committee on Medical Rehabilitation WHO. Tech. Rep. Ser. 1969;419(1) [PubMed] [Google Scholar]
- 3.Dautović S, Tomić-Ćuk I. Tumori maksilofacijalne regije. Sarajevo: Rail Print; 1998. [Google Scholar]
- 4.Mašić T, Ajanović M, Babajić E, Zunić L. Osnovi maksilofacijalne hirurgije. Sarajevo: Avicena; 2011. [Google Scholar]
- 5.Fočo F, Imamović E. Osnovni pojmovi i principi u maksilokraniofacijalnoj hirurgiji, Sarajevo, Institut za naučnoistraživački rad i razvoj KCUS-a, Sarajevo. 2012 [Google Scholar]
- 6.Fočo F, Džananović L, Zvizdić Z, Imamović E, Ramović I, Čavaljuga S. Maligni tumori usana: Analiza preživljavanja. Med žurnal. 2013;19(1):14–9. [Google Scholar]
- 7.Crnković I. i sar. Kvaliteta života laringektomiranih osoba. JAHS. 2015;1(2):107–18. [Google Scholar]
- 8.Rhee JS, Matthews BA, Neuburg M, Logan BR, Burzynski M, Nattinger AB. The skin cancer index: clinical responsiveness and predictors of quality of life. Laryngoscope. 2007;117:399–405. doi: 10.1097/MLG.0b013e31802e2d88. [DOI] [PMC free article] [PubMed] [Google Scholar]
- 9.Ringash J, Bezjak A. A structured review of quality of life instruments for head and neck cancer patients. Head Neck. 2001;23:201–13. doi: 10.1002/1097-0347(200103)23:3<201::aid-hed1019>3.0.co;2-m. [DOI] [PubMed] [Google Scholar]
- 10.Lowe D, Rogers SN. University of Washington Quality of Life Questionnaire (UW-QOL v4) 2012:1–11. [Google Scholar]
- 11.Gritz ER, Carmeck CL, De Moor C, Coscarelli A, Schacherer CW, Meyers EG, Abemayor E. First year after head and neck cancer: Quality of life. J Clin Onc. 1999;17(1):352–360. doi: 10.1200/JCO.1999.17.1.352. [DOI] [PubMed] [Google Scholar]
- 12.Nagy J. Quality of life of head and neck cancer patients after tumor treatment and subsequent maxillofacial rehabilitation. Hungary. 2011 [Google Scholar]
- 13.Hassan SJ, Weymuller EA., Jr Assessment of quality of life in head and neck cancer patients. Head Neck. 1993;15(6):485–96. doi: 10.1002/hed.2880150603. [DOI] [PubMed] [Google Scholar]
- 14.Hassanein KAM, Musgrove BT, Bradbury E. Psychological outcome of patients following treatment of oral cancer and its relation with functional status and coping mechanismus. J Cran Max Surg. 2005;33:404–9. doi: 10.1016/j.jcms.2005.05.005. [DOI] [PubMed] [Google Scholar]
- 15.Lam Tang JA, Rieger JM, Wolfaardt JF. A review of functional outcomes related to prosthetic treatment after maxillary and mandibular reconstruction in patients with head and neck cancer. Int J Prosthodont. 2008;21(4):337–54. [PubMed] [Google Scholar]
- 16.Lopez JH, Mayordomo AR, Rosado RL, Fernandez CIS, Gallana S. Quality of life in long-term oral cancer survivors: A comparison with Spanish general population norms. J Oral Maxillofac Surg. 2009;67:1607–14. doi: 10.1016/j.joms.2008.12.039. [DOI] [PubMed] [Google Scholar]
- 17.Kim TW, Youm HY, Byun H, Son YI, Baek CH. Treatment outcomes and quality of life in oropharyngeal cancer after surgery-based versus radiation-based treatment. Clin Exp Otorhinolaryng. 2010;3:153–60. doi: 10.3342/ceo.2010.3.3.153. [DOI] [PMC free article] [PubMed] [Google Scholar]
- 18.Nazar G, Garmendia ML, Royer M, McDowell JA, Weymuller EA Jr, Yueh B. Spanish validation of the University of Washington Quality of life questionnaire for head and neck cancer patients. Otolaryng Head Neck Surg. 2010;143:801–7. doi: 10.1016/j.otohns.2010.08.008. [DOI] [PubMed] [Google Scholar]
- 19.Rogers SN, Hannah L, Lowe D, Magennis P. Quality of life after 5-10 years after primary surgery for oral and oropharyngeal cancer. J Craniomaxillofac Surg. 1999;27:187–91. doi: 10.1016/s1010-5182(99)80049-3. [DOI] [PubMed] [Google Scholar]
- 20.Kazi R, Johnson C, Prasad V, De Cordova J, Venkitaraman R, Nutting CM, et al. Quality of life outcome measures following partial glossectomy: using the UW-QOL scale. J Cancer Res Ther. 2008;4:161–2. doi: 10.4103/0973-1482.42641. [DOI] [PubMed] [Google Scholar]
- 21.Pinjatela R. Neke karakteristike kvalitete života osoba sa i bez malignog oboljenja. Hrvatska revija za rehabilitacijska istraživanja. 2008;44(2):79–98. [Google Scholar]
- 22.Bhanja AD, Souza DSJ, Roy C, Poddar RN. Assessment of Quality of Life in Oral Cancer Patients Following Pectoralis Major Myocutaneous Flap Reconstruction. International Journal of Contemporary Medical Research. 2016;3:1366–71. [Google Scholar]