

Significance
Transcription factors (TFs) control biological processes by binding and unbinding to DNA. Therefore, it is crucial to understand the mechanisms that affect TF binding kinetics. Recent studies challenge the standard picture of TF binding kinetics by showing cases of proteins in solution accelerating TF dissociation rates through a facilitated dissociation (FD) process. Our study shows that FD can occur at the level of single binding sites without the action of large protein clusters or long DNA segments. Our results quantitatively support a model of FD in which competitor proteins invade partially dissociated states of DNA-bound TFs. FD is expected to be a general mechanism for modulating gene expression by altering the occupancy of TFs on the genome.
Keywords: DNA–protein interactions, biomolecule binding, chemical kinetics, transcription factor, facilitated dissociation
Abstract
The binding of transcription factors (TFs) to DNA controls most aspects of cellular function, making the understanding of their binding kinetics imperative. The standard description of bimolecular interactions posits that TF off rates are independent of TF concentration in solution. However, recent observations have revealed that proteins in solution can accelerate the dissociation of DNA-bound proteins. To study the molecular basis of facilitated dissociation (FD), we have used single-molecule imaging to measure dissociation kinetics of Fis, a key Escherichia coli TF and major bacterial nucleoid protein, from single dsDNA binding sites. We observe a strong FD effect characterized by an exchange rate , establishing that FD of Fis occurs at the single-binding site level, and we find that the off rate saturates at large Fis concentrations in solution. Although spontaneous (i.e., competitor-free) dissociation shows a strong salt dependence, we find that FD depends only weakly on salt. These results are quantitatively explained by a model in which partially dissociated bound proteins are susceptible to invasion by competitor proteins in solution. We also report FD of NHP6A, a yeast TF with structure that differs significantly from Fis. We further perform molecular dynamics simulations, which indicate that FD can occur for molecules that interact far more weakly than those that we have studied. Taken together, our results indicate that FD is a general mechanism assisting in the local removal of TFs from their binding sites and does not necessarily require cooperativity, clustering, or binding site overlap.
Protein–DNA interactions ultimately control all aspects of cellular function through their actions as “transcription factors” (TFs) by regulating gene transcription, folding DNA into chromosomes, and modifying the structure of chromatin; these regulatory and structural functions are often interwoven (1–9). Understanding protein–DNA interaction kinetics is, therefore, essential to the mechanistic understanding of cellular function. The standard picture of protein–DNA interactions assumes binding via concentration-dependent association and concentration-independent “spontaneous dissociation” kinetics, with net affinity neatly described by the ratio of the off rate, , to the association rate constant, (i.e., ). Experiments that resolve dynamics of individual molecules are starting to challenge this classical picture: lifetimes of DNA–protein complexes have been found to be appreciably shortened by nearby proteins that compete for space on DNA (10–20). However, the molecular mechanisms underlying this “facilitated dissociation” (FD) effect remain unclear.
A well-characterized DNA binding protein that has shown strong FD effects is the Escherichia coli TF Fis (13, 14). This dimeric TF binds diverse but sequence-specific DNA sites through a pair of helix–turn–helix domains to form a stable protein–DNA complex (21). Fis also has a weaker, but appreciable, nonsequence-specific DNA binding affinity that contributes to its role as a chromosome-organizing protein (22). This previous body of work establishes the Fis–DNA complex as a model system for studying the molecular basis of FD.
In this paper, we present single-molecule experiments on the Fis–DNA system plus theoretical analyses that establish that, through FD, competitor proteins can strongly modulate the stability of a single-protein dimer bound to a single DNA binding site, leading to a concentration-dependent off rate. The off rate saturates at high protein concentration, indicating the presence of a rate-limiting step along the FD pathway. Our experiments establish that FD can occur at the single-binding site level without the need for cooperative effects via clusters of multiple proteins or long segments of DNA (13). We also find that spontaneous dissociation and FD have distinct dependences on salt concentration. Our data for Fis are globally and quantitatively described by an analytically tractable theory, in which FD is generated by partial dissociation of the initially bound Fis, thereby allowing an unstable Fis–DNA–Fis ternary complex to form (10, 11, 13, 16, 18–20, 23–28). We validate our analytical theory using molecular dynamics (MD) simulations of FD that explicitly incorporate ionic effects. Finally, additional experimental data for a monomeric yeast TF, NHP6A, which binds a different short DNA through a single HMG box interaction (9), also display FD, indicating that the two DNA binding domains of Fis are not required for a protein–DNA complex to display concentration-dependent dissociation kinetics. Based on our results, we expect FD to be a generic effect that modulates the effective affinity of TF–DNA interactions in cells.
Results
Fis Stably Binds a Short Minimal Binding Sequence.
We used single-molecule fluorescence imaging to measure the dissociation kinetics of gfpFis from individual DNA binding sites (Fig. 1). We immobilized one end of 27-bp Cy3-labeled F1 dsDNAs to coverslips; the high-affinity F1 Fis binding sequence has been well-characterized thermodynamically and structurally (21). Although Fis is able to bind to a core 21-bp region of this site (21), additional contacts over the 27-bp window stabilize binding (29, 30), and shorter DNA oligos show weaker binding properties (21, 25, 30), indicating 27 bp to be the complete binding site length.
Fig. 1.

Off-rate measurement. (A) The survival fraction is measured by counting the number of fluorescent signals (green spheres in Left) remaining in the flow cell as a function of time and normalizing by the initial number of signals. A new region along the flow cell is used for a measurement of the survival fraction at each subsequent time point. To obtain the off rate, the survival fraction decay is fit to a single decaying exponential (Right). In the example shown, , with . SI Materials and Methods has details of the survival fraction calculation. (B) Camera frame showing single-molecule fluorescence images in separate channels. Each panel is the full 512 × 512-pixel array (52.5 × 52.5 µm2). Insets are magnified views of the regions contained in the white boxes. (Left) Fluorescent signals from gfpFis and (Center) signals from Cy3-labeled F1 DNA binding sites show (Right) a high degree of colocalization, indicating the specificity of gfpFis binding to F1 sequences. In Right, gfpFis signals are false-colored green, and Cy3–DNA signals are false-colored red. Regions where green false color overlaps with red false color appear orange, indicating colocalization. Only gfpFis signals that colocalize with Cy3–DNA signals are retained for inclusion in the measurement of survival fraction.
We determined the off rate of gfpFis in protein-free 100 mM NaCl buffer by measuring the number of gfpFis molecules that remain bound to F1 DNAs as a function of time (Fig. 1A). We observed a high degree of colocalization (up to ∼85%) between signals in the gfpFis and DNA channels (Fig. 1B), which ensures that the GFP signals that we retain for analysis correspond to Fis dimers bound to DNA. The decay curves fit well to single exponential decays of the form ; a sample decay curve is shown in Fig. 1A. In competitor-free buffer, Fis remains stably bound for a long period ( min; three replicate experiments), giving a spontaneous off rate of s−1.
Fis Protein in Solution Accelerates the Off Rate of Fis from Single Binding Sites.
Because previous experiments showing FD for Fis involved protein initially bound along a long extended dsDNA (13), potentially containing overlapping Fis binding sites or multiprotein clusters, we were interested in whether FD could also occur at a single F1 binding site. We first confirmed that F1 sequences only allow for the stable binding of individual gfpFis dimers by recording gfpFis signal fluorescence trajectories in protein-free buffer and constructing histograms of the number of bleaching steps (Fig. S1 A and B). We observe that the majority ( 94%) of trajectories bleach in one or two steps as expected for single gfpFis dimers (SI Materials and Methods and Fig. S1).
Fig. S1.

F1 sequences are binding sites for single gfpFis dimers. (A) Sample single-molecule fluorescence trajectories for gfpFis signals displaying (Left) one, (Center) two, or (Right) three bleach steps. Horizontal red lines represent gfpFis brightness at each fluorescence level. (B) Histogram of the number of bleach steps observed from each of a total of 50 observed gfpFis trajectories. Error bars are the square roots of the number of trajectories in each bin. (C) Histogram of measured bleach step sizes from a total of 30 Cy3–F1 DNA signal trajectories. The total number of bleach steps is 33 (a minority of Cy3 signals had multiple bleach steps). The mean of the distribution is 141,700 ± 9,800 . (D) Overall probability to observe binding sites in a diffraction-limited region given that there is at least one binding site. combines the probability for a streptavidin molecule to be occupied by o binding sites with the probability for streptavidin molecules to be colocalized to a diffraction-limited area.
We next recorded a series of gfpFis decay curves measured with different concentrations of wtFis in solution (0–1,790 nM) (Fig. 2A). Before adding wtFis, the excess gfpFis was washed out of the flow cell. We observed that, with increasing Fis concentration, the off-rate curves decay increasingly rapidly, showing that FD of Fis does not require long segments of DNA that contain multiple binding sites. The decay curves fit well to single exponential decays, and the resulting off rate (, the rate constant from the exponential fit) shows an initially linear increase with protein concentration (Fig. 2B). However, for wtFis concentrations beyond ∼250 nM, the off rate saturates. This fact indicates the presence of a rate-limiting step in the protein dissociation pathway (25).
Fig. 2.

TF dissociation measurements from single binding sites. (A) Sample survival fraction time course measurements (symbols) for gfpFis at each concentration of wtFis in solution that was tested. Error bars are estimates of the statistical uncertainty in the data points from various sources (SI Materials and Methods). At each concentration, the early portion of the survival fraction decay is well-fit to a single exponential decay to obtain the off rate (curves; typically ). (B) Off rate vs. concentration of wtFis in solution. Vertical error bars are a weighted SD of two to four measurements, except for the measurement at 54 nM, which contains a single measurement (SI Materials and Methods). Sizes of the horizontal error bars are smaller than the symbols (except for data point at 1,794 nM) and represent statistical error in [wtFis]. (Inset) Low-concentration behavior. Solid curve is a fit to Eq. 1. The exchange rate and saturation rate are estimated from the fit and given by M−1 s−1 and s−1, respectively; is within 0–8 nM, and . Errors are scaled by . If the ratio is fixed to the measured value [], and change by 16.9 and 7.6%, respectively, which are within error. (C) NHP6A survival fraction time courses showing that NHP6Agfp also displays FD from single binding sites using wtNHP6A as a competitor. Experiments performed in protein-free 50 mM NaCl buffer are shown for two duplicate trials (gray and black symbols). Vertical error bars are estimated as in A. The datasets corresponding to 80 and 250 nM [wtNHP6A] are normalized to the number of signals measured after the survival fraction has already decayed by reincubating the flow cell with NHP6Agfp and counting the number of signals under protein-free buffer conditions.
Fis Off Kinetics Are Described by a Simple Model with a Ternary Intermediate.
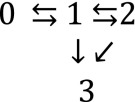
Our results can be described using the kinetic scheme depicted in Eq. S6 and Fig. S2A (13, 27, 31), which specifies a possible mechanism by which TFs in solution lead to FD of a TF bound to DNA. This model is based on the idea that there are thermally excited, partially dissociated states where some, but not all, DNA–protein contacts are broken. A TF fully bound to its binding site (state 0) is thermally excited into a partially bound state (state 1) that is susceptible to invasion by a TF from solution to form an unstable ternary complex (state 2). The off rate of Fis corresponds to the inverse of the mean time for a fully bound Fis molecule to transition to a fully unbound state (state 3) by either spontaneously dissociating (transitioning directly from state 1 to state 3) or FD.
Fig. S2.

Simple model of FD. (A) Kinetic diagram of FD. In a simple version of the kinetic scheme depicted in Eq. S6 (27), the protein molecules and DNA binding sites are each represented by a dimer of identical subunits. Because of the twofold symmetry implicit in this scenario, the TF partially unbinds by breaking exactly one-half of the total number of contacts made with the DNA. Note that we do not intend this figure to depict the actual structure of the Fis–DNA–Fis ternary complex or suggest that one Fis subunit actually completely dissociates from DNA in state 1. (B) Red curves show the predicted salt dependence of the off rate in the FD kinetic scheme using arbitrary parameters. Red curves are parameterized by different protein concentrations. The solid black curve represents the salt dependence of the spontaneous dissociation pathway, which does not depend on the concentration of TFs in solution, and shows the asymptotic behavior at high salt concentrations. Dashed black curves are parameterized by the protein concentration and show the asymptotic behavior of the off rate at low salt concentrations where the protein-dependent pathway is dominant.
A calculation (SI Materials and Methods and Eq. S10) of the mean time to dissociation under this scheme gives the following form for the off rate (25):
| [1] |
where is [wtFis]. The constants , , and are combinations of the microscopic rate constants from the kinetic model. By using Eq. 1 to fit the data (Fig. 2B), we determine M−1 s−1. The saturated rate at high wtFis concentration is , which is nearly 100-fold larger than the spontaneous dissociation rate . Qualitatively, our observation that the off rate of Fis from DNA is accelerated by Fis proteins in solution and quantitatively, the approximate exchange rate are both in agreement with previous single-DNA protein competition experiments (13) as well as experiments showing FD for Fis bound to the E. coli nucleoid (14). Our results show that FD does not necessarily require long stretches of DNA that contain overlapping binding sites (32) or clusters of proteins.
NHP6A Also Displays FD from SRY Binding Sites.
To determine whether dimeric structure (e.g., Fis) is required for FD, we measured survival probability decay curves of NHP6A, a monomeric TF in yeast that consists of a single HMGB box domain (9), using the same approach that we used for Fis. For an NHP6A binding site, we used a short Cy3-labeled dsDNA segment containing the recognition sequence for the SRY protein, because an NMR solution structure for the SRY DNA–NHP6A complex has been determined (9). Survival probability curves of NHP6Agfp fusions, measured in 50 mM NaCl buffer that includes 80 or 250 nM wtNHP6A, showed faster decays than those in protein-free buffer (Fig. 2C). Our results with monomeric NHP6A, which has a different structure and binding mode than dimeric Fis, show the generality of FD.
Salt Dependence of Spontaneous Off Rate Is Strong; Salt Dependence of FD Is Weak.
Returning to the case of Fis, we measured the univalent salt concentration dependence of the off rate. We reasoned that this would provide a molecular-level probe of the kinetic pathways involved in FD. We first measured the salt dependence of the off rate in protein-free buffer (Fig. 3 A and C) at several salt concentrations, , in the range of 75–250 mM NaCl, and we observed a strong salt dependence: the off rate fits to a power law of the form , with exponent . The overall spontaneous dissociation pathway ( in Fig. S2A) is, therefore, strongly salt-dependent.
Fig. 3.

Salt dependence of off rate. (A) gfpFis decay curves measured in protein-free buffer at multiple NaCl concentrations. (B) gfpFis decay curves measured in buffer containing 243 nM [wtFis] at multiple NaCl concentrations. (Inset) Same data shown on a zoomed in scale to show detail. In both A and B, the early portions of the survival fraction curves are fit to a single exponential decay to obtain the dissociation rate, and the error bars are estimated just like in Fig. 2A. (C) Off rate of gfpFis as a function of NaCl concentration in protein-free buffer (black symbols) and buffer containing 243 nM [wtFis] (white symbols). Error bars are estimated as in Fig. 2B. Long dashed curves are power-law fits. The protein-free off rate is fit to a single power law (), giving . The 243 nM off rate is fit to a sum of power laws () (Eq. 2), with and fixed to the values obtained by fitting the protein-free data. The gray band is a range of fits to the 243 nM data obtained by allowing joint variation in and while still allowing for a plausible fit. In these fits, ranged from 0 to 0.25, beyond which the slope of the power law did not allow for reasonable agreement with the data. A single power-law exponent equal to is shown for comparison (short dashed curve).
To probe the [wtFis]-dependent FD pathway, we next measured the off rate with nM wtFis in solution at several values in the range of 20–300 mM NaCl (Fig. 3 B and C) [this wtFis concentration is roughly halfway up the FD off-rate curve in Fig. 2B and also likely comparable with the free wtFis concentration found in vivo (14)]. The observed salt dependence is weak (Fig. 3C), suggesting that either the protein-dependent pathway does not depend on salt concentration or it is rate-limited by a salt-independent step. This observation suggests fitting the 243 nM data to the combined power-law form:
| [2] |
where and are fixed to the values obtained by fitting the protein-free data. The fits to the 243 nM data (Fig. 3C) can accommodate a power-law exponent no larger than , with the best fit given by (i.e., no salt dependence at all).
It is well-established that the dissociation constant for many protein–DNA interactions has a power-law dependence on univalent salt concentration, , leading to vs. being linear (33, 34):
| [3] |
where the slope is proportional to the number of positive counterions released from the DNA molecule or equivalently, the number of contacts formed between the protein and the DNA when the protein binds (35). This relation motivates the use of power laws in Eq. 2 to fit the salt dependence of the off rate in Fig. 2C, because for a simple bimolecular reaction. It should be noted that the partial dissociation model makes the prediction (which we have confirmed here) (Fig. 3C) that, over some range of , which depends on the protein concentration, the salt dependence of the off rate is weaker when proteins are in solution (explained in SI Materials and Methods and depicted in Fig. S2B). These results suggest that the number of counterions released in forming a ternary complex during FD is a small fraction of the number of counterions that condense on the binding site when Fis is released during spontaneous dissociation.
Partial Unbinding Model Simultaneously Explains and Dependence.
We sought to generalize Eq. 1 to account for the observed salt dependence. We formulated a model (Fig. 4A and Fig. S3) that incorporates the effects of DNA-bound counterions on the free energies involved in the kinetic steps along both dissociation pathways. The model also allows for asymmetric unbinding of the protein from the DNA. We used the exact analytical calculation (above) of the mean time (Eq. 1 and Eq. S10) for a protein to dissociate from the DNA binding site in terms of the microscopic rate constants (arrows in Fig. 4A) and the protein concentration, = [wtFis], in solution. Using detailed balance, the salt dependencies of the set of are included, which results in a model for the off rate, , in terms of the physical parameters of the model, the protein concentration, and the ionic strength (SI Materials and Methods and Fig. S3 for a detailed derivation). The incoming wtFis molecule forms a ternary complex by binding to the partially exposed binding site, destabilizing the binding of the original gfpFis molecule, and blocking its return to state 1. In our model, this transition leads to the dissociation of both the initially bound gfpFis and the incoming wtFis molecules (arrow in Fig. 4A); however, it is also possible that the wtFis molecule replaces the original molecule (arrow in Fig. 4A).
Fig. 4.

Global fit to kinetic model and simulations. (A) Schematic representation of a kinetic model of FD. Schematic depicts the multivalency of Fis–DNA interactions by drawing Fis as a multipartite object. However, this sketch should not be interpreted as Fis taking a linear form. The model explicitly includes positive Na+ ions in solution, which can condense on DNA and compete with binding locations on Fis for contacts to the DNA. Going from state 1 to state 2, the original TF (green) is shown with fewer contacts to the DNA to depict the possibility that the competitor could destabilize the binding of the original TF. The gray box encircles the two possible final states of the ternary complex; however, this study considers the left-pointing solid arrow. SI Materials and Methods has a detailed derivation of the mean reaction time, including the salt and protein concentration dependence with this kinetic model. (B) [wtFis] (Left) and [NaCl] (Right) dependence measurements of the off rate are globally fit to extended kinetic model (solid curves). Bimolecular on-rate constant M−1 s−1 is fixed by experiment (SI Materials and Methods) in the fitting. Gray bands represent 68.3% confidence intervals of the fit (SI Materials and Methods). (C) Coarse-grained simulations correspond to an extended kinetic model where protein and DNA molecules are represented by chains of reactive beads as illustrated in Inset (SI Materials and Methods). (Left) Protein concentration dependence of the off rate obtained from the simulations. Off rate is plotted in units of the inverse self-diffusion time of a bead (SI Materials and Methods). (Right) Salt concentration dependence of the off rate at multiple protein concentrations.
Fig. S3.

Energy diagram of the FD model including multivalency of TF–DNA interactions and salt ions. Upper corresponds to the spontaneous dissociation pathway. Lower corresponds to the protein concentration-dependent pathway. TFs (green and black strings of beads) are composed of multiple identical subunits, each of which binds a part of the DNA binding site (blue strings of beads). Salt ions (red crosses) are explicitly included and allowed to compete with TFs for making contacts with the DNA binding site. The overall binding energy of a TF is given by . Transition barrier heights are labeled with either B (to indicate that part or all of a TF is binding DNA) or UB (to indicate that part or all of a TF is unbinding DNA). Black arrows represent microscopic kinetic rates between states. Gray arrows are auxiliary rates used in calculating the salt dependence of the kinetic rates that go in the off-rate calculation.
We performed a global fit to the and dependences of the off rate using this model (SI Materials and Methods has fitting details). Because the large number of parameters made fitting impossible, we fixed the bimolecular on-rate constant by direct measurement (SI Materials and Methods and Fig. S4) to reduce the number of free parameters. We made the simplifying assumption that the measured on-rate constant corresponds to the rate for Fis to bind to sites that already contain partially bound Fis molecules in state 1. However, we expect that as defined in the model is somewhat less than , because it is measured on initially empty binding sites. A smaller will lead to fitted values for the microscopic kinetic constants that differ from those that come from our fit to the model (Table 1). However, the fit is well-constrained by the data and is shown in Fig. 4B. Furthermore, the kinetic rate is well-constrained by the data, even before is fixed. All of the kinetic rates of the model except , which has a broad distribution (Table 1), are well-constrained by the data. However, it is clear that is large compared with , and therefore, is rate-limiting for the competitor-dependent pathway. Despite the fact that the microscopic rate constants (except for ) that come from the fit cannot all be obtained accurately, the model is able to simultaneously capture the weak (essentially absent) salt dependence of the 243 nM data between 20 and 175 mM NaCl, the strong salt dependence of the protein-free measurements, and the saturation of the off rate at high protein concentrations. Therefore, our findings support partial unbinding of Fis as the molecular mechanism of FD.
Fig. S4.

Measurement of on-rate constant. (A) On-rate measurement uncorrected for bleaching. The red marker designates when gfpFis is added into solution. The concentration of gfpFis added in solution is 61 ± 1 pM. (B) On-rate measurement corrected for bleaching. Data are fit to an exponential recovery function (red curve) of the form , with fixed to 26.25 signals, giving an exponential recovery time of . (C) On rate shows expected linear scaling with gfpFis concentration . Data points are on-rate measurements at 61 ± 1 and 243 ± 5 pM. Error bars represent statistical error in on rate from fitting to an exponential recovery. The solid line has a slope equal to the measured bimolecular on-rate constant γ estimated from the 61 pM measurement. Dashed lines represent the total statistical error in γ. Systematic error in the on rate, caused by error in the bleaching rate, is represented by duplicate data points at each concentration. (D) Bimolecular on-rate constant γ estimated from 243 pM data is consistent with the estimate from 61 pM data. Data points at each concentration are weighted averages of data points in C. Error bars include all statistical and systematic errors combined. The red line represents a typical estimate of a diffusion-limited bimolecular on-rate constant (56).
Table 1.
Microscopic rate constants obtained from global fitting with the FD model
Rate constants are referenced to their values at 100 mM NaCl; , , and are not fitted parameters, but they are instead measured values with distributions that are imposed on the fit in Fig. 4B.
Except for , all constraints are statistical 68% confidence intervals. Quoted values are those that minimize with , , and fixed to their measured most probable values. Additional systematic uncertainty in the kinetic rates comes from being known only up to an overall unknown factor. Note that the combination of and not directly is measured. Uncertainty on is, therefore, estimated from direct measurement of and by simulating errors on given the experimental errors on and .
Although was not a fitting parameter in the final fitting function S21 ( is ignored compared with in Eq. S19), placing constraints on it was possible by performing fits using an equation derived from Eq. S19. The upper limit on is found by fixing to and finding the minimum value of that allows consistency with the data.
Coarse-Grained Simulations Validate Multivalent Partial Unbinding Model.
To judge the applicability of the multivalent partial unbinding model, we performed coarse-grained MD simulations (Fig. 4C and SI Materials and Methods) designed to mimic features of our experiment and our revised model by a generic bead spring model (Inset in Fig. 4C, Left and Fig. S5). Specifically, the simulations explicitly included multivalent structure in the DNA binding sites and competitor protein molecules and in addition, explicitly included positive charges in solution that could serve as counterions to compete for binding with positively charged protein molecules. The individual DNA binding sites are each represented by a chain of four negatively charged beads, and the proteins are represented by chains of four positively charged beads. All beads interact via long- and short-range Coulomb interactions. The steric interactions between beads are taken into account by repulsive excluded volume potentials; attractive interactions are only between the binding site and proteins (SI Materials and Methods). We note that, although we define our model via interaction potentials, it is possible to directly implement chemical reaction rates instead (36).
Fig. S5.

Illustration of the single-binding site model used in the simulations. A small portion of the 3D simulation box is shown in Right; is the average distance between competitor protein in solution, and is the distance between two grafted chains. In the simulations, the full number of binding sites is 100.
The simulations show a strongly accelerated off rate of prebound protein when competitor proteins are introduced (Fig. 4C, Left), qualitatively in accord with both our experimental data and our analytical model. The simulations also display the saturation of off rate at large competitor concentrations (Fig. 4C, Left and Fig. S6) seen experimentally and in the analytical model. Finally, the simulations also produce a strong salt dependence in the absence of protein in solution (black curve in Fig. 4C, Right and Fig. S6) and weak salt dependence at high protein concentrations, again qualitatively in accord with experiment and the analytical model.
Fig. S6.

Survival fraction curves in simulations. (A) Survival fraction of bound proteins as a function of simulation time for various salt concentrations in the presence of competitor Fis. The volume fraction of competitors is on the order of 10−5σ−3. (B) Survival fraction for various competitor protein concentrations at . The simulation time is in the units of LJ time; . All curves are single exponential fits.
It is important to note that, for reasons of computational power, the MD simulations must be done for weaker and consequently, shorter-lived protein–DNA interactions than occur for Fis or NHP6A in our experiments. In the simulations, the length scale σ, which corresponds to the size of a bead and is set by the requirement that the electrostatic energy between two beads in surface contact has to be equal to kBT, is ∼0.7 nm, making 1/σ3 ∼ 5 M and 1/τ ∼ 4 × 10⁹ s−1, where τ is the self-diffusion time of a bead, kB is Boltzmann’s constant, and T is the absolute temperature, indicating that comparison of MD and experiment can be only qualitative. However, the MD results indicate that similar FD effects can be expected for biomolecule interactions that are far weaker and shorter-lived than we can study with our current time resolution.
SI Materials and Methods
Protein Purification.
Expression and purification of wtFis, gfpFis, wtNHP6A, and NHP6Agfp, all without tags, have been described previously (13, 43, 44).
DNA Binding Sites.
Binding sites for protein molecules consist of Cy3-labeled and biotinylated dsDNA molecules purchased from Integrated DNA Technology (IDT). For Fis, we use a sequence called F1 (21), which is formed by annealing a forward strand 5′-AAA TTT GCT CAA AAT TCA AAC AAA TTT-Cy3-3′ to a complementary reverse strand 5′-/5AmMC6/AAA TTT GTT TGA ATT TTG AGC AAA TTT-biotin-3′ (/5AmMC6/ refers to a 5′ amino modifier from IDT) in annealing buffer (10 mM Tris, pH 8.0, 1 mM EDTA, 50mM NaCl in nuclease-free water). Annealed Cy3-labeled dsDNA is diluted into annealing buffer supplemented with 0.2% Triton-X100 and 0.5 mg/mL casein to prevent DNA from sticking to storage tubes.
Binding sites for NHP6A molecules also consist of Cy3-labeled dsDNA but contain the recognition sequence for the human sex-determining region Y protein SRY, which also functions as a target for NHP6A binding (9). The forward strand is 5′-/5AmMC6/AAA TTT GTG AAT GTT CAA AAT TTG G-biotin-3′, and the reverse strand is 5′-CCA AAT TTT GAA CAA TCA CAA AAT T-Cy3-3′. Annealing and storage are done in the same buffers used for F1 sequences. We checked that DNA strands annealed together properly using gel electrophoresis.
Flow Cell Preparation and Imaging Buffer.
Flow cells are made by sandwiching thin strips of double-sided adhesive tape between rectangular borosilicate glass coverslips (Fisher Scientific catalog no. 12–544-E, size: 24 × 50 mm, No. 1.5) and 1 × 3-in glass slides. The volume of a flow cell is ∼10 µL. Glass slides have holes drilled on both ends of the flow cells to allow for buffer exchange using a pipette. Slides and coverslips are cleaned and functionalized using methods adapted from previously described procedures (45). Slides and coverslips are amino-modified using amino silane [N-(2-aminoethyl)-3-aminopropyltrimethoxysilane; United Chemical Technologies]. Slides and coverslips are PEGylated for 2 h or overnight using mPEG (mPEG-SVA-5000; Laysan Bio) in 5.4 mg/mL sodium bicarbonate solution; however, coverslips use an additional 4–7% biotinylated PEG (Biotin-PEG-SVA-5000; Laysan Bio) to allow attachment of biotinylated DNA to the surface via biotin–streptavidin linkage.
The buffer used for imaging, rinsing flow cells, and diluting proteins (referred to as T-X buffer, where X is between 10 and 300 depending on the NaCl concentration used in the experiment) contains X mM NaCl, 3 mM MgCl2, and 10 mM Tris⋅HCl (adjusted to pH 7.55 ± 0.04 using NaOH) in nuclease-free water. Flow cells are incubated with 0.5 mg/mL casein (Sigma Aldrich) to prevent nonspecific adhesion of biomolecules. Next, flow cells are incubated with 0.2 mg/mL streptavidin (Invitrogen) followed by incubation with 2–20 pM either F1 or SRY Cy3-labeled dsDNA. Flow cells are then reincubated with casein before addition of ∼3 nM gfpFis or ∼30 nM NHP6Agfp. All incubations are for 5 min and contain 0.5 mg/mL casein. Flow cells are rinsed with 140 µL T-X buffer between all incubations.
Protein-free imaging buffer (made from T-X buffer) contains 1% β-mercaptoethanol, 0.5 mg/mL casein, and an oxygen scavenging system consisting of 0.04 mg/mL catalase (Sigma Aldrich), 0.1 mg/mL pyranose oxidase (Sigma Aldrich), and 0.4% d-glucose. We used pyranose oxidase instead of glucose oxidase to eliminate acidification of the imaging buffer (46). For protein competition experiments, gfpFis or NHP6Agfp was added to imaging buffer at the desired concentration by diluting from glycerol-containing stocks stored at −20 °C.
Single-Molecule Fluorescence Microscopy.
Prepared flow cells were imaged at room temperature using objective-type total internal reflection fluorescence (TIRF) microscopy on an inverted microscope (IX81; Olympus). Cy3–DNA molecules and gfp fusion proteins were excited using the evanescent waves from fiber-coupled lasers with wavelengths of 561 nm (85 YCA 075–115; Melles Griot) and 488 nm (Sapphire 488–20; Coherent), respectively. Before placing lasers in total internal reflection configuration, we measure the laser power exiting the objective to be 10 mW (561 nm) and 1.6 mW (488 nm). Fluorescence from both molecules is collected using a 100×, 1.45 N.A. oil objective and filtered using a dual-laser filter set (U-Nz488/561; Chroma Technology). Cy3 and GFP fluorescence is spectrally separated into different channels by temporally separating the excitation pulses of each laser using computer-controlled shutters on each laser.
The timing sequence for each survival fraction measurement consists of either a 10- or 15-frame image stack of a single region on the flow cell. Each Cy3 or GFP channel exposure is 350 or 500 ms, respectively, with a 37-ms lag between the end of the Cy3 exposure and the beginning of the GFP exposure. The repetition time is 1 s, and therefore, a survival fraction measurement takes ∼10 or 15 s depending on whether 10- or 15-frame image stacks were used. Subsequent measurements (i.e., subsequent image stacks) are taken from regions of the flow cell that have not been previously exposed to excitation light (in the text and Fig. 1A). This procedure ensures that photobleaching does not affect our survival fraction measurements, because each field of view receives equal doses of light energy, and it also ensures that our experiment is insensitive to drift. The fluorescence emission, which appears as diffraction-limited signals (∼320-nm FWHM), is collected onto the 512 × 512-pixel array of a force air-cooled EMCCD camera (Hamamatsu) and read out for storage onto a computer.
Single-Molecule Fluorescence Image Processing.
Processing of image stacks is accomplished using an analysis pipeline built from homemade software in MATLAB (MathWorks). For each channel in an image stack, the positions of the signals in each frame were determined by fitting the signal profile to a 2D Gaussian:
| [S1] |
where is the signal intensity, is the FWHM, and is the background level. The locations of the signals in the gfpFis channel are correlated between frames to generate trajectories. Counting the number of trajectories provides the number of detected gfpFis molecules. Trajectories in the gfpFis channel are selected for final analysis based on whether they spatially colocalize (i.e., whether they are within 0.55 pixels in both the and directions) with a DNA signal in the Cy3 channel. This procedure serves as a quality control to ensure that only gfpFis molecules bound to Cy3-labeled DNA binding sites are retained for analysis. We checked that off-resonant excitation of Cy3(GFP) does not register in the GFP(Cy3) channel.
The survival fraction at the th time point is determined by first counting the number of colocalized gfpFis signals in the th image stack. To divide out any variation of the number of Cy3 signals along the length of the flow cell, is divided by the average number of Cy3–DNA signals in the image stack. The survival fraction is finally given by
| [S2] |
where is an estimate of for the initial image stack ( = 0), which is obtained from a fit of to an exponential , and where is the time corresponding to the th image stack.
Statistical Uncertainty in Survival Fraction.
Error bars on survival fraction decay measurements are estimated by propagating statistical errors in , , and to . The error in is mainly caused by counting fluctuations: . The error in , , is given by the SD of the number of Cy3 signals in the image stack. Error in is given by , where and are the average number and SD of Cy3 signals in the initial (i.e., = 0) image stack, respectively, and is the number of colocalized gfpFis signals in the same image stack.
Determination of Off Rate from Decay Curves.
To obtain an estimate of the off rate from a single measurement, each survival probability curve is fit to
| [S3] |
where the off rate is given by . Off rates plotted in Fig. 2B (in the text) are averages of individual off-rate measurements
| [S4] |
weighted by the uncertainty of each measurement, where the subscript has been added to run over the number of measurements. Estimates of the uncertainty in the mean off rate (error bars in Fig. 2B) are given by the square root of an unbiased estimate of the variance:
| [S5] |
F1 Sequences Are Binding Sites for Single gfpFis Dimers.
Bleaching step histograms of gfpFis fluorescence trajectories.
To confirm that Cy3–F1 DNA binding sites only accommodate the stable binding of single gfpFis dimers, we recorded fluorescence trajectories of gfpFis molecules bound to F1 binding sites in protein-free buffer and counted the number of bleaching steps until the signals completely bleached. Signals were selected only if they completely bleached at some point in their trajectory. Representative gfpFis trajectories displaying one, two, and three bleaching steps are shown in Fig. S1A. Because each subunit of a gfpFis dimer contains a GFP fusion, we expect to see no more than two bleaching steps per gfpFis signal. A histogram of the number of bleaching steps is shown in Fig. S1B, showing that the majority bleached in one or two steps as expected. A minority of trajectories (3 of 50 trajectories or 6 ± 3%) were observed to bleach with three bleaching steps, which we attribute to the occurrence of multiple binding sites being spatially located in diffraction-limited areas because of streptavidin multivalency and the likelihood that multiple streptavidins are colocalized within diffraction-limited areas (as described below).
Estimate of Cy3–F1 binding site spatial density.
We estimated the number of biotinylated Cy3–F1 DNA sequences that get distributed among the available surface-bound streptavidin molecules. To obtain this estimate, we first summed the total signal (4.7 × 10⁹ ) contained on the whole 512 × 512 array of the first frame from the Cy3 channel of the same image stack used to obtain the gfpFis bleaching step data above. To estimate the fluorescence caused only by Cy3 molecules, we subtracted the estimated background level from the total signal to obtain a total Cy3 fluorescence level of 6.5 × 10⁸ . The background level per pixel was estimated by averaging measurements of the camera counts in selected subregions of varying size that were uniformly distributed throughout the image and devoid of Cy3–DNA signals. We also recorded fluorescence trajectories of individual Cy3 signals in the same image stack. We only recorded data from Cy3 signals that completely bleached. We estimated the mean brightness of a single Cy3 emitter by making a histogram of the sizes of the bleach steps in the measured trajectories (Fig. S1C). The mean brightness of a Cy3–F1 DNA is 141,700 ± 9,800 . Finally, the total density of Cy3–F1 DNA binding sites is given by , where is the area of the full 512 × 512 image.
Estimation of streptavidin spatial density.
We made estimates of the spatial density of streptavidin in our flow cells as follows. A flow cell, which was exposed to the same amount of streptavidin used in our off-rate measurements, was filled multiple times with an excess of biotinylated Cy3–DNA (∼100 pM) to saturate all available biotin binding pockets on the streptavidin molecules and washed with buffer. We measured the total fluorescence contained within a 350 × 57- region receiving uniform illumination by the laser field. To prevent saturation of the camera by Cy3–DNA fluorescence, we reduced the laser power to 0.4 mW, reduced the camera integration time for the Cy3 channel to 200 ms, and modified the imaging mode of the camera. Under these conditions, in which surface-bound streptavidin molecules are saturated with biotinylated Cy3–DNA, the images no longer contained individually resolvable diffraction-limited signals but instead, contained a dense lawn of fluorescence. A separate region of the flow cell was exposed to a high laser power (∼10 mW) to bleach the Cy3–DNA molecules to a level where individual diffraction-limited signals are resolvable. We then reduced the laser power back to 0.4 mW, and using the same camera settings as used in the previous image containing a high density of fluorescence, we recorded fluorescence trajectories of 14 signals from this region, choosing only signals that underwent single-step bleaching. We determined that the mean brightness of a Cy3–DNA signal under these imaging conditions is 55,000 ± 5,000 . Taking the ratio of the background-corrected fluorescence in the 350 × 57- region to the mean brightness of a Cy3–DNA signal gives an estimate for the total number of Cy3 emitters in the same region. Because surface-bound streptavidin has three remaining binding pockets for biotin, we divided the total number of emitters by three to obtain an estimate for the total number of streptavidin in the 350 × 57- region. As a result, we estimate that the functionalized surfaces of our flow cells contain a streptavidin surface density of .
Multivalency and high spatial density of streptavidin explain minority of gfpFis trajectories that bleach in three steps.
To determine the expected statistical distribution with which streptavidin biotin binding pockets are occupied with biotinylated Cy3–DNA molecules, we simulated the process using homemade software in C++. We randomly distributed objects, representing biotinylated Cy3–DNA molecules, into trivalent boxes, representing surface-bound streptavidin, and counted the number of streptavidin molecules that were occupied with o = 0, 1, 2, or 3 objects. This procedure gives the probability p(o) that any given streptavidin has o Cy3–DNA binding sites attached to it, which depends on the relative spatial densities of Cy3–DNA molecules and streptavidin molecules in a given area. Using the above-measured estimates for and , we calculated p(o) as giving 91.3, 8.3, 0.38, and 0.008% for o = 0, 1, 2, and 3, respectively. We find that, although the absolute probability for any given streptavidin to be doubly occupied by Cy3–DNA is only 0.5%, we estimate that, of all streptavidin molecules that are occupied by at least one binding site, 4.4% of them should contain two binding sites.
We also considered that, at a density of , we should expect a sizable probability for multiple streptavidin molecules to colocalize to a diffraction-limited area. The mean number ν of streptavidin per diffraction-limited area is given by , where is the diameter of a diffraction-limited region that we take to be 250 nm and gives ν = 0.9. The probability to observe randomly distributed streptavidin colocalized to a diffraction-limited region is given by a Poisson distribution (47). Including this effect, we constructed the total probability to observe colocalized binding sites in a diffraction-limited area. This probability, normalized to the probability to observe at least one binding site, is shown in Fig. S1D. We see that the overall probability to observe two binding sites in a diffraction-limited area is %, in excellent agreement with the observed fraction of gfpFis trajectories that underwent three bleach steps (6 ± 3%). We conclude that our data are consistent with Cy3-labeled F1 sequences allowing only one gfpFis dimer to stably bind at a time.
Simple Model of FD and Predicted Salt Dependence.
The basic kinetic scheme for a model of FD that we use throughout this work is given by
 |
[S6] |
A simple schematic version of this model, depicted in Fig. S2A, treats each protein molecule as a dimer of identical subunits and was theoretically studied in previous work (27). The DNA binding site is also represented by a dimer of identical subunits. Each protein subunit binds a DNA binding site subunit with binding energy . There are two pathways to dissociation. The first is a spontaneous dissociation pathway (), in which the protein unbinds in two steps. This pathway is independent of proteins in solution. The second pathway () requires competitor proteins in solution and involves the invasion of a partially dissociated protein by a competitor, leading to FD. Although we use the same basic kinetic scheme in this work, we do not make the simplifying assumption that is made in ref. 27 that the protein unbinds DNA in a symmetric fashion. However, this simplified model is nonetheless useful in qualitatively showing how the partial unbinding hypothesis predicts a weaker salt dependence when protein molecules are in solution.
The salt dependence of this type of kinetic pathway, restricted to the special case where the protein unbinds symmetrically from the DNA binding site because of its twofold symmetry, is derived as follows. The off rate in this model can be estimated to be (27)
| [S7] |
Here, is the binding energy for a subunit, is a constant reference chemical potential, is the absolute temperature, and is Boltzmann’s constant. The first term corresponds to the spontaneous off rate, and the second term corresponds to the parallel contribution of the protein concentration-dependent pathway, valid for low concentration. The binding energy and dissociation constant, , of a subunit are related by
| [S8] |
Combining Eq. S8 with Eq. 3 (in the text) gives an expression for the salt dependence of the binding energy, , which when inserted into S7, provides a prediction for the combined protein and salt dependence of the off rate . The power-law terms on the right-hand side are related to each other by unknown constants that should be set by experimental data. Here, is interpreted as the number of counterions released when one Fis subunit binds a DNA subunit. Therefore, the partial dissociation model makes the prediction (depicted in Fig. S2B) that, over some range of , which depends on the protein concentration, the salt dependence of the off rate is weaker when proteins are in solution. Specifically, in this simple version of the model, the prediction is that the exponent of the power law is reduced by a factor of two, reflecting the assumption that the partially dissociated state corresponds to loss of exactly one-half of the contacts of the fully bound state. However, the model that we consider in this work does not assume this symmetry and will, in general, allow the slope to be less than one-half as large during FD as it is during spontaneous dissociation.
Derivation of Mean Time to Dissociation.
The basic kinetic scheme considered throughout this work corresponds to the reaction in Eq. S6, which in turn, corresponds to the following set of coupled differential equations:
| [S9] |
where we assume that , where is the bimolecular on-rate constant, and where is the concentration of competitors in solution. This system is difficult to solve for arbitrary initial conditions. Instead, a method for exactly calculating the mean reaction time for an arbitrary reaction with an irreversible final step (48) is used to calculate the mean time to transition from state 0 to state 3. We find that is given by
| [S10] |
This expression can be written as , with , , and , and appears as Eq. 1 in the text.
Derivation of Modified Model and Associated Salt Dependence.
As outlined in the text, we generalized the model of FD by introducing multivalency in the binding of TFs to DNA and explicitly including salt ions that can compete with TFs for condensation onto DNA (in the text, Fig. 4A, and Fig. S3). To derive expressions for each of the microscopic kinetic rates in Eq. S10, we impose detailed balance at each kinetic transition along the reaction coordinate in Fig. S3. We assume each kinetic rate has the form
| [S11] |
where is an attempt rate, and is the barrier height going from state to state . Between states 0 and 1, we have
| [S12] |
where is the interaction free energy between states 0 and 1. This formula gives . Now we consider that there are salt ions at concentration , which can condense onto the partially exposed DNA binding site and lower the total free energy . We have , where is the number of ions that bind the DNA when the TF partially unbinds (i.e., goes from state 0 to state 1), and is the dissociation constant of a salt ion binding a DNA subunit. Again imposing detailed balance, this time including salt effects, we have
| [S13] |
At this point, we must choose how to distribute salt dependence between and subject to the constraint imposed by Eq. S13. Throughout this work, we make the assumption that all of the salt dependence enters on kinetic steps, where salt ions bind to DNA. This assumption results in the following salt dependence for and :
| [S14] |
Next, we consider the kinetic steps between states 1 and 2, which depend on the protein concentration . We have
| [S15] |
where is the diffusion-limited attempt rate for proteins in solution to bind to an exposed binding site and where we identify with the bimolecular on-rate constant . This formula gives . When the protein from solution binds, it releases the same counterions that bound between steps 0 and 1. This process increases the free energy, giving a total free energy change of . Again imposing detailed balance and choosing to put the salt dependence on , because that is the step where salt ions bind, we get for and
| [S16] |
An analogous procedure is used to derive the salt dependence for rates and , except that, in these cases, the corresponding reverse rates, and , respectively, are auxiliary rates used only for calculating and and do not enter the model. We obtain
| [S17] |
We identify with the total number of counterions that can condense along the DNA binding site. Plugging Eqs. S14, S16, and S17 into Eq. S10 gives an expression for the off rate, , in terms of the set of 15 physical parameters and the independent experimental control variables (i.e., protein concentration, , and salt concentration, ). The set of physical parameters includes six attempt rates, six barrier heights, , , and .
Measurement of Bimolecular On-Rate Constant γ.
To reduce the number of free parameters in fitting, we directly measured the bimolecular on-rate constant γ. A prepared flow cell was allowed to incubate with 8 pM Cy3–F1 DNA binding sites for 5 min, and excess DNA was washed away with T-100 buffer (i.e., 100 mM NaCl). The flow cell was stably mounted to the TIRF microscope using adhesive tape to prevent movement after imaging started. On one of the flow-through inlets of the flow cell, a 1-mL syringe equipped with a length of 28-gauge PTFE rubber tubing (Hamilton) was attached. On the other side of the flow cell, the flow-through inlet had a reservoir made from an Eppendorf tube cap with a hole in it, which was attached with epoxy and filled with T-100 buffer containing 61 pM gfpFis. Flow cells are initially imaged in protein-free buffer for a few frames before protein is flowed in using the syringe during imaging. In contrast to the off-rate measurements, the same region of the flow cell is imaged throughout the experiment to speed up the time resolution. The number of signals in each frame is plotted as a function of time (Fig. S4A). In separate experiments, the rate of gfpFis bleaching under the same buffer and imaging conditions is measured and used to correct the on-rate measurement (Fig. S4B). The bimolecular on-rate constant is given by , where is the on rate, and is the gfpFis concentration. We checked that had the expected linear scaling with protein concentration by measuring at two different concentrations (Fig. S4C). We measure the bimolecular on-rate constant to be M−1 s−1. An independent measurement of using 243 pM gfpFis is consistent with the measurement at 61 pM (Fig. S4D).
Global Fitting of Off-Rate Salt and Protein Dependence to Extended Model.
Derivation of the fitting function.
To obtain the fitting function used to model the off rate, we absorb the physical parameters that appear in the microscopic kinetic rates into a smaller set of eight fitting parameters . With the exception of , which is given by , this computation results in the following form for the microscopic kinetic rates:
| [S18] |
where , and , , , or zero depending on the combination given above. We simply refer to as , because it has no salt dependence. Plugging in these forms of into Eq. S10, we obtain
| [S19] |
We form a statistic to be minimized:
| [S20] |
where is the off-rate measurement, is the variance in each measurement (Eq. S5), is the number of off-rate measurements, and is the model evaluated at each salt and wtFis concentration measured. We minimize by the simplex method using the fminsearch() function in MATLAB (MathWorks). The minimization using the full parameter set was impossible because of the large size of the parameter space. However, we were able to reduce the number of fitting parameters, because we fix γ directly by experiment, and because we found that for salt concentrations greater than 20 mM (at = 100 mM, must be at least 600 and by all indications, almost certainly much larger; i.e., up to ), we found that we could safely neglect compared with . As a result, we are left with six fitting parameters: . After some algebra, our fitting function becomes
| [S21] |
In addition, we can impose constraints on and the combination . First, is the power-law exponent of the salt dependence of the spontaneous dissociation pathway, which was measured in Fig. 3C, and therefore, it is to be identified with . Second, we found that we could identify the power-law exponent, , of the weak salt dependence measured at 243 nM wtFis with (Fig. 3C). We draw this conclusion because the salt dependence in this regime is (note that this relation is valid, because both and in the denominator of ).
Monte Carlo fitting procedure.
In Fig. 4B (in the text), we perform a global fit of our data with S21 and estimate confidence intervals of the fit using a Monte Carlo fitting method described below. The fit imposes priors on , , and ; draws parameter errors from their joint distribution [which is estimated by calculating the covariance matrix (49)]; and tests sensitivity to the parameter initial starting values for the simplex method. On each of 60,000 total Monte Carlo runs, we
-
i)
Choose a value from a Gaussian distribution centered at the measured value with an SD equal to the measurement uncertainty.
-
ii)
Choose an value from a Gaussian distribution centered at the measured value with an SD equal to the measurement uncertainty.
-
iii)
Choose an value from an exponential distribution with and setting (the maximum allowable value for the weak salt dependence at 243 nM wtFis). This choice of gives a small probability density beyond . We chose an exponential distribution to model the uncertainty in , because the most probable value is , and we found that this was the best-fit value (in the text and Fig. 3C); is then set by taking the difference between the sampled values (i.e., ).
-
iv)
Perform a nonlinear minimization of using the fitting function in S21 with , , and fixed to their sampled values and where the parameters being optimized are . Before the nonlinear optimization is performed, the initial starting values for the minimization algorithm are randomly varied by 15% (and drawn from a uniform distribution). The best-fit values are given by .
-
v)
Calculate the covariance matrix of the fit. is given by , where the matrix is given by the index runs over the measurements, the index runs over the parameters being optimized, and . is the number of data points, and is the number of parameters being optimized. Nearly all of the variance of the fit is captured by and , and therefore, in practice, we only let run over those parameters when forming the matrix .
-
vi)
Randomly draw errors in the parameter vectors along the principal axes of their joint distribution, which is assumed to be approximately Gaussian near . The principal axes are given by the eigenvectors of , and the variances along those directions are given by the corresponding eigenvalues of (49).
-
vii)
Generate off-rate curves , , and evaluated at .
The 1σ confidence intervals in Fig. 4B contain 68.3% of the generated curves, and the main curves correspond to the best-fit parameters. The fitted values and 68% confidence intervals of the microscopic rate constants are reported in Table 1.
Coarse-Grained Simulations of FD.
Details of simulations including explicitly modeled salt ions.
The simulation model is designed to mimic the single binding/unbinding experiments with Fis–DNA. Each simulation box contains at least = 10 × 10 surface-grafted DNA chains (binding sites), an equal number of protein molecules initially bound onto the grafted DNA chains, a prescribed number of initially unbound proteins, corresponding counterions for protein and DNA molecules to keep the overall charge of the system neutral, monovalent salt ions, and an inert surface (Fig. S5). The aqueous medium is modeled implicitly as a continuum (see below). The DNA and proteins are modeled by a coarse-grained “Kremer–Grest” bead spring chain (50). In the model, each bead with size σ represents an interaction site. In real units, σ corresponds to 7 Å. The DNA chains are composed of N = 12 adjacently connected, identically sized beads. Four of the beads, which form the binding site, are given attractive interactions. Proteins are composed of P = 4 connected identical beads. The bonding between the adjacent beads of the chain is taken care of by a nonlinear potential with finite extensibility (50). Steric interactions between all connected and unconnected beads are accounted for by a shifted 12–6 Lennard Jones (LJ) potential with a strength of 1 and a cutoff distance of = 21/6σ, where is Boltzmann’s constant, and is the temperature. This cutoff is used to obtain a repulsive LJ force between all monomers, except the four beads on each DNA chain that form the binding site. Four of the N = 12 beads (blue beads in Fig. S5) interact with the proteins via an attractive LJ potential to mimic the specific binding sites for Fis proteins in the experiments. This LJ potential has a strength of 2, with a cutoff of = 2.5 . To account for the stiff nature of the grafted DNA chains, a harmonic bending potential, , is introduced, where is the angle formed by three adjacent beads, and the potential strength is given by . In addition, to keep the grafted chains at a right angle with the surface, a similar potential is applied on the grafted end of the chains []. The distance between the grafted binding sites is .
Each effective DNA monomer is assigned a unit negative charge, whereas each protein monomer bears a positive unit charge. For each charged bead of the DNA or protein, one oppositely charged counterion bead is added in the simulation box at a random position, so that the system is electroneutral, even in the absence of salt. The monovalent salt (NaCl) concentration is adjusted by adding a prescribed number of positive and negative charged beads in the simulation boxes. The size of the counterion and salt beads is 0.4 σ, and they interact with each other via a shifted 9–6 LJ potential. The short-range electrostatic interactions between all charged beads are accounted for by imposing a pairwise Coulomb potential , where is the distance between the th and th monomers. The potential is cut off at . Note that this cutoff is one-half the distance between two grafted binding sites on the surface. The long-range electrostatic interactions are calculated via a particle–particle–particle mesh Ewald solver with an error tolerance of 10−3 (51). The dielectric constant is set to unity, so that the Bjerrum length is equal to its value in aqueous medium at room temperature (i.e., ) (52, 53). The Bjerrum length defines the length scale, at which electrostatic energy is of the order of the thermal energy (∼1 ). Note that the lowest salt concentration (10 mM) considered in this work corresponds to a Debye screening length of .
The MD simulations are run at constant volume V and constant reduced temperature with Lammps MD package (54). The volume of the total simulation box is set to at least 230 × 230 × 60 . The vertical size of the boxes (60 ) is higher than the effective Gouy–Chapman length of the DNA-grafted surface [i.e., ]. Higher box heights were also tested, but no significant change was observed. The simulations are run with a time step of , where τ represents the LJ time unit. The temperature is kept constant by a Langevin thermostat with a thermostat coefficient . Each system is simulated 106 or more MD steps at the given temperature. No equation of motion is solved for the surface.
To take into account the unlabeled Fis proteins, the protein chains are added randomly in the simulations box (black chains in Fig. S5). The volume fraction of the proteins is varied between 0 and 10−4 σ−3. For instance, adding one competing protein per binding site (e.g., 100 competing proteins for 100 sites) corresponds to a volume fraction of 2 × 10⁻⁵ σ−3. Note that these concentrations are higher than those in the experiments. This constraint is purely out of computational necessity and is a reflection of the fact that, in the simulations, the overall binding energy is much weaker than in the experiments, thus requiring a larger protein concentration to see an effect. However, the effects of the salt and competing proteins on the unbinding/binding kinetics are captured successfully in the simulations.
Quantification of off rates.
On initiation of the data production simulations, the number of proteins remaining bound to the DNAs, , is monitored as a function of time (Fig. S6). If any bound polymer diffuses out of the spherical volume with radius centered around the binding site, the protein gets tagged as unbound. If a protein returns to the binding site, it does not get tagged as bound. To determine the off rate in both the absence and the presence of free proteins, the survival fraction data are fit by a single exponential (Fig. S6). Unless noted otherwise, all simulation results are averaged over time. Error bars are not shown if they are smaller than the size of the corresponding data point. Visual molecular dynamics (VMD) is used for visualizations (55).
Discussion
Kinetic Survival Fraction Measurements Are Well-Suited for Studying the Molecular Basis of FD.
In this study, we have shown that the TF Fis undergoes FD from single binding sites formed from short DNAs. Previous single-DNA protein competition experiments on Fis showed FD on extended 48.5-kb DNA molecules (13). However, interpretation of these experiments is complicated by the fact that there are multiple binding sites of varying affinity on long DNA molecules, which can lead to nonexponential decays of survival probability (27). Moreover, binding sites that overlap could assist FD (32) or allow for other types of cooperative dissociation events. This possibility initially raised the question of whether FD with Fis requires protein clusters, the action of overlapping binding sites, or whether the competitor acts by sliding along adjacent DNA segments. Because our study uses a single binding site with a single binding strength, our results indicate that FD with Fis does not require long DNAs or cooperative binding effects, and this conclusion is further supported by our observations of single exponential decays (Figs. 1A, 2A, and 3 A and B).
Because we can readily measure slow off rates over a large dynamic range of TF concentrations (Fig. 2), our method of measuring the survival fraction is able to observe FD of very high-affinity TFs ( for Fis–F1 interaction at low [wtFis] in our experiment). We are able to observe saturation of the off rate, which until now, has only been observed in DNA competition experiments (25). In contrast, detection of FD on high-affinity TFs, displaying slow off rates, might be missed using methods that rely on the collection of on/off binding events [e.g., single-molecule Förster resonance energy transfer (smFRET)] because of fluorophore bleaching hampering long observation times and limitations on the concentration of competitor that can be used (high competitor concentrations would lead to intervals between binding events that are shorter than the time resolution). These considerations likely explain why FD of NHP6A was not seen using smFRET in a previous study (37).
Microscopic Picture of FD with Fis.
By fitting our results to an exactly solvable theoretical model including salt effects, we developed a microscopic picture of FD (Fig. 4A). At high wtFis concentration, the off rate saturates at (from fitting with the model, we find ), indicating that the rate-limiting step along the FD pathway is the rate at which a fully bound protein is thermally excited into a partially bound state, thereby exposing the binding site to invasion by a competitor. There is a waiting time of min (given by ) for a bound Fis molecule to become susceptible to invasion, after which the formed ternary complex quickly leads to dissociation. The fact that is large compared with shows that the original TF is more strongly bound in the partially dissociated state (state 1) than in the ternary complex (state 2). The transition from state 1 to state 3 is essential for the model to capture the spontaneous dissociation of Fis at low competitor concentration.
The nearly absent salt dependence of the FD pathway reflects the weak salt dependence of the rate-limiting kinetic step from states (Figs. 3C and 4A) and suggests that few protein–DNA contacts are broken along the pathway leading to a ternary complex. It also indicates that, during FD, the two Fis molecules are within one screening length relative to each other, so that the total number of protein–DNA contacts is approximately conserved by the formation of the ternary complex. Although a rigorous quantitative understanding of the microscopic picture of FD with Fis is limited by our knowledge of the bimolecular on rate , our analytic model qualitatively describes our data remarkably well.
Additionally, we note that DNA near the boundaries of the 27-bp binding site may well be involved in FD, and thus, additional single-molecule studies of slightly shorter or longer DNA oligos or different flanking sequences might be useful in further understanding Fis–F1 FD. It is also unclear the degree to which protein conformational fluctuations play a role in FD. Although relatively unstructured peptides have a plausible mechanism, such as in the case of, for example, polymerase processivity clamp interactions (38), it remains to be understood how fluctuations of more stably folded proteins, such as Fis or NHP6A, allow FD to occur. Intriguingly, there is a hint in the data of a more complex (sigmoidal) shape to the rate-concentration curve (Fig. 2B), which may be indicative of multiple intermediate states along the FD pathway (24). MD simulations may be able to provide some hints of dynamical mechanism (20), although accessing the very long timescales associated with FD of Fis will be extremely challenging, even with a coarse-grained model.
A previous study has described how competitors in solution can accelerate dissociation of molecular complexes by occluding rapid rebinding events and shown accelerated DNA duplex dissociation by this mechanism (39). However, the concentration scale, , for this effect to occur is given by , where is the size of the reaction volume, which in our case, is of the order . This argument would suggest a concentration scale of for FD, but we already see a significant enhancement in off rate at . In addition, for a binder and target that are roughly the same size, inhibition of rebinding typically leads to only an approximately 2-fold effect, because the expected number of rebinding events is of order 1, but we observe a nearly 100-fold effect. Finally, it is hard to explain the observed weak salt dependence of the protein-dependent pathway using this type of model, because the intermediate state involves a fully unbound protein. Taken together, our results argue against a rapid rebinding model and support the formation of a ternary complex as the mechanism underlying the concentration-dependent off rate of Fis. This conclusion is further supported by recent computational studies exploring the energy landscape of Fis binding that show the existence of a Fis–DNA–Fis ternary complex (20) and our simulations showing that FD via a ternary complex mechanism qualitatively recapitulates our experimental observations (Fig. 4C).
Generic Nature of FD.
We expect that FD should occur for any TF–DNA interaction that involves multiple contacts between the TF and DNA as long as the TF–DNA complex can partially unbind and expose the binding site to invasion by competitors. Our observation of FD of a monomeric protein, NHP6A, supports this assertion (Fig. 2C). We also note that we have observed heterotypic FD (Fis-driven dissociation of NHP6A) (Fig. S7) (13), which is indicative of a rather generic mechanism.
Fig. S7.

Heterotypic FD of NHP6A. Survival fraction curve (red) of NHP6Agfp using wtFis as competitor showing that wtFis is able to cause FD of NHP6A. A survival fraction curve of NHP6Agfp with no competitor is reproduced from Fig. 2C for comparison.
FD is unmistakable in experiments like ours and those of others (11–13, 15, 16, 18), which have single-molecule dynamics that are observable at 1-s timescales because of strong protein–DNA interactions ( 100 nM). However, FD is likely a general effect, controlling the unbinding kinetics of proteins with micromolar affinities, and typical single-molecule experiments with time resolutions are unable to observe these submillisecond dynamics. Our MD simulations, which by necessity, use weak binding sites, support this assertion, exhibiting FD at high competitor concentrations. This observation suggests that FD could occur in vivo for typical TFs that bind much more weakly to DNA than Fis. Furthermore, although a high concentration of an individual type of weakly binding TF may not be present in vivo, high concentrations of other proteins can be expected, and it has already been seen that competitor TFs of one type can cause FD of another type (13, 14). Therefore, it is reasonable to expect that FD could be an important mechanism for buffering the effective and assisting in the local exchange of a large class of TFs from chromatin in the nucleus.
Physiological Relevance of FD.
In E. coli, it is observed that Fis is largely replaced by other nucleoid-associated proteins during slow bacterial growth (40). Our observation that competitors accelerate the dissociation of Fis from 1 pM affinity F1 sites suggests that FD plays an important role in this exchange and possibly serves as a mechanism to modulate the occupancy of strong Fis binding sites at high protein concentrations in vivo. Indeed, it has been observed that Fis binding lifetimes on the nucleoid are faster in vivo (where free Fis concentrations are at least several hundred nanomolar) than they are on isolated nucleoids (14, 41), which suggests FD driven by a cytoplasmic concentration of Fis (and other DNA binding proteins) in the few hundred nanomolar range.
Our results suggest that FD could have a profound effect on the dynamics of biological processes that depend on the binding of TFs in vivo. Cellular gene expression profiles and protein concentration levels occurring in complex regulatory networks should be affected by FD through its ability to shorten the residency time of a wide class of TFs that control these networks. FD may also play a role in regulating the dynamics of chromatin structure by facilitating the exchange of TFs with other regulatory proteins, such as histones, nucleosomes, and remodelers from chromatin (6, 8, 42). In particular, FD could be a mechanism for regulating the ability of high-affinity TFs to switch transcription on and off and possibly facilitates TF mobility along the genome. Furthermore, our simulations suggest that FD should accelerate removal of proteins that bind DNA far more weakly than Fis (Fig. 4C) at timescales far shorter than our current single-molecule experiment can access. In conclusion, FD of TFs may be an important general effect to take into account in systems biology simulations that model gene expression in cells.
Materials and Methods
Single-molecule experiments were carried out using Cy3- and biotin-labeled 27-bp dsDNA oligomers, which were attached to the interior of a flow cell via streptavidin and biotin-PEG. Proteins were introduced via flow, including gfp-labeled proteins. The DNAs and gfp-labeled proteins were imaged using total internal reflection fluorescence imaging, which allowed individual DNAs and proteins to be observed. Time series of protein occupation of DNAs were collected and then analyzed to obtain protein binding kinetics. Coarse-grained MD simulations were carried out using a simulation box containing 100 sparsely placed surface-grafted semiflexible DNA chains (binding sites), an equal number of protein (flexible) chains initially bound onto the DNA chains, a prescribed number of initially unbound proteins, counterions for protein and DNA chains, and a prescribed number of monovalent salt ions. The DNA and proteins are modeled by a coarse-grained bead spring model with both short- and long-range electrostatic interactions. Additional details of single-molecule and simulation methods may be found in SI Materials and Methods.
All data, documentation, and code used in analysis will be made available on request to M.O.d.l.C. and J.F.M.
Acknowledgments
Work at Northwestern University was supported by NIH Grants R01-GM105847 and U54-CA193419 (CR-PS-OC), a subcontract to NIH Grant U54-DK107980, and National Science Foundation Grants MCB-1022117, DMR-1611076, and DMR-1206868. Work at the University of California, Los Angeles, was supported by NIH Grant GM038509.
Footnotes
The authors declare no conflict of interest.
This article contains supporting information online at www.pnas.org/lookup/suppl/doi:10.1073/pnas.1701884114/-/DCSupplemental.
References
- 1.Christmann M, Kaina B. Transcriptional regulation of human DNA repair genes following genotoxic stress: Trigger mechanisms, inducible responses and genotoxic adaptation. Nucleic Acids Res. 2013;41:8403–8420. doi: 10.1093/nar/gkt635. [DOI] [PMC free article] [PubMed] [Google Scholar]
- 2.Dominguez-Sola D, et al. Non-transcriptional control of DNA replication by c-Myc. Nature. 2007;448:445–451. doi: 10.1038/nature05953. [DOI] [PubMed] [Google Scholar]
- 3.Ganapathi M, et al. Extensive role of the general regulatory factors, Abf1 and Rap1, in determining genome-wide chromatin structure in budding yeast. Nucleic Acids Res. 2011;39:2032–2044. doi: 10.1093/nar/gkq1161. [DOI] [PMC free article] [PubMed] [Google Scholar]
- 4.Guerra RF, Imperadori L, Mantovani R, Dunlap DD, Finzi L. DNA compaction by the nuclear factor-Y. Biophys J. 2007;93:176–182. doi: 10.1529/biophysj.106.099929. [DOI] [PMC free article] [PubMed] [Google Scholar]
- 5.Ong CT, Corces VG. CTCF: An architectural protein bridging genome topology and function. Nat Rev Genet. 2014;15:234–246. doi: 10.1038/nrg3663. [DOI] [PMC free article] [PubMed] [Google Scholar]
- 6.Ramachandran S, Henikoff S. Transcriptional regulators compete with nucleosomes post-replication. Cell. 2016;165:580–592. doi: 10.1016/j.cell.2016.02.062. [DOI] [PMC free article] [PubMed] [Google Scholar]
- 7.Sanyal A, Lajoie BR, Jain G, Dekker J. The long-range interaction landscape of gene promoters. Nature. 2012;489:109–113. doi: 10.1038/nature11279. [DOI] [PMC free article] [PubMed] [Google Scholar]
- 8.Voss TC, Hager GL. Dynamic regulation of transcriptional states by chromatin and transcription factors. Nat Rev Genet. 2014;15:69–81. doi: 10.1038/nrg3623. [DOI] [PMC free article] [PubMed] [Google Scholar]
- 9.Masse JE, et al. The S. cerevisiae architectural HMGB protein NHP6A complexed with DNA: DNA and protein conformational changes upon binding. J Mol Biol. 2002;323:263–284. doi: 10.1016/s0022-2836(02)00938-5. [DOI] [PubMed] [Google Scholar]
- 10.Alverdi V, Hetrick B, Joseph S, Komives EA. Direct observation of a transient ternary complex during IκBα-mediated dissociation of NF-κB from DNA. Proc Natl Acad Sci USA. 2014;111:225–230. doi: 10.1073/pnas.1318115111. [DOI] [PMC free article] [PubMed] [Google Scholar]
- 11.Chen TY, et al. Concentration- and chromosome-organization-dependent regulator unbinding from DNA for transcription regulation in living cells. Nat Commun. 2015;6:7445. doi: 10.1038/ncomms8445. [DOI] [PMC free article] [PubMed] [Google Scholar]
- 12.Gibb B, et al. Concentration-dependent exchange of replication protein A on single-stranded DNA revealed by single-molecule imaging. PLoS One. 2014;9:e87922. doi: 10.1371/journal.pone.0087922. [DOI] [PMC free article] [PubMed] [Google Scholar]
- 13.Graham JS, Johnson RC, Marko JF. Concentration-dependent exchange accelerates turnover of proteins bound to double-stranded DNA. Nucleic Acids Res. 2011;39:2249–2259. doi: 10.1093/nar/gkq1140. [DOI] [PMC free article] [PubMed] [Google Scholar]
- 14.Hadizadeh N, Johnson RC, Marko JF. Facilitated dissociation of a nucleoid protein from the bacterial chromosome. J Bacteriol. 2016;198:1735–1742. doi: 10.1128/JB.00225-16. [DOI] [PMC free article] [PubMed] [Google Scholar]
- 15.Joshi CP, et al. Direct substitution and assisted dissociation pathways for turning off transcription by a MerR-family metalloregulator. Proc Natl Acad Sci USA. 2012;109:15121–15126. doi: 10.1073/pnas.1208508109. [DOI] [PMC free article] [PubMed] [Google Scholar]
- 16.Kilic S, Bachmann AL, Bryan LC, Fierz B. Multivalency governs HP1α association dynamics with the silent chromatin state. Nat Commun. 2015;6:7313. doi: 10.1038/ncomms8313. [DOI] [PMC free article] [PubMed] [Google Scholar]
- 17.Kunzelmann S, Morris C, Chavda AP, Eccleston JF, Webb MR. Mechanism of interaction between single-stranded DNA binding protein and DNA. Biochemistry. 2010;49:843–852. doi: 10.1021/bi901743k. [DOI] [PMC free article] [PubMed] [Google Scholar]
- 18.Luo Y, North JA, Rose SD, Poirier MG. Nucleosomes accelerate transcription factor dissociation. Nucleic Acids Res. 2014;42:3017–3027. doi: 10.1093/nar/gkt1319. [DOI] [PMC free article] [PubMed] [Google Scholar]
- 19.Potoyan DA, Zheng W, Komives EA, Wolynes PG. Molecular stripping in the NF-κB/IκB/DNA genetic regulatory network. Proc Natl Acad Sci USA. 2016;113:110–115. doi: 10.1073/pnas.1520483112. [DOI] [PMC free article] [PubMed] [Google Scholar]
- 20.Tsai MY, Zhang B, Zheng W, Wolynes PG. Molecular mechanism of facilitated dissociation of Fis protein from DNA. J Am Chem Soc. October 5, 2016 doi: 10.1021/jacs.6b08416. [DOI] [PMC free article] [PubMed] [Google Scholar]
- 21.Stella S, Cascio D, Johnson RC. The shape of the DNA minor groove directs binding by the DNA-bending protein Fis. Genes Dev. 2010;24:814–826. doi: 10.1101/gad.1900610. [DOI] [PMC free article] [PubMed] [Google Scholar]
- 22.Skoko D, et al. Mechanism of chromosome compaction and looping by the Escherichia coli nucleoid protein Fis. J Mol Biol. 2006;364:777–798. doi: 10.1016/j.jmb.2006.09.043. [DOI] [PMC free article] [PubMed] [Google Scholar]
- 23.Åberg C, Duderstadt KE, van Oijen AM. Stability versus exchange: A paradox in DNA replication. Nucleic Acids Res. 2016;44:4846–4854. doi: 10.1093/nar/gkw296. [DOI] [PMC free article] [PubMed] [Google Scholar]
- 24.Cocco S, Marko JF, Monasson R. Stochastic ratchet mechanisms for replacement of proteins bound to DNA. Phys Rev Lett. 2014;112:238101. doi: 10.1103/PhysRevLett.112.238101. [DOI] [PMC free article] [PubMed] [Google Scholar]
- 25.Giuntoli RD, et al. DNA-segment-facilitated dissociation of Fis and NHP6A from DNA detected via single-molecule mechanical response. J Mol Biol. 2015;427:3123–3136. doi: 10.1016/j.jmb.2015.07.015. [DOI] [PMC free article] [PubMed] [Google Scholar]
- 26.Sidorova NY, Scott T, Rau DC. DNA concentration-dependent dissociation of EcoRI: Direct transfer or reaction during hopping. Biophys J. 2013;104:1296–1303. doi: 10.1016/j.bpj.2013.01.041. [DOI] [PMC free article] [PubMed] [Google Scholar]
- 27.Sing CE, Olvera de la Cruz M, Marko JF. Multiple-binding-site mechanism explains concentration-dependent unbinding rates of DNA-binding proteins. Nucleic Acids Res. 2014;42:3783–3791. doi: 10.1093/nar/gkt1327. [DOI] [PMC free article] [PubMed] [Google Scholar]
- 28.Dahlke K, Sing CE. Facilitated dissociation kinetics of dimeric nucleoid-associated proteins follow a universal curve. Biophys J. 2017;112:543–551. doi: 10.1016/j.bpj.2016.11.3198. [DOI] [PMC free article] [PubMed] [Google Scholar]
- 29.Hancock SP, Stella S, Cascio D, Johnson RC. DNA sequence determinants controlling affinity, stability and shape of DNA complexes bound by the nucleoid protein Fis. PLoS One. 2016;11:e0150189. doi: 10.1371/journal.pone.0150189. [DOI] [PMC free article] [PubMed] [Google Scholar]
- 30.Pan CQ, et al. Variable structures of Fis-DNA complexes determined by flanking DNA-protein contacts. J Mol Biol. 1996;264:675–695. doi: 10.1006/jmbi.1996.0669. [DOI] [PubMed] [Google Scholar]
- 31.Marko JF. Biophysics of protein-DNA interactions and chromosome organization. Physica A. 2015;418:126–153. doi: 10.1016/j.physa.2014.07.045. [DOI] [PMC free article] [PubMed] [Google Scholar]
- 32.Chen X, Ji Z, Webber A, Sharrocks AD. Genome-wide binding studies reveal DNA binding specificity mechanisms and functional interplay amongst Forkhead transcription factors. Nucleic Acids Res. 2016;44:1566–1578. doi: 10.1093/nar/gkv1120. [DOI] [PMC free article] [PubMed] [Google Scholar]
- 33.Datta K, LiCata VJ. Salt dependence of DNA binding by Thermus aquaticus and Escherichia coli DNA polymerases. J Biol Chem. 2003;278:5694–5701. doi: 10.1074/jbc.M208133200. [DOI] [PubMed] [Google Scholar]
- 34.Mascotti DP, Lohman TM. Thermodynamic extent of counterion release upon binding oligolysines to single-stranded nucleic acids. Proc Natl Acad Sci USA. 1990;87:3142–3146. doi: 10.1073/pnas.87.8.3142. [DOI] [PMC free article] [PubMed] [Google Scholar]
- 35.Privalov PL, Dragan AI, Crane-Robinson C. Interpreting protein/DNA interactions: Distinguishing specific from non-specific and electrostatic from non-electrostatic components. Nucleic Acids Res. 2011;39:2483–2491. doi: 10.1093/nar/gkq984. [DOI] [PMC free article] [PubMed] [Google Scholar]
- 36.Sing CE, Alexander-Katz A. Force spectroscopy of self-associating homopolymers. Macromolecules. 2012;45:6704–6718. [Google Scholar]
- 37.Coats JE, Lin Y, Rueter E, Maher LJ, 3rd, Rasnik I. Single-molecule FRET analysis of DNA binding and bending by yeast HMGB protein Nhp6A. Nucleic Acids Res. 2013;41:1372–1381. doi: 10.1093/nar/gks1208. [DOI] [PMC free article] [PubMed] [Google Scholar]
- 38.Kath JE, et al. Exchange between Escherichia coli polymerases II and III on a processivity clamp. Nucleic Acids Res. 2016;44:1681–1690. doi: 10.1093/nar/gkv1375. [DOI] [PMC free article] [PubMed] [Google Scholar]
- 39.Paramanathan T, Reeves D, Friedman LJ, Kondev J, Gelles J. A general mechanism for competitor-induced dissociation of molecular complexes. Nat Commun. 2014;5:5207. doi: 10.1038/ncomms6207. [DOI] [PMC free article] [PubMed] [Google Scholar]
- 40.Ishihama A, et al. Intracellular concentrations of 65 species of transcription factors with known regulatory functions in Escherichia coli. J Bacteriol. 2014;196:2718–2727. doi: 10.1128/JB.01579-14. [DOI] [PMC free article] [PubMed] [Google Scholar]
- 41.Hadizadeh Yazdi N, Guet CC, Johnson RC, Marko JF. Variation of the folding and dynamics of the Escherichia coli chromosome with growth conditions. Mol Microbiol. 2012;86:1318–1333. doi: 10.1111/mmi.12071. [DOI] [PMC free article] [PubMed] [Google Scholar]
- 42.Misteli T, Gunjan A, Hock R, Bustin M, Brown DT. Dynamic binding of histone H1 to chromatin in living cells. Nature. 2000;408:877–881. doi: 10.1038/35048610. [DOI] [PubMed] [Google Scholar]
- 43.Skoko D, Wong B, Johnson RC, Marko JF. Micromechanical analysis of the binding of DNA-bending proteins HMGB1, NHP6A, and HU reveals their ability to form highly stable DNA-protein complexes. Biochemistry. 2004;43:13867–13874. doi: 10.1021/bi048428o. [DOI] [PubMed] [Google Scholar]
- 44.Yen YM, Roberts PM, Johnson RC. Nuclear localization of the Saccharomyces cerevisiae HMG protein NHP6A occurs by a Ran-independent nonclassical pathway. Traffic. 2001;2:449–464. doi: 10.1034/j.1600-0854.2001.20703.x. [DOI] [PubMed] [Google Scholar]
- 45.Joo C, Ha T. Preparing sample chambers for single-molecule FRET. Cold Spring Harb Protoc. 2012;2012:1104–1108. doi: 10.1101/pdb.prot071530. [DOI] [PubMed] [Google Scholar]
- 46.Swoboda M, et al. Enzymatic oxygen scavenging for photostability without pH drop in single-molecule experiments. ACS Nano. 2012;6:6364–6369. doi: 10.1021/nn301895c. [DOI] [PMC free article] [PubMed] [Google Scholar]
- 47.Chandrasekhar S. Stochastic problems in physics and astronomy. Rev Mod Phys. 1943;15:1–89. [Google Scholar]
- 48.Ninio J. Alternative to the steady-state method: Derivation of reaction rates from first-passage times and pathway probabilities. Proc Natl Acad Sci USA. 1987;84:663–667. doi: 10.1073/pnas.84.3.663. [DOI] [PMC free article] [PubMed] [Google Scholar]
- 49.Press WH. Numerical Recipes in C: The Art of Scientific Computing. Cambridge Univ Press; Cambridge, UK: 1988. [Google Scholar]
- 50.Kremer K, Grest GS. Dynamics of entangled linear polymer melts: A molecular‐dynamics simulation. J Chem Phys. 1990;92:5057–5086. [Google Scholar]
- 51.Plimpton S, Pollock R, Stevens M. Proceedings of the Eighth SIAM Conference on Parallel Processing for Scientific Computing. Society for Industrial and Applied Mathematics; Minneapolis: 1997. Particle-mesh ewald and rRESPA for parallel molecular dynamics simulations. [Google Scholar]
- 52.Liu S, Muthukumar M. Langevin dynamics simulation of counterion distribution around isolated flexible polyelectrolyte chains. J Chem Phys. 2002;116:9975–9982. [Google Scholar]
- 53.Stevens MJ. Simple simulations of DNA condensation. Biophys J. 2001;80:130–139. doi: 10.1016/S0006-3495(01)76000-6. [DOI] [PMC free article] [PubMed] [Google Scholar]
- 54.Plimpton S. Fast parallel algorithms for short-range molecular dynamics. J Comput Phys. 1995;117:1–19. [Google Scholar]
- 55.Humphrey W, Dalke A, Schulten K. VMD: Visual molecular dynamics. J Mol Graph. 1996;14:33–38. doi: 10.1016/0263-7855(96)00018-5. [DOI] [PubMed] [Google Scholar]
- 56.Alberty RA, Hammes GG. Application of the theory of diffusion-controlled reactions to enzyme kinetics. J Phys Chem. 1958;62:154–159. [Google Scholar]