Significance
During high-frequency firing, the shape of a presynaptic action potential (AP) can alter, thereby changing neurotransmitter release. In this paper, we describe how a giant terminal in the brainstem of newborn rats called the calyx of Held can fire in vivo at high frequencies without substantial AP depression. The underlying mechanism was found to be the presence of sodium channels that can recover rapidly from depression in combination with a close match between the potential that is attained following an AP with the potential that maximizes AP stability. Surprisingly, this match was already there shortly after formation of the calyx of Held. We speculate that these mechanisms help synapses to maximize timing precision during high-frequency firing.
Keywords: afterpotential, AP modulation, sodium channel inactivation, MNTB, synapse development
Abstract
The shape of the presynaptic action potential (AP) has a strong impact on neurotransmitter release. Because of the small size of most terminals in the central nervous system, little is known about the regulation of their AP shape during natural firing patterns in vivo. The calyx of Held is a giant axosomatic terminal in the auditory brainstem, whose biophysical properties have been well studied in slices. Here, we made whole-cell recordings from calyceal terminals in newborn rat pups. The calyx showed a characteristic burst firing pattern, which has previously been shown to originate from the cochlea. Surprisingly, even for frequencies over 200 Hz, the AP showed little or no depression. Current injections showed that the rate of rise of the AP depended strongly on its onset potential, and that the membrane potential after the AP (Vafter) was close to the value at which no depression would occur during high-frequency activity. Immunolabeling revealed that Nav1.6 is already present at the calyx shortly after its formation, which was in line with the fast recovery from AP depression that we observed in slice recordings. Our findings thus indicate that fast recovery from depression and an inter-AP membrane potential that minimizes changes on the next AP in vivo, together enable high timing precision of the calyx of Held already shortly after its formation.
Action potentials (APs) are followed by a period of decreased excitability called the refractory period. High-frequency firing thus requires special adaptations to minimize this refractory period and maintain AP stability. The changes in the AP waveform that occur at high firing frequencies are especially relevant in presynaptic terminals, where the shape of the AP critically controls calcium influx via voltage-dependent calcium channels, and thus transmitter release (1, 2). Following the AP, the membrane potential during the recovery period has a large influence on the speed of the recovery from inactivation of voltage-dependent sodium channels and deactivation of voltage-dependent potassium channels, which are two major determinants of the refractory period (2). In some terminals, the AP is followed by a depolarizing afterpotential (DAP) (3–9), whereas in others a hyperpolarizing afterpotential (HAP) has been observed (10–14). The sign of this afterpotential depends on the resting potential (6, 7, 15), suggesting that the membrane potential following the AP (Vafter) might be more important than the sign of the afterpotential.
The calyx of Held is a glutamatergic axosomatic terminal whose biophysical properties have been well studied (16). Its many release sites enable it to act as an inverting relay synapse within the auditory brainstem that reliably drives its postsynaptic partner, a principal neuron in the medial nucleus of the trapezoid body (MNTB), even at firing frequencies >200 Hz (17). Shortly after its formation, around postnatal day 2 (P2) in rodents (18–20), it already fires in characteristic high-frequency bursts in vivo (21, 22). In slice studies, a large DAP has been observed (3), to which resurgent sodium currents (23) make a prominent contribution, and which may promote high-frequency firing (15). With the exception of cerebellar mossy fiber terminals (4, 8), studies on the biophysical properties of mammalian presynaptic terminals have been performed ex vivo, and the functional significance of afterpotentials, including their role during natural firing patterns, is currently largely unknown. Here, we make in vivo juxtacellular and whole-cell recordings from the calyx of Held in rat pups, and study how the afterpotentials contribute to the stability of presynaptic APs during natural firing patterns.
Results
Identification of in Vivo Calyces.
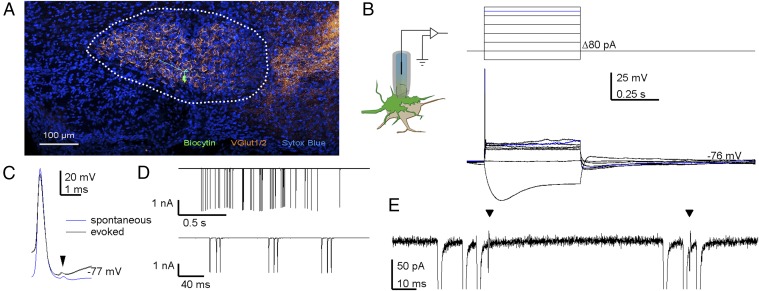
To study the contribution of AP depression during physiological firing, we made blind juxtacellular and whole-cell recordings from the calyx of Held in 2- to 8-d-old rat pups. Several converging lines of evidence indicated that we indeed recorded from the calyx of Held, a giant terminal in the auditory brainstem. First, the identity of several calyces was confirmed by biocytin filling and subsequent histological processing (Fig. 1A; n = 6), revealing the typical cup shape of the calyx (Movie S1) and an axon that could often be traced back to the midline and to other auditory nuclei ipsilateral of the MNTB. Second, in agreement with previous calyceal recordings in slices (3, 24), terminals responded to constant-current injections with a single, brief, and overshooting AP at the start of the current injection, strong outward rectification, and a hyperpolarization-activated, depolarizing voltage sag (Fig. 1B and Fig. S1). Third, in some recordings, the calyceal AP was followed by a small deflection that likely reflects the postsynaptic AP (arrow in Fig. 1C). Fourth, the terminals showed a characteristic firing pattern, consisting of minibursts with high firing frequencies (Fig. 1D) (22, 25, 26). Its interval distribution resembled auditory nerve activity at this age (Fig. S2), which is in agreement with its generation by the cochlea (25). In contrast to in vivo postsynaptic recordings (22), no fast synaptic transients were observed in voltage-clamp mode (Fig. 1E), which is consistent with the absence of axo-axonal inputs. Therefore, the structures that we recorded from are highly likely to be calyces.
Fig. 1.
Establishing in vivo recordings from the calyx of Held. (A) Coronal section of the P6 rat ventral brainstem containing the MNTB (outlined) labeled with anti-biocytin (green), anti-vesicular glutamate transporter 1 and 2 (orange), and the nucleotide stain Sytox Blue. The midline is located to the Left, and the ventral side to the Bottom. (B) In vivo whole-cell recording from a calyx (Left); upon constant-current injections (Top), the terminal showed a depolarizing sag, strong outward rectification, and a single AP (Bottom). Blue trace indicates the current threshold for eliciting an AP. Series resistance was compensated off-line. (C) In some recordings, evoked and spontaneous APs were followed by a postspike (arrow head), indicating a postsynaptic AP analogous to the prespike that can be recorded in postsynaptic recordings (24). (D) In voltage-clamp recordings, periods of spontaneous activity could be recorded (Top), which were composed of minibursts (Bottom). The ∼2-Hz oscillation in the current amplitudes in the top recordings was induced by breathing. (E) Expansion of D illustrates two postspikes (arrowheads), and a lack of synaptic currents. For D and E, command potential was −80 mV; series resistance (36 MΩ) remained uncompensated.
Fig. S1.
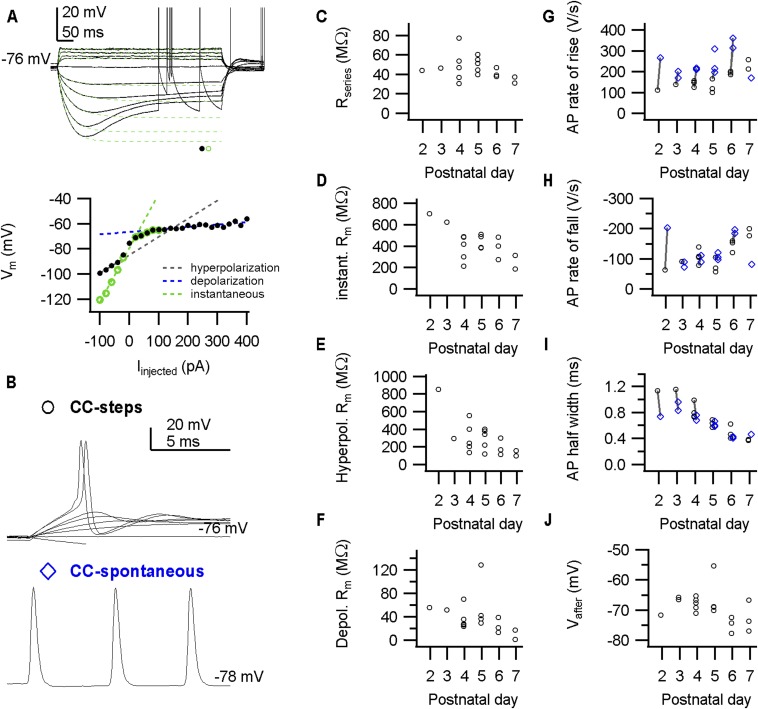
Developmental changes in active and passive properties of calyces during whole-cell in vivo recordings. (A, Top) Example traces of constant-current injections depict a voltage sag and outward rectification. Traces were fitted with a double-exponential function (green dotted lines). (Bottom) Steady-states values of the fit (green circles) or the recording (black circles) were obtained at the end of the current injections, and are plotted against the current amplitude. Slope resistances (broken lines) were obtained from line fits. (B) Examples of spontaneous APs (Bottom) and APs elicited by constant-current injections (Top). (C) Series resistances against pup age. Series resistance was calculated from VC recordings (not shown) as described in ref. 22. (D) Instantaneous slope resistance (green broken line in A) against pup age. (E) Slope resistance calculated from hyperpolarizing current injections (black broken line in A) against pup age. (F) Slope resistances calculated from depolarizing current injections (blue broken line in A) against pup age. The outward rectification extensively lowers the slope resistance. (G) AP maximal rate of rise of evoked (black circles) and spontaneous APs (blue diamonds) against pup age (labels in B). (H) AP maximal repolarization/rate of fall of evoked (black circles) and spontaneous APs (blue diamonds) against pup age. (I) AP half-width of evoked (black circles) and spontaneous APs (blue diamonds) against pup age. (J) Vafter of spontaneous APs against pup age. Data points indicate calyces. The lines in G–I connect spontaneous APs (blue diamonds) with evoked APs (black circles) recorded from the same calyx.
Fig. S2.
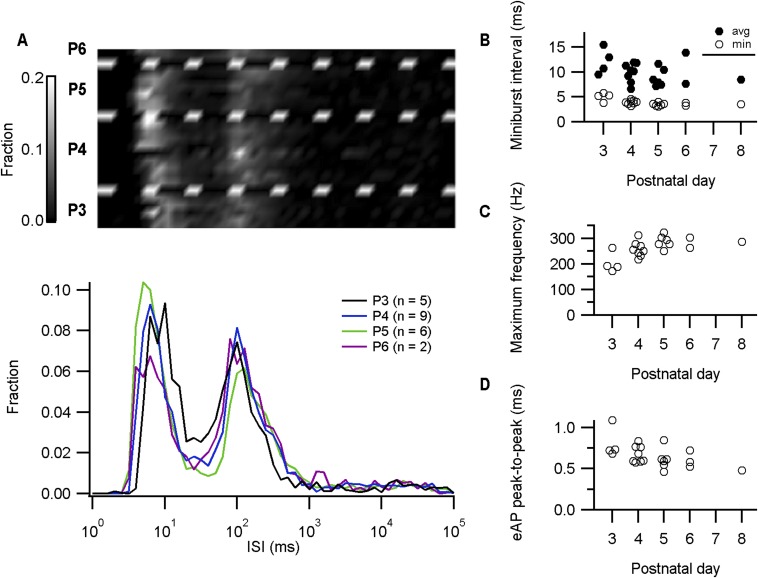
Preferred frequencies of spontaneous firing in in vivo juxtacellular recordings from the calyx of Held. (A) Upper panel shows probability density plots in grayscale for individual juxtacellular recordings grouped by pup age. Lower panel displays the average probability density against the interspike interval (ISI) for the different pup ages on a semilogarithmic plot. (B) The average and minimal miniburst interval (i.e., intervals < 40 ms) against pup age. (C) The maximum instantaneous frequency against pup age. (D) The AP half-width, estimated as eAP peak-to-peak interval, against pup age. For B–D, circles represent individual juxtacellularly recorded calyces.
In the first neonatal days, the terminal assumes a cup shape (18, 19, 27). Accompanying this structural development, a number of developmental changes in its biophysical properties occur (28, 29), including a developmental decrease in resting membrane resistance and a substantial increase in the outward rectification, a developmental trend for an increase in the maximal rate of rise, an increase in the rate of repolarization, and a clear shortening of the AP half-width (Fig. S1). APs elicited by brief current injections showed similar developmental changes. These developmental changes accelerated the terminal’s AP, allowing firing at shorter intervals. Surprisingly, even P2–P3 calyces fired spontaneously over 150 Hz without apparent failures (n = 3, 4 calyces in whole-cell, juxtacellular mode, respectively), indicating that its ability to fire at high frequencies is already present shortly after its formation.
Resistance to Depression in Vivo.
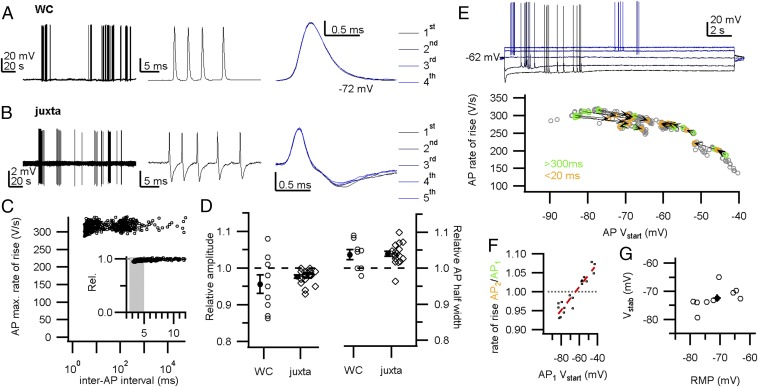
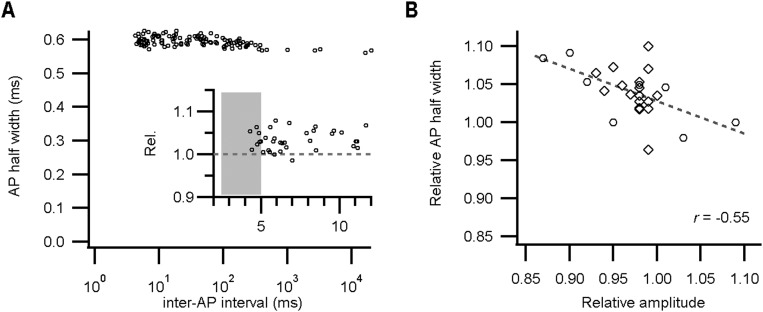
During high-frequency firing, the shape of the presynaptic AP remained remarkably constant in both whole-cell and juxtacellular recordings (Fig. 2 A and B). Fig. 2C shows the maximal rate of rise of the AP as a function of the inter-AP interval in a representative whole-cell recording. Whereas the postsynaptic somatic AP typically depresses >40% at the shortest intervals in vivo (22, 26, 30), the calyceal AP depressed on average only 4% for intervals <5 ms in whole-cell recordings (0.96 ± 0.03; mean ± SEM; n = 9 calyces; Fig. 2 C and D). Similar values were obtained for juxtacellular recordings (0.977 ± 0.004; mean ± SEM; n = 18 calyces; Fig. 2D), suggesting that this finding was not a consequence of washout, nor the result of Rs-related capacitive filtering. Moreover, within a miniburst, the maximal rate of rise of the third AP was similar to the first AP (time interval: 21 ± 2 ms; ratio AP3/AP1: 1.02 ± 0.01; mean ± SEM; n = 9 calyces), showing remarkable stability considering the high firing frequencies and the young age of the animals. In addition, following high-frequency bursting, the half-width, defined as the AP width at −35 mV, increased by only 4 ± 1% (mean ± SEM; n = 9; Fig. 2D and Fig. S3). In juxtacellular recordings, the AP half-width is best represented by the delay between the positive and negative peak (see figure 3F in ref. 30), and, similarly, in juxtacellular mode this delay increased by 4.0 ± 0.7% (mean ± SEM; n = 18; Fig. 2D). The change in half-width correlated with the AP depression (r = −0.55; n = 27; Fig. S3). We conclude that the shape of the presynaptic AP hardly changed during high-frequency activity.
Fig. 2.
Little AP depression during in vivo firing. (A, Left) In vivo whole-cell recording (WC) shows periods of calyceal bursting activity. (Middle) High-frequency miniburst. (Right) Overlay of the four APs. (B) In vivo juxtacellular recording (juxta) shows similar activity as in A, and an overlay of the five extracellular APs (eAPs) is shown (Right). (C) The maximal rate of rise against the inter-AP interval from a single whole-cell recording. (Inset) The maximal rate of rise relative to the preceding AP against the inter-AP interval shows a small but clear depression at short intervals. An average was calculated for the intervals within the gray area to compare between recordings. (D, Left) The relative amplitude at intervals below 5 ms shows a small depression. For WC, the relative change in AP rate of rise is shown; for juxta, the relative change in eAP amplitude. (Right) Changes in AP half-width for intervals <5 ms. (E, Top) Twenty seconds of constant-current injection with spontaneous burst firing. Constant-current injection started at −120 pA (lowest trace), incrementing 60 pA (indicated in blue shades). (Bottom) AP maximal rate of rise against the onset potential. Orange–green connected circle pairs correspond to a pair of APs of which the first AP (AP1) was not preceded by an AP within 300 ms (green) and the second AP (AP2) followed AP1 within 20 ms (orange). (F) The relative rate of rise of the second AP in E against the onset potential of AP1. Red broken line shows linear fit. Intersection with the black broken line where AP2/AP1 equals 1 was at −64.9 mV. (G) The stability potential (Vstab) vs. the resting membrane potential (RMP). The linear correlation was not significant [r = 0.5; F(1,7) = 2.8; P = 0.14]. Circles in C and E indicate APs. Open markers in D and G indicate recorded calyces; closed markers correspond to averages. Circles in F indicate AP pairs. Bars indicate SEM.
Fig. S3.
AP half-width modulation during high-frequency firing is minimal. (A) The AP half-width against the inter-AP interval in a whole-cell recording from a P5 calyx. (Inset) The AP half-width relative to the preceding AP against the inter-AP interval. (B) The relative size of the AP half-width against either the amplitude of juxtacellular eAPs (diamonds) or the rate of rise of whole-cell APs (circles). The line indicates the regression line [r = −0.55; t(23) = 2.9; P = 0.004].
We next investigated which mechanisms were responsible for the remarkable stability of the presynaptic AP shape. At short intervals, the membrane potential following the AP, Vafter, will determine the onset potential of the next AP. To see how Vafter affected the rate of rise of the next AP, we compared consecutive AP pairs during long depolarizing or hyperpolarizing current injections. Interestingly, if the calyceal membrane potential was hyperpolarized, the second AP would start at a more depolarized potential than the first and be relatively depressed; conversely, if the first AP started at a depolarized potential, the second AP would start at a more hyperpolarized potential and be potentiated compared with the first AP (Fig. 2E). To find the potential at which the depression reversed to potentiation, the relative change in the rate of rise of the second AP was plotted against the onset potential of the first AP (Fig. 2F). The potential at which the AP size was stable was obtained by linear regression. This stability potential Vstab was close to the resting membrane potential (RMP) (Fig. 2G), indicating that when Vafter is close to the RMP, the AP shows minimal change in its rate of rise during high-frequency firing. We could not determine a Vstab for the AP half-width, as the half-width modulation did not change linearly with the onset potential, possibly due to inactivation of other voltage-dependent ion channels. Nevertheless, the half-width modulation fell within a limited range (0.95–1.05). We therefore conclude from our in vivo measurements that, if the membrane potential between APs is close to the RMP, the AP waveform remains stable during high-frequency firing.
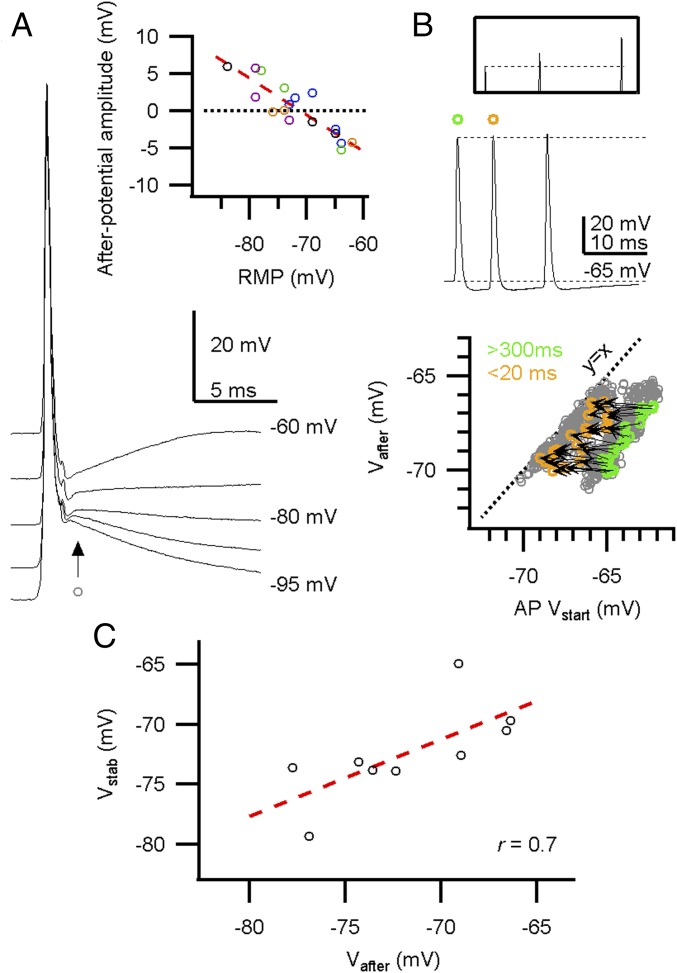
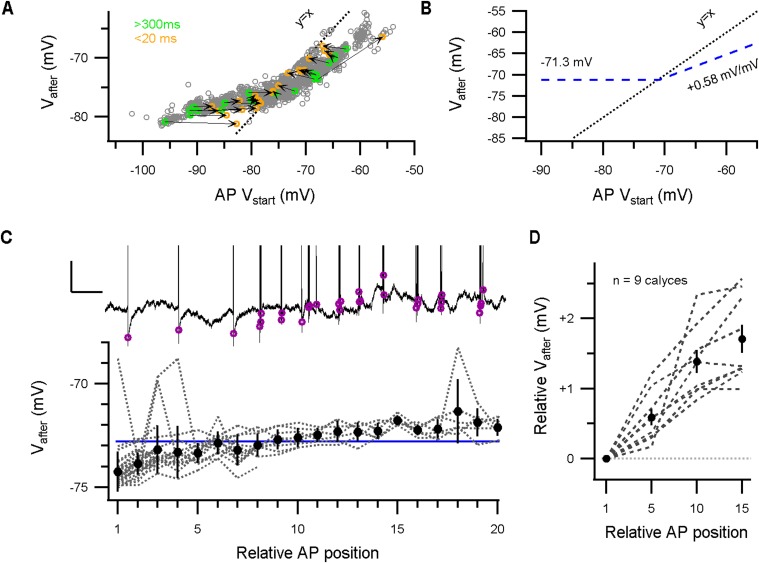
In slice studies, the calyceal AP is typically followed by a 3- to 12-mV DAP (3, 15), yet in vivo we observed in 7 out of 17 recordings a HAP (Fig. 3A, Inset). The afterpotential did not change during development (r = −0.1; n = 17 calyces); it did depend on the RMP, with the direction of the afterpotential reversing at −71.3 ± 0.8 mV (r = −0.88; n = 17 calyces; Fig. 3A). To analyze how Vafter changes when the AP started at different membrane potentials, we again looked at the long constant-current injections. Vafter, measured 1.8 ms after the AP peak, seemed to be largely independent of the onset potential of the AP in all recordings in which the AP started from −75 mV or more negative potentials (Fig. 3A), whereas at potentials more positive than −70 mV, Vafter depolarized with a +0.58 ± 0.03 mV per mV change in the AP onset potential (mean ± SEM; n = 5 calyces; Fig. S4). Instead of focusing on the difference between the membrane potential before and after the AP (3, 15), we will focus on the absolute value of the membrane potential after the AP (Vafter), which is more important for the impact on the next AP.
Fig. 3.
During in vivo high-frequency firing, the membrane potential between APs is close to the potential at which APs are stable. (A) Five spontaneous, peak-aligned APs with different onset potentials due to constant-current injection. The afterpotential was measured at 1.8 ms (arrow) after the AP peak. (Inset) The afterpotential amplitude against the resting membrane potential (RMP). Circle color indicates pup age; black, blue, green, magenta, and orange are <P4, P4, P5, P6, >P6, respectively. (B, Top) A high-frequency burst with a HAP, and a potentiated AP amplitude (Inset). (Bottom) Vafter against the onset potential (Vstart). Gray circle is an AP; green–orange paired circles correspond to a pair of consecutive APs of which the first AP was not preceded by an AP within 300 ms (green), which was followed by a second AP within 20 ms (orange). The arrow represents the change in Vafter–Vstart for each pair. (C) The stability potential Vstab against the afterpotential Vafter. Broken line depicts linear fit [r = 0.7; F(1,7) = 6.6; P = 0.04]. The correlation suggests that Vafter and Vstab are matched. For A and C, each circle corresponds to a different calyx.
Fig. S4.
Vafter changes with constant-current injection and during bursting activity. (A) Vafter against the onset potential of spontaneous APs during long-lasting constant-current injections. Green–orange circle pairs correspond to pairs of APs of which the first AP (green) was not preceded by an AP within 300 ms and the second AP (orange) followed the first one within 20 ms. Dotted line depicts identity line. Vafter dominates the onset potential of subsequent APs during high-frequency firing. (B) Model graph of the relation between the AP onset potential and Vafter. For hyperpolarized onset potentials, Vafter will reach a constant membrane potential (here, −71.3 mV). At depolarized potentials, the afterpotential depolarizes with +0.58 mV/mV, possibly due to inactivation of potassium channels like Kv1 that counteract the depolarization (Fig. S5). (C) Upper panel displays an example of an active period where the afterpotential (magenta circles) depolarized during the burst. (Calibration bar: 2 mV, 0.2 s.) Lower panel, Afterpotential against the relative AP position in active periods of a single P6 recording. The blue line indicates the RMP. During activity, the afterpotential depolarized, and thereby switched from a HAP to a DAP. (D) The relative changes in afterpotential during an active period against the relative AP position across recordings.
During burst activity, Vafter becomes the onset potential of the next AP, which may thus keep onset potentials during a burst stable (7). Indeed, at high firing frequencies, the onset potential of an AP overlapped with Vafter of its predecessor (Fig. 3B), and when the afterpotential was hyperpolarizing, the next AP could be potentiated (Fig. 3B). Furthermore, Vafter was close to Vstab (Fig. 3C). During a period of increased activity, Vafter became more depolarized, and the afterpotential could switch from hyperpolarizing to depolarizing (Fig. S4). On average, the afterpotential depolarized with 1.7 ± 0.2 mV during an active period [mean ± SEM; n = 9 calyces; paired t test AP1 vs. AP15: t(8) = 8.5, P < 0.01], and although this change was statistically significant, such a small depolarization of the onset potential would only minimally change the AP properties (Fig. 2E). Considering the small size of the changes in the afterpotential during an active period, we conclude that Vafter provides a stable AP onset potential at a value that keeps the AP waveform invariant.
Resistance to Depression in Slices.
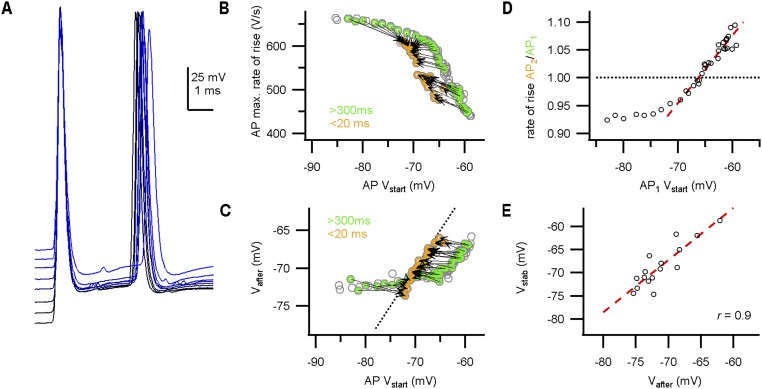
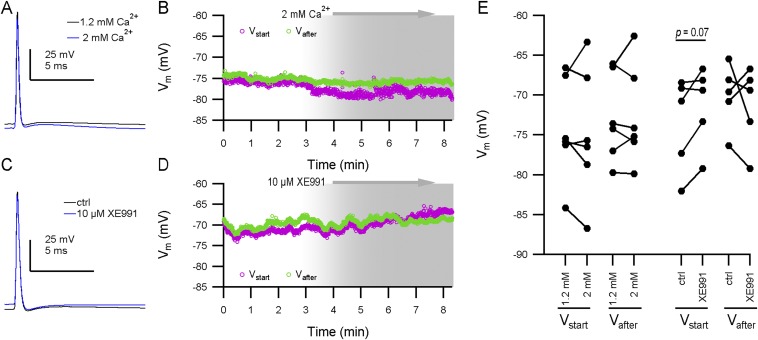
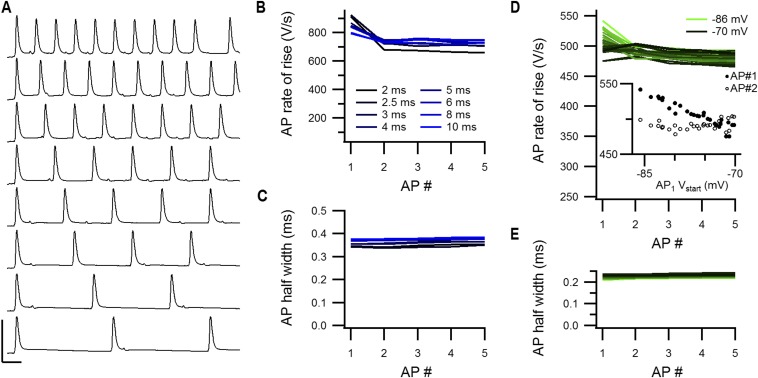
Two limitations of our in vivo recordings were the low-pass filtering related to the high series resistance and the inability to systematically test different afferent activity patterns. We therefore also made calyceal recordings in acute brainstem slices. Afferent fibers were stimulated via a bipolar stimulation electrode placed at the midline. With this approach, we tested whether depression would be more extensive at frequencies exceeding the frequencies observed in vivo (>400 Hz). At physiological temperatures, the calyx was able to fire at these frequencies (31), and the AP rate of rise depressed to 0.88 ± 0.02 at 2- to 3-ms intervals (mean ± SEM; n = 17; age, P4–P9). In 16 out of 17 terminals, we could determine both Vstab (−70 ± 1 mV; mean ± SEM) and Vafter (−71 ± 1 mV; mean ± SEM). The two were again matched closely (r = 0.9; Fig. S5). Vafter did not change in 2 mM calcium [n = 6; ΔV = 0.3 ± 0.8, t(5) = 0.9, P = 0.8; Fig. S6], suggesting a limited role for calcium channels or calcium-activated channels in setting Vafter (32). In addition, no effect of XE991 (10 μM) on the afterpotential was found [n = 5; ΔV = −0.6 ± 0.7, t(5) = 0.1, P = 0.5; Fig. S6], suggesting that Kv7 channels did not significantly contribute to the first milliseconds of the afterpotential (32). Last, we quantified the stability of the AP shape during AP trains with different inter-AP intervals (2–100 ms). The waveform of the first AP differed from the other APs in the train (Fig. S7). The first AP was sensitive to the current injections (r = −0.95), whereas the second to fifth AP did not change (range of r = −0.4–0.2; Fig. S7), again indicating that the afterpotential stabilizes the calyceal AP shape.
Fig. S5.
The AP stability potential Vstab correlated with Vafter in slice recordings. (A) During constant-current injections, the calyceal axon was stimulated at the midline to elicit a doublet with 3-ms interval. APs from a P5 calyx are aligned on the peak of the first AP. Stimulus artifacts are subtracted. (B) AP maximal rate of rise against the onset potential. Doublets are indicated in green–orange circles and connected by an arrow. The arrows reverse direction, suggestive of a stability potential. Additionally, notice the steady-state depression of the AP as a result of the changed onset potentials. (C) Relation between Vafter and onset potential. Vafter is relatively constant for onset membrane potentials less than −70 mV. Broken line is the identity line. (D) The relative AP rate of rise of the doublets against the onset potential of the first AP. Red broken line indicates linear fit of data points close to 1. (E) Relation between Vstab and Vafter. Red broken line indicates regression line (r = 0.9).
Fig. S6.
The afterpotential is independent of calcium concentration or Kv7 channels. (A) Average of 25 APs of a P8 calyx is shown recorded with an extracellular calcium concentration of 1.2 mM (standard concentration; black) or 2 mM (blue). (B) The starting potential (Vstart; magenta) and Vafter (green) during an experiment where the extracellular medium was replaced with 2 mM Ca2+ extracellular medium. At around t = 3 min, the new medium entered the bath. Shaded area depicts the expected period where the calyx becomes exposed to the new extracellular medium. Every circle represents a single AP. APs shown in A are from the same recording. (C) Average of 25 APs of a P5 calyx is shown recorded before (“ctrl”) and after the addition of 10 µM XE991. (D) Similar to B, but for Kv7-blocker XE991. APs shown in B belong to the same experiment. (E) Summary scatter plots for the different pharmacological experiments. Connected circles are from a single recording. No significant effect of higher extracellular calcium concentration was observed on either Vstart or Vafter. XE991 did not significantly affect Vafter, but a trend for a depolarization in the Vstart was observed [ΔV = 2.2 ± 0.9; t(5) = 1.7, P = 0.07], as reported by ref. 38.
Fig. S7.
High-frequency trains remain stable after the first AP. (A) Example trains elicited at different intervals by midline electrical stimulation in a P7 slice. AP properties are shown in B and C. Stimulus artifact is subtracted. (Calibration bar: 100 mV, 2 ms.) (B) AP rate of rise against the AP order number in the train. Only from the first to the second AP a clear change is observed. (C) AP half-width against the AP order number in the train. (D) AP rate of rise against the AP order number of a P6 calyx during constant-current injections to bias the onset potential. The onset potential of the first AP is color-coded. The Inset shows the AP rate of rise against the onset potential of AP #1. The closed circles are of the first AP in the AP train (AP #1), and the open circles are the second AP in the AP train (AP #2). Whereas the rate of rise of AP #1 was strongly correlated with the biased onset potential (r = −0.95), the AP #2 was not (r = 0.2). (E) Same as in D, but for the AP half-width.
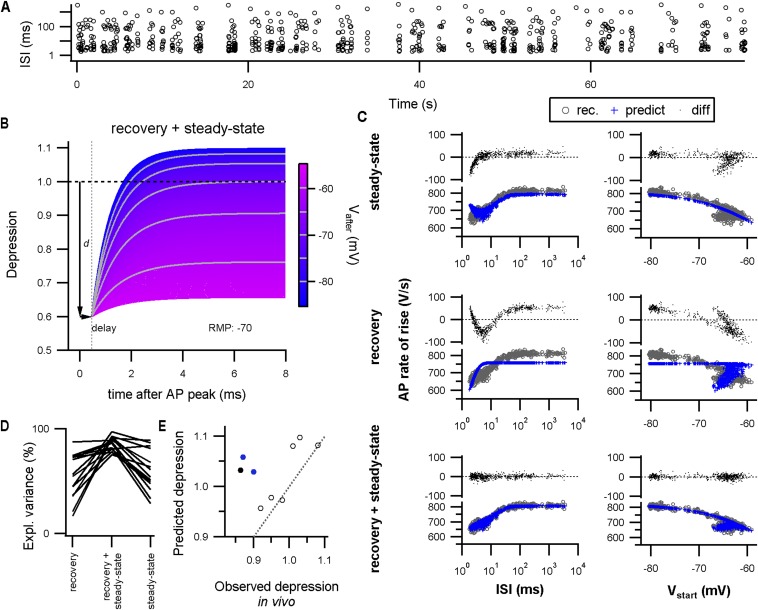
During burst activity, the afterpotential affects AP depression by the time dependency of recovery from inactivation and the steady-state channel availability for the next AP. To disentangle the two effects, we modeled the AP depression (SI Materials and Methods). First, we measured the steady-state depression as a function of the onset potentials by means of current injections. These recordings indicated that the AP is slightly depressed at RMP (Vhalf: −54.8 ± 2.6 mV; k: 7.0 ± 0.9 mV; n = 14; mean ± SEM). Then, we used the steady-state depression to predict the depression induced by a stimulation train that was composed of multiple intervals representing in vivo-like activity with additional 2- to 3-ms intervals (Fig. S8A). The steady-state values did not capture the depression at the shortest intervals (one free parameter, explained variance: 60 ± 5%; n = 14; mean ± SEM; Fig. S8C). Adding recovery from depression, which included a voltage-dependent time constant as described in ref. 33, improved the prediction (two free parameters, explained variance: 86 ± 2%; n = 14; mean ± SEM; Fig. S8D), suggesting that steady-state recovery was not attained at the briefest interspike intervals. To reach 96% and 98% recovery from depression to the steady state associated with the onset potential of the next AP took 2.8 ± 0.2 and 3.5 ± 0.2 ms, respectively (mean ± SEM; n = 14; Fig. S8B), indicating that the intervals observed in vivo are sufficiently long for recovery to reach a steady state. Last, we tested to what extent the model with the average values could predict the depression in vivo by using the intervals and onset potentials observed in each experiment. The predicted depression matched the observed depression well for animals >P4 (n = 6; r = 0.9), whereas for P3–P4 the model underestimated the in vivo depression (−0.16 ± 0.2; n = 3; mean ± SEM; Fig. S8E). Together, these findings indicate that at P5 the rapid recovery from depression allows the calyx to fire at high frequencies with little or no AP depression.
Fig. S8.
Combining in vivo-like activity patterns with modeling to analyze the impact of the afterpotential on AP depression. (A) Stimulus pattern composed of a range of frequencies with random order. This pattern was used for stimulation of the afferent axon of the calyx of Held to elicit AP firing at a wide range of different frequencies. (B) Expected relative depression following an AP as a function of Vafter (color). For the plot, it was assumed that there was no residual depression of previous APs and that the resting membrane potential (RMP) was −70 mV. The AP causes a depression (d). Recovery from depression starts after a delay, which was 0.45 ms in this case, as the AP first needs to repolarize. Both the time constant for recovery as well as the steady-state depression depend on Vafter (SI Materials and Methods). Note that, if the afterpotential is close to RMP, the recovery is complete in 5 ms. Moreover, a HAP will speed up the recovery and could even reverse the relative depression to a relative potentiation, as was indeed observed in vivo. (C) The recorded AP rate of rise was fitted by the full AP depression model (recovery plus steady state) or its reduced forms (steady state or recovery alone; SI Materials and Methods). The results for a single recording fitted by the different models are shown. The Left panels show the AP rate of rise against the interspike interval (recorded, gray circle; model prediction, blue cross), and the differences between recorded and predicted AP rate of rise are shown on Top (black dots). In the Right panels, the relation between the AP rate of rise and the starting potential (Vstart) of the same dataset is shown. The model that only includes the recovery from depression (explained variance: 45%) shows a bias in the residuals against Vstart. On the other hand, the model that only includes the steady states (explained variance, 87%) shows a bias in the residuals at the briefest interspike intervals. The combined model describes the data well (explained variance, 97%). (D) The explained variance by the different, nested models, showing that both the steady states as well as the recovery from depression significantly contributed to the model. (E) Based on the average model fit parameters, the interspike intervals recorded in vivo, and the onset potentials recorded in vivo, the amount of depression was predicted and averaged for intervals (<5 ms). The predicted depression against the observed depression in vivo is shown. Dotted line is identity line. Open circles indicate >P4; closed, black circle indicates P3; closed, blue circles indicate P4.
Presence of Nav1.6 in Calyx Terminals.
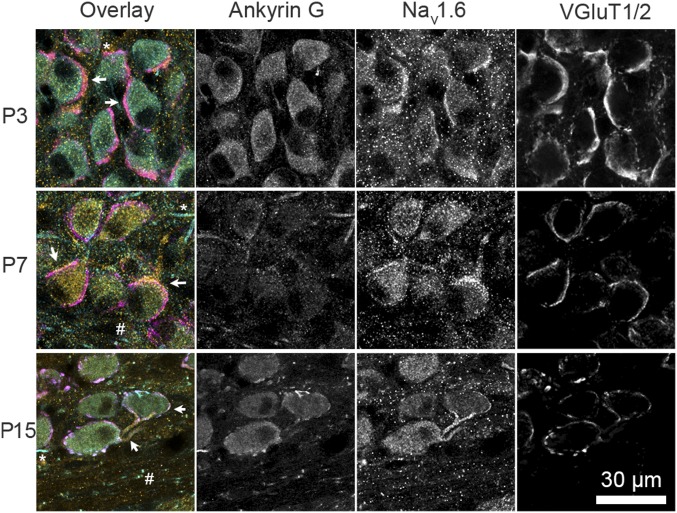
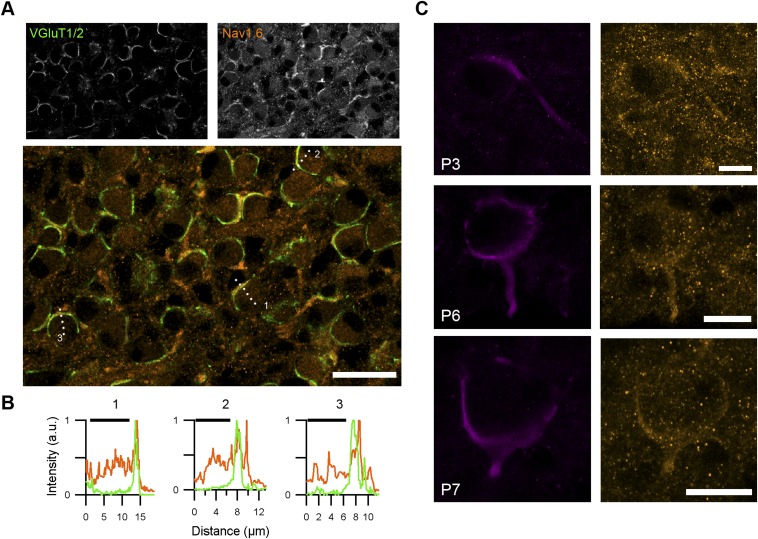
The ability of the neonatal calyx of Held to fire at high frequencies with little depression suggests that it expresses sodium channel 1.6 (Nav1.6) already shortly after its formation (23, 33). Brainstem sections of different postnatal ages were immunolabeled with a Nav1.6 antibody. Already at P2–P3, weak expression was observed throughout the ventral auditory brainstem. The immunolabeling showed overlap with labeling for the vesicular glutamate transporter 1/2, but not with Ankyrin G (Fig. 4). No evidence for the presence of heminodes was obtained at this developmental stage. To confirm the presynaptic presence of Nav1.6, we electroporated in vivo the calyceal axons with a fluorescent dye to label the axon that gives rise to the terminal, and again stained those terminals for Nav1.6 and Ankyrin G. Nav1.6 signal colocalized with the electroporated axons; no heminodes were observed (Fig. S9). Surprisingly, Nav1.6 intensity was highest in the terminal itself (Fig. S9B), in contrast to a previous report (33), which might be related to the early developmental stage, at which no heminode has yet been formed (34, 35). We conclude that Nav1.6 is already present at the calyx of Held shortly after its formation.
Fig. 4.
Presynaptic immunolabeling of sodium channel 1.6 during postnatal development. Confocal images of the MNTB (P3, P7, and P15 rat) that were immunolabeled for Ankyrin G, sodium channel 1.6 (Nav1.6), and vesicular glutamate transporter 1/2 (VGluT1/2) reveal colocalization of the strongest Nav1.6 labeling with presynaptic VGluT1/2 (arrows). The Ankyrin G antibody marks axon initial segments (*), nodes of Ranvier (#), and heminodes. Conclusive distinction between heminodes and nodes of Ranvier was not possible based on this panel of antibodies.
Fig. S9.
Immunolabeling of sodium channel 1.6 (Nav1.6) in the calyx of Held. (A) Vesicular glutamate transporter 1/2 (VGluT1/2) (a presynaptic marker) and Nav1.6 immunolabeling of the MNTB of a P5 rat. Numbers in the lower panel refer to line profiles shown in B. (B) Line profiles of the immunolabeling of presynaptic marker VGluT1/2 (green) and sodium channel 1.6 (orange). Black bars indicate the postsynaptic neuron. The peak of Nav1.6 intensity colocalized with VGluT1/2 or was more distal from the postsynaptic neuron than the VGluT1/2 peak. (C) Calyceal axons were electroporated in vivo, followed by Nav1.6 labeling. [Scale bars: 25 µm (A) and 10 µm (C).]
SI Materials and Methods
Surgery.
All experiments complied with the ethical guidelines for laboratory animals within our institute and with European guidelines, and were approved by the animal ethical committee of the Erasmus MC. The surgical procedures are described in detail in refs. 22 and 51.
In Vivo Electrophysiology and Electroporation.
Details of the electrophysiological methods have been provided in ref. 22. In short, whole-cell recordings were obtained with an Axopatch 200B (Molecular Devices) in either voltage-clamp mode at −80 mV, or current-clamp fast mode. Signals were low-pass filtered at 10 kHz (four-pole Bessel), digitized at 25 kHz by an A/D converter (Digidata 1220A; Molecular Devices), and acquired with Clampex 10.2 (Molecular Devices) running on a Windows XP computer. The potassium gluconate-based intrapipette solution contained the following (in mM): 126 K-gluconate, 20 KCl, 0.5 EGTA, 10 Hepes, 10 Na2-phosphocreatine, 4 Mg-ATP, 0.4 Na2-GTP with pH 7.2 adjusted with KOH; in some recordings, 2 mg/mL biocytin was added to the intrapipette solution. The junction potential of −11 mV was compensated before gigaseal formation. All potentials reported in the paper were corrected for the junction potential. Dehydration of the craniotomy was prevented by regularly rinsing and submerging the opening with the following (in mM): 135 NaCl, 5.4 KCl, 1 MgCl2, 1.8 CaCl2, 5 Hepes with pH 7.2 adjusted with NaOH. Stray capacitances were compensated in cell-attached mode, and upon obtaining whole-cell configuration series resistance was measured (Fig. S1) in voltage clamp by a 500-ms, 5-mV step from −70 to −75 mV, but the series resistance was not compensated. Every recording session started with a brief, 500-ms current injections to record the intrinsic properties of the calyx. Long, 20-s current injections were also performed to assess the change in AP properties by its onset potentials. Spontaneous activity without current injections was also recorded to see the physiological APs during natural firing. In a few recordings (n = 6), voltage-clamp recordings were made at −80 mV without series resistance compensation. These recordings typically showed strong inward currents caused by the invading AP that escaped the voltage clamp.
Due to the combination of a high series resistance and high, distributed pipette capacitance, the time constant of the pipette was close to the calyceal time constants, limiting optimal compensation with the patch-clamp amplifier. AP kinetics in vivo were therefore low-pass filtered. To assess the impact of this filtering effect, we compared optimally compensated recordings and undercompensated recordings in slice recordings with low series resistances. Although APs did show more rapid membrane potential changes, there was no change in the relative amount of depression observed at high-frequency firing.
In vivo electroporation was performed as described in ref. 51. Broken glass pipettes with a tip opening of 15–20 µm were filled with the dye Alexa Fluor 594–dextran (10% in 0.5 M NaCl), and lowered to a depth of 100–150 µm dorsal of the basilar artery. Electroporation was performed with 0.3-µA, 250-ms pulses at 2 Hz for 5–10 min via a custom-made pipette holder. The dye was allowed to diffuse within the axon for 1–2 h, after which the animal was transcardially perfused as described in ref. 22 for subsequent immunolabeling.
Brainstem Slices and Slice Electrophysiology.
Brainstem slices were made from P4–P9 neonatal rats as described in ref. 3. For the slice recordings, the intracellular pipette solution was supplemented with 10–20 µM Alexa Fluor 488 (Molecular Probes) to validate the recorded structure at the end of the recording. Recordings were performed at physiological temperatures (35–36 °C, measured in the vicinity of the slice). The extracellular solution contained the following (in mM): 125 NaCl, 2.5 KCl, 1.25 NaH2PO4, 3 myo-inositol, 2 Na-pyruvate, 25 glucose, 25 NaHCO3, 0.4 l-ascorbic acid, 1 MgSO4, and 1.2 CaCl2. In a few recordings, the CaCl2 concentration was increased to 2 mM, or XE991 (10 µM) was added to the extracellular solution. The extracellular solution was bubbled with carbogen (95% O2, 5% CO2), and was pumped (2–3 mL/min) through an in-line heater (Warner Instruments) into the recording chamber. We waited until the bath temperature stabilized before approaching the calyx. Recordings were made within 7 h postmortem. Voltage recordings, obtained in CC-fast mode of the Axopatch 200B amplifier, were low-pass filtered at 10 kHz (four-pole Bessel), digitized at 25 or 50 kHz by an A/D converter (Digidata 1322A; Molecular Devices), and acquired with Clampex 8.2 (Molecular Devices) running on Windows XP. Bipolar stimulation electrodes were purchased from MicroProbes for Life Science (PI2ST30.1H10). Stimulation current was maximally 240 µA (threshold usually <100 µA). The junction potential was compensated. Series resistance was fully compensated for the current-clamp recordings. Stray capacitances were compensated either in voltage-clamp or in current-clamp mode. Stray capacitance compensation in current-clamp mode gave briefer and larger APs, but did not qualitatively alter the findings reported.
Sodium Channel Immunolabeling.
For immunolabeling, rat pups were transcardially perfused as described in ref. 22. The sodium channel labeling was done as reported in ref. 52. Images were acquired with a LSM-700 confocal microscope (Zeiss), and for the sodium channel labeling the acquisition settings were optimized for Purkinje cells that were present in the same coronal slice and functioned as a positive control for Nav1.6 labeling (52, 53), before imaging the MNTB. In general, the labeling in the MNTB was stronger than that for Purkinje cells. Three-dimensional rendering was done with Volocity (Improvision). Images shown in Fig. 4 were contrasted in Adobe Photoshop 11.0. The other confocal images were contrasted in ImageJ 1.51j. Pseudocolors were added in ImageJ.
The following antibodies were used in this study: sodium channel 1.6 (ASC-009; Alomone Labs; 1:1,000 or 1:500; rabbit), vesicular glutamate transporter 1 and 2 (ab5905 and ab2251; Millipore; 1:2,000; guinea pig, guinea pig), Ankyrin G (clone N106/36; NeuroMab; 1:1,000; mouse). Highly cross-absorbed secondary antibodies were used: Alexa Fluor 405, 488, 555, and 680 (Molecular Probes), all at 1:200. Control experiments with omission of primary antibody, or 1-h preincubation with control peptide antigen (100 µg/mL; Alomone Labs) reduced Nav1.6 labeling to background levels. The specificity of the anti-Nav1.6 antibody has been shown for mice (54).
AP Depression Model.
AP depression was described by a model that included both the steady-state effects of the membrane potential and its effects on the speed of the recovery. The amount of depression is determined by the actual value of the depression coefficient, D, which ranges from 0 to 1. The value of D determines the size of the ith AP (Yi) relative to the maximal AP rate of rise (Ymax):
| [S1] |
At each AP, D decreases by a fraction d:
| [S2] |
The depletion factor d can be viewed as the fraction of sodium channels that are not inactivated by the AP. Recovery from depression does not start until after a delay, because the AP has to repolarize first. This delay was set to 1.5 times the average AP half-width in each recording. Following this delay, recovery is described by the following:
| [S3] |
D relaxes to steady-state depression DV with time constant τV. Integration of Eq. S3 while assuming that the membrane potential between APi and APi+1 is constantly at the onset potential of APi+1 yields the exponential recovery of D between APs:
| [S4] |
where t0 is the time point at which recovery starts following the AP. Both DV and τV were voltage dependent. The voltage-dependent effects are based on the impact of the membrane potential on the sodium channel conductance, as its recovery from inactivation has a time constant that is voltage dependent (33), and its steady-state inactivation also depends on the membrane potential. Dv was measured for every calyx by an independent set of experiments where we injected currents to bias the onset potentials of the calyx and after 500 ms stimulated the afferent axon to elicit an AP. The AP rate of rise could then be analyzed as function of onset potential (similar to what is shown in Fig. S5B) with the following equation:
| [S5] |
with DV described by a simple inverse Boltzmann equation:
| [S6] |
with two free parameters, V0.5, the half-depression potential, and k, the slope factor. Note that, for our purpose, a polynomial model would suffice as we only want to get an accurate estimate of how Vstart translates into Ymax. The Boltzmann equation is, however, expected to be biologically consistent with the inactivation curve of a voltage-gated channel.
The voltage dependence of τV was based on a voltage-clamp study of the calyceal sodium channels (33). Within the studied voltage range, the relation between τV and the membrane potential in ref. 33 was nearly linear (r = 1.0). By linear regression we quantified the relation and multiplied this by a temperature correction factor, which was also obtained from ref. 33:
| [S7] |
To correct for the liquid junction potential, we added 10 mV to our recorded membrane potential. Note that, based on a Hodgkin–Huxley conductance model, we would expect the relation between τV and Vm to follow a bell-shaped curve, and therefore the linear extrapolation in Eq. S7 may underestimate τV.
The fit function iteratively calculates the changes in the depression coefficient, D, based on the measured onset potentials and intervals. D is initialized at a value of 1. For each subsequent AP, the evolution of D is calculated using Eqs. S2 and S4. By using Eq. S1 and the two free parameters, Ymax and d, the measured AP rates of rise were thus fit with the aid of the “All-at-once-fitting” method implemented in Igor Pro-6 (Wavemetrics); this method has the ability to evaluate the iterative function against the data by using the entire dataset instead of single X–Y pairs. The model incorporates two effects of the afterpotential: (i) the afterpotential sets τV, and (ii) the afterpotential determines DV. By using simpler variants of the model, we can assess how these two effects of the afterpotential contribute to the observed depression. To analyze the individual contribution of the recovery from depression, we exclude the steady-state effect by fixing Dv to 1 in Eq. S4. The contribution of the steady-state depression was addressed by excluding the recovery from depression, thus reducing Eq. S1 to Eq. S5.
Discussion
Here, we report on in vivo whole-cell and juxtacellular recordings from the calyx of Held, a terminal whose accessibility for slice recordings has made it a popular subject for studying the biophysics of transmitter release. In developing rodents, the calyx of Held fired in a burst manner at >200 Hz with no sign of failures, remarkably little depression or broadening of the AP, and rapid recovery from AP depression. We defined the stability potential, Vstab, as the membrane potential following the AP at which the next AP would not change shape, and found it to be close to the RMP. Moreover, the membrane potential following the AP (Vafter) was close to Vstab, which means that during high-frequency firing, when Vafter determined the onset potential of the next AP, AP stability was maximized. Immunolabeling indicated that the sodium channel Nav1.6 was already present in newly formed calyces, providing a molecular basis for the observed lack of AP depression both in slices and in vivo. These results thus demonstrate important mechanisms underlying fast signaling during natural firing of the calyx of Held.
Mechanisms Limiting AP Depression During Natural Activity.
We observed that the shape of the calyceal AP was remarkably invariant during in vivo firing. Even though instantaneous firing frequencies of 200 Hz were observed already at P2–P3 when the calyx forms, there was little AP depression. Two factors appeared to be crucially important for the lack of a change in the AP’s shape: fast recovery from AP depression and a membrane potential between APs that minimized waveform changes.
The AP depression obtained in slice recordings was largely independent from the interval between APs. Only at the 2- to 4-ms intervals was a time-dependent component in the recovery observed. The combination of a steady-state depression with a time-dependent recovery adequately described the observed AP depression, suggesting that the fast recovery of calyceal sodium channels from inactivation (33) provided a reasonable description of the recovery from AP depression. Immunolabeling evidence was obtained for the early presence of Nav1.6, which is known for its swift kinetics and resistance to inactivation during high-frequency firing (36); the presence of Nav1.6 is in agreement with studies at the calyx of Held at later developmental stages (33, 34, 35). No evidence was found for the presence of heminodes, which do not form until the second postnatal week, presumably triggered by myelination (15, 34, 35, 37). An increase in glial coverage and the replacement of the cup shape by the calyceal fingers precluded an investigation of the properties of the mature calyx in vivo. The mature calyx has even briefer APs after hearing onset (28), to which an exclusion of sodium channels from the calyx may contribute (33).
A second contributing factor to the resistance to spike depression in vivo was that Vafter was close to Vstab, the potential at which the shape of the AP became invariant. The in vivo RMP, which was also close to Vafter, was within the same range as previous slice reports, although in most cases a more negative RMP and a larger DAP were reported (3, 24, 28, 38–40). Assuming that the larger DAP is due to the more negative RMP, a difference in temperature might explain the difference with many of the earlier slice experiments, because the RMP of the calyx tends to be more depolarized at physiological temperatures (41), and many of the earlier slice experiments were done at room temperature. As the RMP at the calyx of Held is set by the potassium channel subunit Kv7.5 (38), Ih (42), the Na+/K+-ATPase (43), and a persistent sodium channel (39), subtle differences in any of these four conductances (or driving forces) may be responsible for the observed small difference in RMP compared with some previous slice studies. Apart from Kv7.5, for which blocking showed little effect on Vafter, these conductances are also likely to contribute to setting Vafter, with an additional prominent role for Kv1 channels (40, 44) and resurgent sodium channels (15).
Resurgent sodium currents not only make an important contribution to the afterpotential of the calyx of Held, they also promote faster APs and higher frequency signaling (15). Most likely, the resurgent sodium currents reflect the unblocking of a pore-blocking particle from the auxiliary Navβ4 channel subunit, which can rapidly block Nav1.6 upon opening (23). The blocking particle allows for brief APs, and it limits sodium channel inactivation. At very short intervals, facilitation of K channels may also contribute to keeping the APs brief (45). Rapid closure of axonal sodium channels is expected to increase the energetic efficiency of the AP (46). The transient opening of the sodium channel due to the unblocking of this particle at negative potentials has been viewed as a by-product, but we suggest that the resurgent current serves to set Vafter close to Vstab, thereby sustaining invariant AP firing. Together, these adaptations thus allow remarkably stable APs, even at high firing frequencies.
Functional Implications.
In general, the afterpotential controls the availability of voltage-dependent ion channels during high-frequency signaling and sets the onset potential of the next AP. More specific functions have been proposed for the afterpotential in terminals. The DAP may be responsible for increased excitability following an AP in hippocampal Schaffer collaterals (47), but a large DAP may lead to sodium channel inactivation and spike failures (15). A decrease in presynaptic AP amplitude might contribute to short-term depression (1), although these changes might be counteracted by a broadening of the AP (48). By controlling the deactivation of Ca2+ channels, the afterpotential may directly control transmitter release, but a recent study at the calyx of Held found the total calcium influx to be largely independent of the value of the afterpotential (49). At hippocampal mossy fiber terminals, the DAP may contribute to cumulative inactivation of Kv1 channels, resulting in spike broadening (5), and thereby contributing to the strong synaptic facilitation during high-frequency bursts (5, 50). The transmission characteristics of this synapse differ substantially from the relay function of the calyx of Held synapse (16) or the cerebellar mossy fiber synapse (4), and this difference might partially be a consequence of Vafter being more depolarized than Vstab. For en passant boutons, the impedance mismatch imposed by their geometrical shape makes the axon vulnerable for frequency-dependent propagation failures (1). The use of voltage indicators (7, 12, 13) might allow testing of whether the mechanisms identified here may also help to stabilize AP speed and secure AP propagation in boutons.
We propose that, in agreement with data obtained in the crayfish neuromuscular junction (7), an important function of the afterpotential is to preserve the shape of the presynaptic AP. The close correspondence of RMP, Vstab, and Vafter makes not only the onset potential of AP remarkably independent of firing frequency, but also results in a remarkably stable AP shape. For a relay synapse such as the calyx of Held, which excels in being precise and reliable over a wide range of firing frequencies (16), this has obvious advantages. Changes in AP shape due to a change in sodium channel availability will not only affect the opening of calcium channels, the timing and amplitude of Ca2+-influx, and neurotransmitter release, but will also affect axonal propagation speed, resulting in a loss of timing precision (2). We conclude that our in vivo recordings of the calyx of Held provide insights into the mechanisms that keep APs stable. Future experiments may clarify how the relation between Vafter and Vstab is controlled, and whether their relation can be dynamically adjusted at the calyx of Held and other presynaptic terminals.
Materials and Methods
All experiments complied with institutional and European guidelines, and were approved by the animal ethical committee of the Erasmus MC. Briefly, timed-pregnancy Wistar dams were purchased from Envigo or Charles River and were housed within the animal facility of the Erasmus MC. The day of birth was taken as P0. Neonate pups were anesthetized with isoflurane, intubated, and mechanically ventilated, and underwent a ventral approach to expose the right ventral brainstem (22, 51). Before the recordings, anesthesia was reduced to 1% isoflurane, which kept the animal areflexive. The in vivo electroporation with Alexa Fluor 594–dextran (Molecular Probes) was described in ref. 51. The in vivo electrophysiological methods are detailed in ref. 22. Junction potential of the K-gluconate–based intrapipette solution (−11 mV) was corrected. Gigaseal formation was obtained by gentle suction followed by pipette capacitance (Cp) compensation in voltage-clamp mode of the Axopatch 200B (Molecular Devices). Brief suction was applied to establish the whole-cell configuration, and the RMP was measured immediately after break-in. Voltage recordings were made in CC-fast mode. The recordings were low-pass filtered (four-pole Bessel; 10 kHz) and digitized at 25 kHz. Series resistances (Rs) were measured (Fig. S1), but the voltage drop across Rs was corrected off-line.
Acute brainstem slices were made as reported in ref. 3. Rs was fully compensated. Cp was compensated either in voltage-clamp or in current-clamp mode. Recordings were low-pass filtered (four-pole Bessel; 10 kHz) and digitized at 25 or 50 kHz. Custom-written analyses were made in the Igor Pro environment (Wavemetrics). For the depression model, we only included the recordings for which >70% of the total variance was explained (n = 14 of 17).
The biocytin fluorescent labeling procedure has been described elsewhere (22). For the immunolabeling of sodium channel 1.6, brainstem sections (40 μm) underwent antigen retrieval by 3-h incubation at 80 °C in 10 mM sodium citrate; they subsequently followed the same immunolabeling procedure as detailed in refs. 22 and 52 with Tris-buffered solutions (pH 7.6). More details can be found in SI Materials and Methods.
Supplementary Material
Acknowledgments
We thank Kees Donkersloot for technical support, Elize Haasdijk and Erika Goedknegt for support with histology, Fereshta Zakeri for performing control immunolabelings, and Maarten Kole for helpful comments. The confocal scanning microscope was accessed through the Optical Imaging Center at Erasmus MC. The research was funded by the Nederlandse Organisatie voor Wetenschappelijk Onderzoek–Aard- en Levenswetenschappen (“Development of a Giant Synapse”; 823.02006).
Footnotes
The authors declare no conflict of interest.
This article is a PNAS Direct Submission.
This article contains supporting information online at www.pnas.org/lookup/suppl/doi:10.1073/pnas.1619433114/-/DCSupplemental.
References
- 1.Debanne D, Campanac E, Bialowas A, Carlier E, Alcaraz G. Axon physiology. Physiol Rev. 2011;91:555–602. doi: 10.1152/physrev.00048.2009. [DOI] [PubMed] [Google Scholar]
- 2.Bucher D, Goaillard JM. Beyond faithful conduction: Short-term dynamics, neuromodulation, and long-term regulation of spike propagation in the axon. Prog Neurobiol. 2011;94:307–346. doi: 10.1016/j.pneurobio.2011.06.001. [DOI] [PMC free article] [PubMed] [Google Scholar]
- 3.Borst JGG, Helmchen F, Sakmann B. Pre- and postsynaptic whole-cell recordings in the medial nucleus of the trapezoid body of the rat. J Physiol. 1995;489:825–840. doi: 10.1113/jphysiol.1995.sp021095. [DOI] [PMC free article] [PubMed] [Google Scholar]
- 4.Rancz EA, et al. High-fidelity transmission of sensory information by single cerebellar mossy fibre boutons. Nature. 2007;450:1245–1248. doi: 10.1038/nature05995. [DOI] [PMC free article] [PubMed] [Google Scholar]
- 5.Geiger JR, Jonas P. Dynamic control of presynaptic Ca2+ inflow by fast-inactivating K+ channels in hippocampal mossy fiber boutons. Neuron. 2000;28:927–939. doi: 10.1016/s0896-6273(00)00164-1. [DOI] [PubMed] [Google Scholar]
- 6.Barrett EF, Barrett JN. Intracellular recording from vertebrate myelinated axons: Mechanism of the depolarizing afterpotential. J Physiol. 1982;323:117–144. doi: 10.1113/jphysiol.1982.sp014064. [DOI] [PMC free article] [PubMed] [Google Scholar]
- 7.Lin JW. Electrophysiological events recorded at presynaptic terminals of the crayfish neuromuscular junction with a voltage indicator. J Physiol. 2008;586:4935–4950. doi: 10.1113/jphysiol.2008.158089. [DOI] [PMC free article] [PubMed] [Google Scholar]
- 8.Powell K, Mathy A, Duguid I, Häusser M. Synaptic representation of locomotion in single cerebellar granule cells. eLife. 2015;4:4. doi: 10.7554/eLife.07290. [DOI] [PMC free article] [PubMed] [Google Scholar]
- 9.Begum R, Bakiri Y, Volynski KE, Kullmann DM. Action potential broadening in a presynaptic channelopathy. Nat Commun. 2016;7:12102. doi: 10.1038/ncomms12102. [DOI] [PMC free article] [PubMed] [Google Scholar]
- 10.Llinás R, Steinberg IZ, Walton K. Presynaptic calcium currents in squid giant synapse. Biophys J. 1981;33:289–321. doi: 10.1016/S0006-3495(81)84898-9. [DOI] [PMC free article] [PubMed] [Google Scholar]
- 11.Poage RE, Zengel JE. Repolarization of the presynaptic action potential and short-term synaptic plasticity in the chick ciliary ganglion. Synapse. 2002;46:189–198. doi: 10.1002/syn.10135. [DOI] [PubMed] [Google Scholar]
- 12.Hoppa MB, Gouzer G, Armbruster M, Ryan TA. Control and plasticity of the presynaptic action potential waveform at small CNS nerve terminals. Neuron. 2014;84:778–789. doi: 10.1016/j.neuron.2014.09.038. [DOI] [PMC free article] [PubMed] [Google Scholar]
- 13.Ford KJ, Davis GW. Archaerhodopsin voltage imaging: Synaptic calcium and BK channels stabilize action potential repolarization at the Drosophila neuromuscular junction. J Neurosci. 2014;34:14517–14525. doi: 10.1523/JNEUROSCI.2203-14.2014. [DOI] [PMC free article] [PubMed] [Google Scholar]
- 14.Hu H, Jonas P. A supercritical density of Na+ channels ensures fast signaling in GABAergic interneuron axons. Nat Neurosci. 2014;17:686–693. doi: 10.1038/nn.3678. [DOI] [PMC free article] [PubMed] [Google Scholar]
- 15.Kim JH, Kushmerick C, von Gersdorff H. Presynaptic resurgent Na+ currents sculpt the action potential waveform and increase firing reliability at a CNS nerve terminal. J Neurosci. 2010;30:15479–15490. doi: 10.1523/JNEUROSCI.3982-10.2010. [DOI] [PMC free article] [PubMed] [Google Scholar]
- 16.Borst JGG, Soria van Hoeve J. The calyx of Held synapse: From model synapse to auditory relay. Annu Rev Physiol. 2012;74:199–224. doi: 10.1146/annurev-physiol-020911-153236. [DOI] [PubMed] [Google Scholar]
- 17.Guinan JJ, Jr, Li RY-S. Signal processing in brainstem auditory neurons which receive giant endings (calyces of Held) in the medial nucleus of the trapezoid body of the cat. Hear Res. 1990;49:321–334. doi: 10.1016/0378-5955(90)90111-2. [DOI] [PubMed] [Google Scholar]
- 18.Kandler K, Friauf E. Pre- and postnatal development of efferent connections of the cochlear nucleus in the rat. J Comp Neurol. 1993;328:161–184. doi: 10.1002/cne.903280202. [DOI] [PubMed] [Google Scholar]
- 19.Hoffpauir BK, Grimes JL, Mathers PH, Spirou GA. Synaptogenesis of the calyx of Held: Rapid onset of function and one-to-one morphological innervation. J Neurosci. 2006;26:5511–5523. doi: 10.1523/JNEUROSCI.5525-05.2006. [DOI] [PMC free article] [PubMed] [Google Scholar]
- 20.Rodríguez-Contreras A, de Lange RPJ, Lucassen PJ, Borst JGG. Branching of calyceal afferents during postnatal development in the rat auditory brainstem. J Comp Neurol. 2006;496:214–228. doi: 10.1002/cne.20918. [DOI] [PubMed] [Google Scholar]
- 21.Wang HC, Bergles DE. Spontaneous activity in the developing auditory system. Cell Tissue Res. 2015;361:65–75. doi: 10.1007/s00441-014-2007-5. [DOI] [PMC free article] [PubMed] [Google Scholar]
- 22.Sierksma MC, Tedja MS, Borst JGG. In vivo matching of postsynaptic excitability with spontaneous synaptic inputs during formation of the rat calyx of Held synapse. J Physiol. 2017;595:207–231. doi: 10.1113/JP272780. [DOI] [PMC free article] [PubMed] [Google Scholar]
- 23.Lewis AH, Raman IM. Resurgent current of voltage-gated Na+ channels. J Physiol. 2014;592:4825–4838. doi: 10.1113/jphysiol.2014.277582. [DOI] [PMC free article] [PubMed] [Google Scholar]
- 24.Forsythe ID. Direct patch recording from identified presynaptic terminals mediating glutamatergic EPSCs in the rat CNS, in vitro. J Physiol. 1994;479:381–387. doi: 10.1113/jphysiol.1994.sp020303. [DOI] [PMC free article] [PubMed] [Google Scholar]
- 25.Tritsch NX, et al. Calcium action potentials in hair cells pattern auditory neuron activity before hearing onset. Nat Neurosci. 2010;13:1050–1052. doi: 10.1038/nn.2604. [DOI] [PMC free article] [PubMed] [Google Scholar]
- 26.Crins TTH, Rusu SI, Rodríguez-Contreras A, Borst JGG. Developmental changes in short-term plasticity at the rat calyx of Held synapse. J Neurosci. 2011;31:11706–11717. doi: 10.1523/JNEUROSCI.1995-11.2011. [DOI] [PMC free article] [PubMed] [Google Scholar]
- 27.Morest DK. The growth of synaptic endings in the mammalian brain: A study of the calyces of the trapezoid body. Z Anat Entwicklungsgesch. 1968;127:201–220. doi: 10.1007/BF00526129. [DOI] [PubMed] [Google Scholar]
- 28.Taschenberger H, von Gersdorff H. Fine-tuning an auditory synapse for speed and fidelity: Developmental changes in presynaptic waveform, EPSC kinetics, and synaptic plasticity. J Neurosci. 2000;20:9162–9173. doi: 10.1523/JNEUROSCI.20-24-09162.2000. [DOI] [PMC free article] [PubMed] [Google Scholar]
- 29.Chuhma N, Ohmori H. Postnatal development of phase-locked high-fidelity synaptic transmission in the medial nucleus of the trapezoid body of the rat. J Neurosci. 1998;18:512–520. doi: 10.1523/JNEUROSCI.18-01-00512.1998. [DOI] [PMC free article] [PubMed] [Google Scholar]
- 30.Lorteije JAM, Rusu SI, Kushmerick C, Borst JGG. Reliability and precision of the mouse calyx of Held synapse. J Neurosci. 2009;29:13770–13784. doi: 10.1523/JNEUROSCI.3285-09.2009. [DOI] [PMC free article] [PubMed] [Google Scholar]
- 31.Taschenberger H, Leão RM, Rowland KC, Spirou GA, von Gersdorff H. Optimizing synaptic architecture and efficiency for high-frequency transmission. Neuron. 2002;36:1127–1143. doi: 10.1016/s0896-6273(02)01137-6. [DOI] [PubMed] [Google Scholar]
- 32.Bean BP. The action potential in mammalian central neurons. Nat Rev Neurosci. 2007;8:451–465. doi: 10.1038/nrn2148. [DOI] [PubMed] [Google Scholar]
- 33.Leão RM, et al. Presynaptic Na+ channels: Locus, development, and recovery from inactivation at a high-fidelity synapse. J Neurosci. 2005;25:3724–3738. doi: 10.1523/JNEUROSCI.3983-04.2005. [DOI] [PMC free article] [PubMed] [Google Scholar]
- 34.Berret E, Kim SE, Lee SY, Kushmerick C, Kim JH. Functional and structural properties of ion channels at the nerve terminal depends on compact myelin. J Physiol. 2016;594:5593–5609. doi: 10.1113/JP272205. [DOI] [PMC free article] [PubMed] [Google Scholar]
- 35.Xu J, Berret E, Kim JH. Activity-dependent formation and location of voltage-gated sodium channel clusters at a CNS nerve terminal during postnatal development. J Neurophysiol. 2017;117:582–593. doi: 10.1152/jn.00617.2016. [DOI] [PMC free article] [PubMed] [Google Scholar]
- 36.Zhou W, Goldin AL. Use-dependent potentiation of the Nav1.6 sodium channel. Biophys J. 2004;87:3862–3872. doi: 10.1529/biophysj.104.045963. [DOI] [PMC free article] [PubMed] [Google Scholar]
- 37.Kaplan MR, et al. Differential control of clustering of the sodium channels Nav1.2 and Nav1.6 at developing CNS nodes of Ranvier. Neuron. 2001;30:105–119. doi: 10.1016/s0896-6273(01)00266-5. [DOI] [PubMed] [Google Scholar]
- 38.Huang H, Trussell LO. KCNQ5 channels control resting properties and release probability of a synapse. Nat Neurosci. 2011;14:840–847. doi: 10.1038/nn.2830. [DOI] [PMC free article] [PubMed] [Google Scholar]
- 39.Huang H, Trussell LO. Control of presynaptic function by a persistent Na+ current. Neuron. 2008;60:975–979. doi: 10.1016/j.neuron.2008.10.052. [DOI] [PMC free article] [PubMed] [Google Scholar]
- 40.Ishikawa T, et al. Distinct roles of Kv1 and Kv3 potassium channels at the calyx of Held presynaptic terminal. J Neurosci. 2003;23:10445–10453. doi: 10.1523/JNEUROSCI.23-32-10445.2003. [DOI] [PMC free article] [PubMed] [Google Scholar]
- 41.Kim JH, von Gersdorff H. Suppression of spikes during posttetanic hyperpolarization in auditory neurons: The role of temperature, Ih currents, and the Na+-K+-ATPase pump. J Neurophysiol. 2012;108:1924–1932. doi: 10.1152/jn.00103.2012. [DOI] [PMC free article] [PubMed] [Google Scholar]
- 42.Cuttle MF, Rusznák Z, Wong AY, Owens S, Forsythe ID. Modulation of a presynaptic hyperpolarization-activated cationic current (Ih) at an excitatory synaptic terminal in the rat auditory brainstem. J Physiol. 2001;534:733–744. doi: 10.1111/j.1469-7793.2001.00733.x. [DOI] [PMC free article] [PubMed] [Google Scholar]
- 43.Kim JH, Sizov I, Dobretsov M, von Gersdorff H. Presynaptic Ca2+ buffers control the strength of a fast post-tetanic hyperpolarization mediated by the α3 Na+/K+-ATPase. Nat Neurosci. 2007;10:196–205. doi: 10.1038/nn1839. [DOI] [PubMed] [Google Scholar]
- 44.Dodson PD, et al. Presynaptic rat Kv1.2 channels suppress synaptic terminal hyperexcitability following action potential invasion. J Physiol. 2003;550:27–33. doi: 10.1113/jphysiol.2003.046250. [DOI] [PMC free article] [PubMed] [Google Scholar]
- 45.Yang YM, et al. Enhancing the fidelity of neurotransmission by activity-dependent facilitation of presynaptic potassium currents. Nat Commun. 2014;5:4564. doi: 10.1038/ncomms5564. [DOI] [PMC free article] [PubMed] [Google Scholar]
- 46.Alle H, Roth A, Geiger JRP. Energy-efficient action potentials in hippocampal mossy fibers. Science. 2009;325:1405–1408. doi: 10.1126/science.1174331. [DOI] [PubMed] [Google Scholar]
- 47.Soleng AF, Baginskas A, Andersen P, Raastad M. Activity-dependent excitability changes in hippocampal CA3 cell Schaffer axons. J Physiol. 2004;560:491–503. doi: 10.1113/jphysiol.2004.071225. [DOI] [PMC free article] [PubMed] [Google Scholar]
- 48.Borst JGG, Sakmann B. Effect of changes in action potential shape on calcium currents and transmitter release in a calyx-type synapse of the rat auditory brainstem. Philos Trans R Soc Lond B Biol Sci. 1999;354:347–355. doi: 10.1098/rstb.1999.0386. [DOI] [PMC free article] [PubMed] [Google Scholar]
- 49.Clarke SG, Scarnati MS, Paradiso KG. Neurotransmitter release can be stabilized by a mechanism that prevents voltage changes near the end of action potentials from affecting calcium currents. J Neurosci. 2016;36:11559–11572. doi: 10.1523/JNEUROSCI.0066-16.2016. [DOI] [PMC free article] [PubMed] [Google Scholar]
- 50.Bischofberger J, Engel D, Frotscher M, Jonas P. Timing and efficacy of transmitter release at mossy fiber synapses in the hippocampal network. Pflugers Arch. 2006;453:361–372. doi: 10.1007/s00424-006-0093-2. [DOI] [PubMed] [Google Scholar]
- 51.Rodríguez-Contreras A, van Hoeve JS, Habets RLP, Locher H, Borst JGG. Dynamic development of the calyx of Held synapse. Proc Natl Acad Sci USA. 2008;105:5603–5608. doi: 10.1073/pnas.0801395105. [DOI] [PMC free article] [PubMed] [Google Scholar]
- 52.de Ruiter MM, De Zeeuw CI, Hansel C. Voltage-gated sodium channels in cerebellar Purkinje cells of mormyrid fish. J Neurophysiol. 2006;96:378–390. doi: 10.1152/jn.00906.2005. [DOI] [PubMed] [Google Scholar]
- 53.Jenkins SM, Bennett V. Ankyrin-G coordinates assembly of the spectrin-based membrane skeleton, voltage-gated sodium channels, and L1 CAMs at Purkinje neuron initial segments. J Cell Biol. 2001;155:739–746. doi: 10.1083/jcb.200109026. [DOI] [PMC free article] [PubMed] [Google Scholar]
- 54.Black JA, Renganathan M, Waxman SG. Sodium channel Nav1.6 is expressed along nonmyelinated axons and it contributes to conduction. Brain Res Mol Brain Res. 2002;105:19–28. doi: 10.1016/s0169-328x(02)00385-6. [DOI] [PubMed] [Google Scholar]
Associated Data
This section collects any data citations, data availability statements, or supplementary materials included in this article.


