Significance
Individual judgments, feelings, and behaviors can spread from person to person in social networks, similarly to the propagation of infectious diseases. Despite major implications for many social phenomena, the underlying social-contagion processes are poorly understood. We examined how participants’ perceptual judgments spread from one person to another and across diffusion chains. We gauged the speed, reach, and scale of social contagion. Judgment propagation tended to slow down with increasing social distance from the source. Crucially, it vanished beyond a social horizon of three to four people. These results advance the understanding of some of the mechanisms underlying social-contagion phenomena as well as their scope across domains as diverse as political mobilization, health practices, and emotions.
Keywords: social influence, diffusion chains, information diffusion, social contagion, collective behavior
Abstract
In recent years, a large body of research has demonstrated that judgments and behaviors can propagate from person to person. Phenomena as diverse as political mobilization, health practices, altruism, and emotional states exhibit similar dynamics of social contagion. The precise mechanisms of judgment propagation are not well understood, however, because it is difficult to control for confounding factors such as homophily or dynamic network structures. We introduce an experimental design that renders possible the stringent study of judgment propagation. In this design, experimental chains of individuals can revise their initial judgment in a visual perception task after observing a predecessor’s judgment. The positioning of a very good performer at the top of a chain created a performance gap, which triggered waves of judgment propagation down the chain. We evaluated the dynamics of judgment propagation experimentally. Despite strong social influence within pairs of individuals, the reach of judgment propagation across a chain rarely exceeded a social distance of three to four degrees of separation. Furthermore, computer simulations showed that the speed of judgment propagation decayed exponentially with the social distance from the source. We show that information distortion and the overweighting of other people’s errors are two individual-level mechanisms hindering judgment propagation at the scale of the chain. Our results contribute to the understanding of social-contagion processes, and our experimental method offers numerous new opportunities to study judgment propagation in the laboratory.
Social influence extends beyond people’s direct contacts. In recent years, a large body of research has demonstrated that judgments, feelings, and behaviors can “spread” from person to person in social networks, similarly to the propagation of infectious diseases. Social-contagion phenomena have been observed across a wide range of domains, such as public health (1–3), altruism and cooperation (4), risk perception (5), violence (6), political mobilization (7), and emotional states (8). Social contagion has been modeled in laboratory experiments (9) and described in field studies on subjects ranging from hunter-gatherer villages in Tanzania (10) to Facebook users (7, 8) and online recommendation networks (11). Behavioral contagion also serves adaptive functions in the collective behavior of animal swarms (12).
Unlike the propagation of diseases or the diffusion of information, the propagation of judgments often requires more than a single interaction between a sender and a receiver. Rather, the receiver needs to be “won over” by the sender’s judgment before adopting and eventually spreading it further (13). Various social factors that reduce the receiver’s uncertainty about the quality of the sender’s judgment can thus facilitate judgment propagation (14). For instance, being exposed to the same judgment from different sources increases the probability of its adoption (13, 15, 16). Likewise, the sender’s reputation shapes the strength of social influence (17), with reputation being treated as a proxy for judgment quality. Another factor is the history of past interactions between the sender and the receiver. Specifically, being able to repeatedly observe the good performance of a sender can reduce the receiver’s uncertainty about the quality of the sender’s judgment and consequently enhance the sender’s social influence (18).
In a collective context, the repeated transmission of a judgment from person to person can give rise to global patterns of social contagion that can be described in terms of properties such as reach, speed, and intensity. In the context of innovation diffusion and viral marketing, simple mechanisms of influence can produce adoption cascades, in which the adoption of a product propagates across a large part of the population (11, 16, 19, 20). This form of social contagion, however, is restricted to environments in which people choose from a finite set of options and in which their choice is public and thus evident to all their neighbors. The spread of a judgment arises from a different and arguably more complex process, not least because judgments are often continuous and multidimensional. In addition, people might be only partially influenced by others’ judgments (5). In fact, global cascades of judgment propagation are rarely observed. According to the three-degrees-of-influence hypothesis, judgment propagation is inherently limited to a social distance of about three people (21). That is, a person’s influence on the judgment of neighboring individuals gradually dissipates with social distance and eventually ceases to have impact beyond three degrees of separation (1, 2, 4, 7). Several behavioral mechanisms have been proposed to explain this “wall,” including the progressive deterioration of the judgment due to information distortion during social transmissions, and the fact that the social ties connecting people may not be robust across time, meaning that propagation pathways are interrupted (21). In addition, the nature of the transmission method—active teaching or simple copying, for instance—can foster or hinder propagation efficacy, as has been demonstrated in the domain of human cultural evolution (22, 23).
From the above literature, it appears that three main conditions should suffice for the emergence of long-distance judgment propagation: (i) the originator of the judgment consistently provides accurate judgments, so that observers have little uncertainty about the quality of his or her subsequent judgments; (ii) all individuals can accurately observe others’ judgments and their quality, meaning that transmission noise is minimal; and (iii) the connections between people are stable, so that propagation pathways are uninterrupted. Under these conditions, an observer B should eventually be prompted to adopt the judgment of an initiator A, who repeatedly makes accurate judgments. In the absence of information distortion, B should in turn start performing well. This should subsequently prompt a third individual C to adopt B’s—and thus indirectly A’s—judgment. If the same process is repeated across many adjacent individuals in a chain, then the judgment of A could, in principle, propagate from person to person over long social distances. However, any systematic distortion of A’s initial judgment over social transmission would make that judgment less accurate—and thus less persuasive. The increasingly distorted judgment would eventually cease to propagate. In this article, we examine whether the above three conditions are sufficient for the emergence of long-distance judgment propagation—and, if not, which other factors impede judgment propagation over long distances.
To this end, we present two studies. In study 1, we investigated—using a simple visual perception task—the conditions under which the judgment of an individual A can spread to another individual B, as B repeatedly observes the judgment and performance of A. The conventional experimental paradigm in the advice-taking literature consists of observing one-shot interactions between two strangers—the participants neither know nor repeatedly interact with one another (14, 24). In contrast, we investigated how repeated interactions shape the strength of social influence, as has been done in work on “reputation formation” (see, e.g., refs. 25 and 26). In study 2, we evaluated the collective dynamics of judgment propagation. We created unidirectional chains of six participants in which all individuals repeatedly interacted with their predecessor. That is, individual A initiated the chain, B repeatedly interacted with A, C repeatedly interacted with B, and so on up to individual F. Initially, all individuals were strangers. In each interaction round, they made an initial judgment, observed the judgment of their predecessor, potentially revised their judgment, and forwarded their final judgment to the next person in the chain. We then examined how far, under these favorable circumstances, A’s judgment would travel down the chain. The results of study 1 indicate that the influence of A on B increased gradually as the two got to know each other. However, as expected, this happened only if A performed considerably better than B. Study 2 showed that, whenever individual A (i.e., the originator of the chain) consistently rendered more accurate judgments than the rest of the chain members, waves of judgment propagation were triggered down the chain: round after round, A’s judgments traveled increasingly farther. Crucially, however, the influence of A vanished beyond a social distance of about three people. That is, A influenced individuals B, C, and D, but not E and F. By modeling the experimental results and running numerical simulations, we then show that the participants’ tendency to overweight their predecessor’s error, combined with information distortion, generates exponentially increasing delays in propagation. This, in turn, resulted in the gradual extinction of influence with social distance.
Results
Experimental Design.
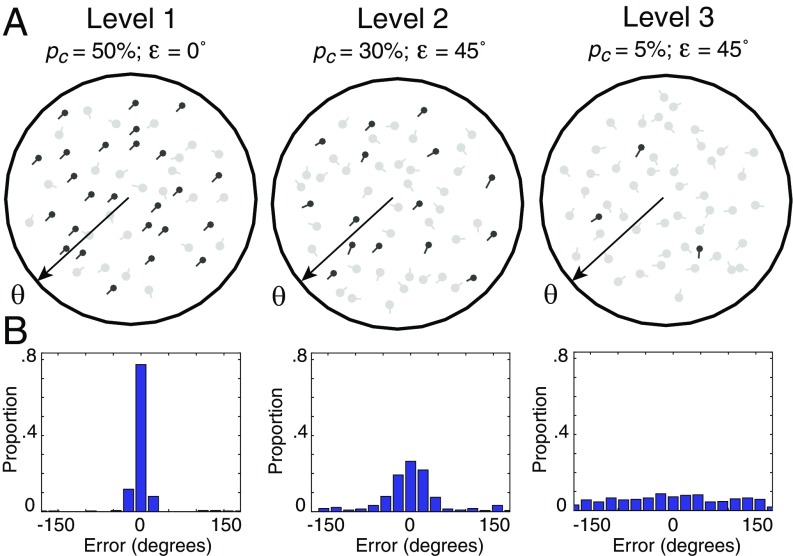
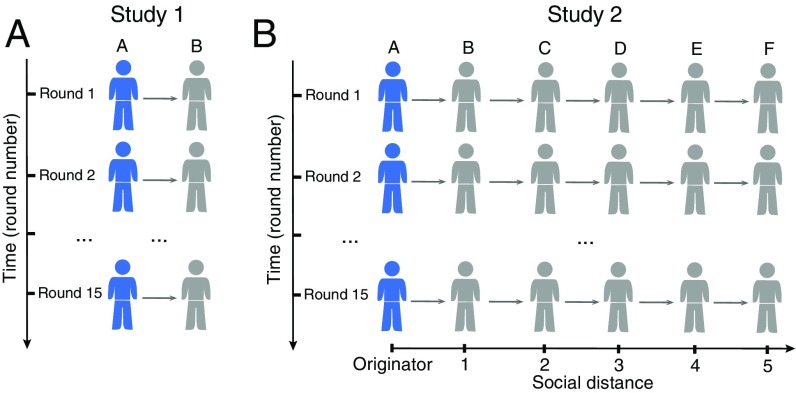
We designed a visual perception task modeled on random-dot kinematograms (27). In each round, participants observed a set of 50 dots moving on a computer screen. Some dots moved consistently in a similar direction (“correlated dots”) and others in random directions. Participants were asked to determine the main direction of the correlated dots as accurately as possible (see details in Materials and Methods, Fig. 1, and Movie S1). The correct answer was a specific angle (i.e., a continuous value between 0° and 360°). Individuals were paired with the same partner for 15 consecutive rounds (Fig. 2). In each round, individuals indicated their estimated angle by moving an arrow, then observed their partner’s estimate, and finally either revised the first estimate or discounted the advice by pressing a button. We influenced the performance level by implementing three difficulty levels (i.e., adjusting the proportion of correlated dots; Fig. 1): low (level 1), medium (level 2), and high (level 3). In every round, the correct answer was always identical for both members of the pair, but the difficulty level could differ between them. For instance, one member of a pair might experience a low difficulty level (level 1) and the other a high difficulty level (level 3). In this example, the first individual would estimate the same true angle more accurately than the second. The difficulty level that each member of the pair experienced remained constant across the 15 rounds. Participants were not informed about the difficulty level they or their partner were facing. However, they could learn about their respective levels of performance by comparing their own and their partner’s responses with the correct angle, which was displayed on screen at the end of each round. Consequently, participants could learn how accurate and thus how valuable their partner’s judgment was.
Fig. 1.
Experimental design. (A) Participants were exposed to visual stimuli consisting of a set of 50 moving dots. A proportion pc of correlated dots moved in the direction , and the remaining proportion 1 ‒ pc of uncorrelated dots moved in random directions. Here, was the true value that participants had to estimate visually and was a random deviation from the true value, sampled from the interval [‒ ] for each correlated dot (to avoid exactly parallel trajectories of the correlated dots, which would have rendered the task too easy). The three difficulty levels were characterized by different proportions of correlated dots, pc = 50%, 30%, and 5%. In addition, the deviation was set to = 0° in difficulty level 1 and to = 45° in difficulty levels 2 and 3. The black arrows show the true value in each example and were not visible to participants. During the experiment, correlated and uncorrelated dots appeared in the same color (light and dark gray are used in this figure for illustration only). See Movie S1 for animated examples. (B) The distribution of errors made by all 100 participants at each difficulty level in the absence of social influence (i.e., before any interaction occurred). The values of pc and for each difficulty level were calibrated before the experiment to yield clearly distinguishable error distributions.
Fig. 2.
Schematic representations of the two experimental setups. (A) In study 1, two individuals, A and B, were paired for 15 consecutive rounds. In each round, they separately faced the visual perception task described in Fig. 1. The correct answer was always identical for both of them, but the difficulty level could differ between them. The respective difficulty levels were fixed across the 15 rounds. In each round, individual B could reconsider her or his initial estimate after observing A’s estimate. (B) In study 2, six participants (here called individuals A, B, C, D, E, and F) were connected along a chain for 15 consecutive rounds. Each individual in the chain was paired with his or her predecessor in the chain. Otherwise, the same procedure was followed as in study 1. That is, in each round, the estimate of the originator, individual A (in blue), was shown to individual B, who could then reconsider her or his initial estimate accordingly. Individual B’s revised estimate was then shown to C, who could, in turn, reconsider her or his estimate, and so on until individual F. This process of social transmission from A to F was repeated across the 15 rounds. The originator A always experienced a low difficulty level of 1, and all subsequent participants always experienced a high difficulty level of 3.
Individual Behaviors.
In study 1, we paired an individual facing a task of difficulty level i with a partner facing a task of difficulty level j for 15 consecutive rounds. In each round, we measured the partner’s influence on the individual’s judgments. We tested six conditions by varying i in {2,3} and j in {1,2,3}. Each Si-Pj condition (individual facing a difficulty level i paired with a partner facing a difficulty level j) was repeated with 100 participants.
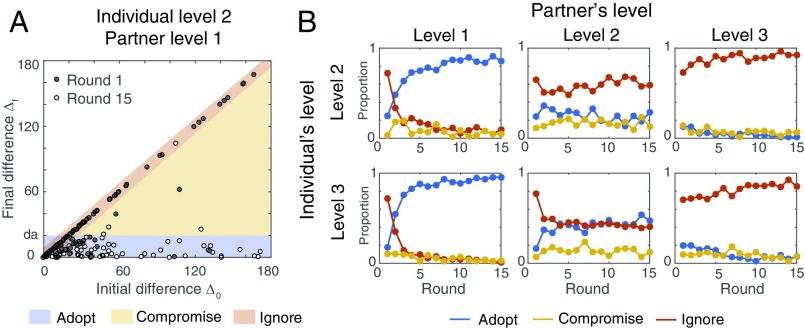
First, we measured the deviation and between the individual’s and the partner’s estimate at round r, before and after social influence occurred. Here, corresponds to the individual’s initial estimate at round ; , to the individual’s final estimate at round (after possibly revising the estimate); and , to the partner’s estimate at round . For notational simplicity, we drop the superscript r when not referring to the number of a specific round. Fig. 3A shows the values of and at rounds 1 and 15 for all 100 participants in condition S2-P1 (i.e., an individual facing a medium difficulty level paired with a partner facing a low difficulty level). In round 1, individuals tended to ignore the advice of their partner (i.e., ), but by round 15 they were strongly influenced by it (i.e., ). We defined and studied three possible revision strategies (see the color coding in Fig. 3A): “ignore” (i.e., ), “adopt” (i.e., is smaller than a small threshold value ), and “compromise” (i.e., and ). We set the value of to 20°, which corresponded approximately to the length of the mouse pointer on the screen and thus tolerated minor inaccuracies in drawing an arrow. All data points for which was lower than cannot support any conclusion and were thus not taken into account in this classification (but were included in all other analyses). Fig. 3B shows the observed proportion of participants adopting each strategy across the 15 rounds in all six conditions. When paired with a partner experiencing a low difficulty level (S2-P1 and S3-P1), individuals switched rapidly from ignore to adopt within the first few rounds of interactions. This suggests that the initial strategy of disregarding a stranger’s estimates was swiftly abandoned as an individual’s uncertainty about the quality of the partner’s performance diminished. The partner’s influence increased faster for individuals facing tasks of high difficulty level 3 than for those facing a medium difficulty level 2 (see the comparison of the S3-P1 and S2-P1 adoption curves in Fig. S1). This suggests that individuals were sensitive to the difference between their own performance and their partner’s performance, rather than just to their partner’s absolute performance. Furthermore, individuals seemed to overweight their partner’s error relative to their own (24, 25). For example, in condition S3-P2, individuals did not systematically adopt their partner’s judgment, even though their partner performed better than they did. In this condition, the partner experienced a medium difficulty level 2 and thus often made substantial estimation errors. This impaired the individual’s ability to detect that the partner’s performance was better than their own. Similarly, individuals in condition S3-P3 almost consistently ignored their partner’s judgment, despite equal performance levels.
Fig. 3.
Participant behavior in study 1. (A) Illustration of the behavioral change between round 1 (black dots) and round 15 (white dots) for all 100 participants in condition S2-P1 (individuals, S, facing a medium difficulty level of 2 paired with partners, P, facing a low difficulty level of 1). The three background colors indicate the zones corresponding to the three strategies: ignore (red), compromise (yellow), and adopt (blue). Whereas participants mostly ignored their partner’s judgment at round 1 (72% of black points in the red zone), they tended to adopt it at round 15 (85% of white points in the blue zone). (B) The proportion of participants adopting each strategy across the 15 rounds in all experimental conditions. The detailed example shown in A corresponds to the first and last rounds in the Upper Left of B.
Fig. S1.
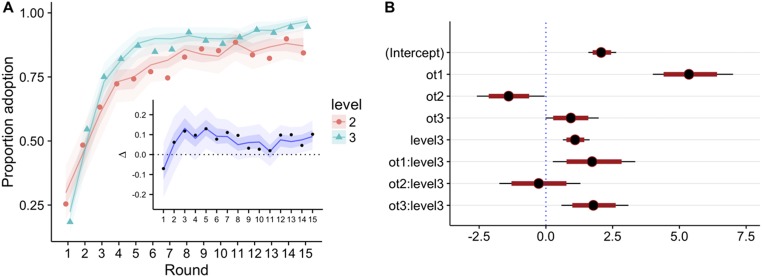
Modeling and comparison of adoption curves. Growth curve analysis was used to analyze the probability of adoption as a function of the number of the round and a participant’s difficulty level (for cases where the partner had a difficulty level of 1; see the two blue curves in Fig. 3B, left-most column). The probability of adoption was analyzed with a mixed-effects logistic regression model with fixed effects for the number of the round (cubic orthogonal polynomials), the participant’s difficulty level (2 vs. 3), and their interactions (all within participant). The model also included a random intercept for items (i.e., the true angle), participant random effects on all round-number terms, and Participant × Difficulty Level random effects on all round-number terms except the cubic trend. The model was estimated using Bayesian Monte Carlo Markov chains (MCMCs) simulations with default priors [function stan_glmer in the rstanarm R package]. (A) The proportion of adoption as a function of the number of the round and a participant’s difficulty level. Solid symbols indicate observed proportions. Solid lines show the medians of the posterior predictive distribution for the proportion of adoption (simulated using all random effects). The inner colored ribbons indicate the middle 50% of the posterior predictive distributions (i.e., first to third quartile), and the outer ribbons indicate the middle 90% (i.e., 5–95% quantile). The inline figure shows the posterior predictive distribution of the difference of proportion adopted (difficulty level 3 minus 2) per round. (B) Estimates for the fixed-effect parameters of the model: medians (points) and 80% and 95% credible intervals (thick red and thin black ranges, respectively). On the y axis, ot1, ot2, and ot3 are linear, quadratic, and cubic orthogonal polynomial terms, respectively; level3 is a dummy variable for difficulty level 3; that is, skill level 2 is the reference condition. Two sets of results stand out. First, the model indicates a positive linear (ot1) and cubic (ot3) trend as well as a negative quadratic trend (ot2) for the number of the round when participants operated at difficulty level 2. These positive linear and cubic trends were even more pronounced for difficulty level 3 (ot1:level3 and ot3:level3); the negative quadratic trend did not differ between difficulty conditions (i.e., ot2:level3 was not reliably different from zero). Second, across rounds, participants were more likely to adopt their partner’s estimate when individuals operated at difficulty level 3 compared with 2 [as indicated by the positive slope for level3; PMCMC(level3 > 0) = 1.000]; see also the inline figure in A.
Model.
Next, we modeled the above results using a computational model inspired by accounts of social reinforcement learning (28). The purpose was to establish a link between the mechanisms of influence within dyads observed in study 1 and the dynamics of judgment propagation that will be shown in study 2. For the model, we assumed that individuals assessed the performance or “quality” of their partner at the end of each round r. Initially, in the absence of any information about their partner’s performance, quality was set to the neutral value . At the end of each round r, individuals updated their perception of their partner based on the outcome of that round, as follows:
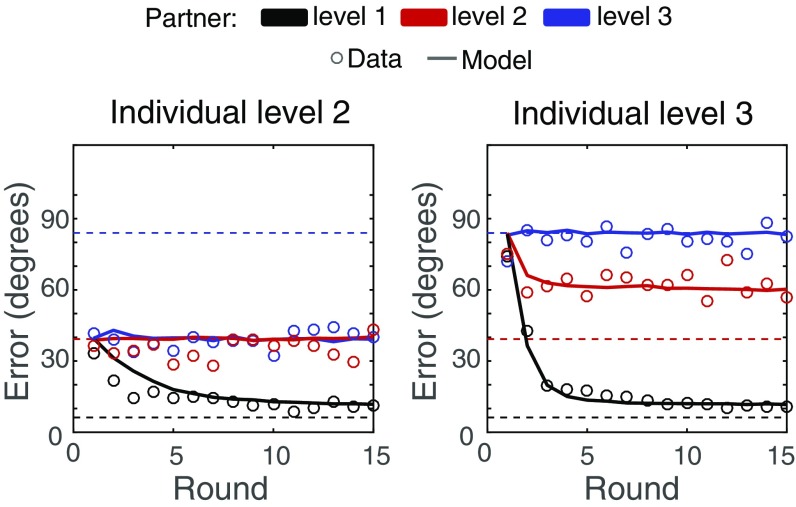
where is the error of the initial estimate made by the individual at round r, and is the error made by the partner at round r. The partner’s performance was therefore evaluated relative to the individual’s own performance, as the results of study 1 suggested. The parameter is the error-overweighting coefficient, representing the weight that individuals assigned to their partner’s errors. The model sets if individuals weighted their own and their partner’s errors equally, if individuals overweighted their partner’s errors relative to their own, and if individuals underweighted their partner’s errors relative to their own. Over time, individuals repeatedly updated the value of and could form a positive () or negative () perception of their partner’s quality, depending on the temporal sequence of relative errors experienced. After individuals observed their partner’s judgment at round r, the current value of determined which revision strategy they would select. The model stipulates two threshold values, and : it assumes that individuals ignore their partner’s judgment if , adopt it if , and compromise if . The final judgment is therefore if individuals ignore the advice; if they compromise; and if they adopt the advice. The value of accounts for the imperfection of the adoption strategy (as evident in Fig. 3A). We defined as a random value chosen in the interval [0 ], where = 20° (as in the strategy classification analysis); the sign of is negative if and positive if . We determined the model parameters , , and by simultaneously fitting the model to the aggregate behavioral curves of all six conditions shown in Fig. 3B. The best-fitting parameter values, minimizing the squared deviation from empirical data, were , , and . The fitted value of is higher than 1, indicating a considerable overweighting of the partner’s errors. The calibrated model predicts performance levels that are in good agreement with the data (Figs. S2–S4). For comparison, the same fitting procedure fixing (i.e., assigning equal weight to the individual’s and the partner’s errors) failed to fully reproduce the observed performance levels (Figs. S3 and S4).
Fig. S2.
Observed and predicted errors of final estimates for participants facing a task of difficulty level 2 (Left) and 3 (Right). Circles indicate the average observed errors and lines correspond to the average predicted values (for 1,000 simulation runs). The colors denote the level of the partner (difficulty level 1 in black, 2 in red, and 3 in blue). The dashed lines indicate the baseline error for each difficulty level (i.e., the average error of participants before any interaction occurred as shown in Fig. 1B). The complete distributions of observed and predicted errors are compared in Figs. S3 and S4.
Fig. S4.
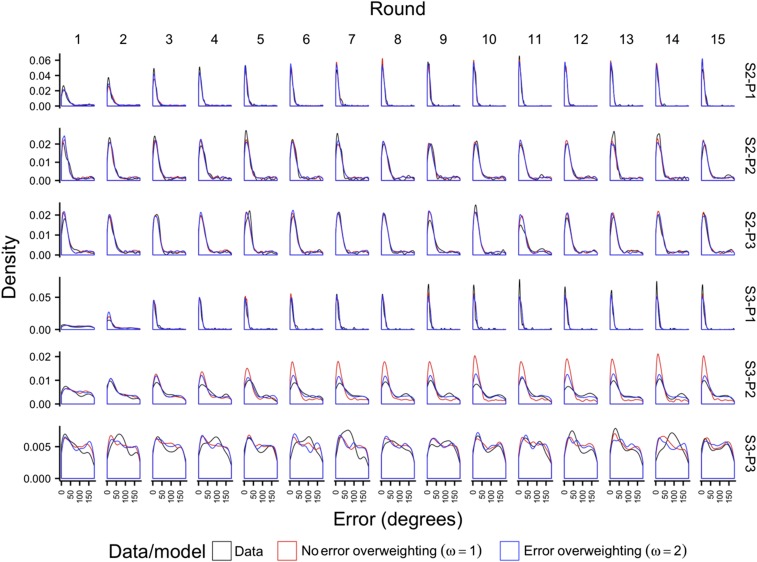
Observed error distributions and error distributions predicted by the model with and without the overweighting of the partner’s errors (i.e., , in blue, and , in red), for each of the 15 rounds and each of the six conditions. The figure shows kernel density estimates. Note that the conditions (rows) differ in the ranges of their y axes; this was done to make the differences in the flat distributions in conditions S3-P2 and S3-P3 more visible.
Fig. S3.
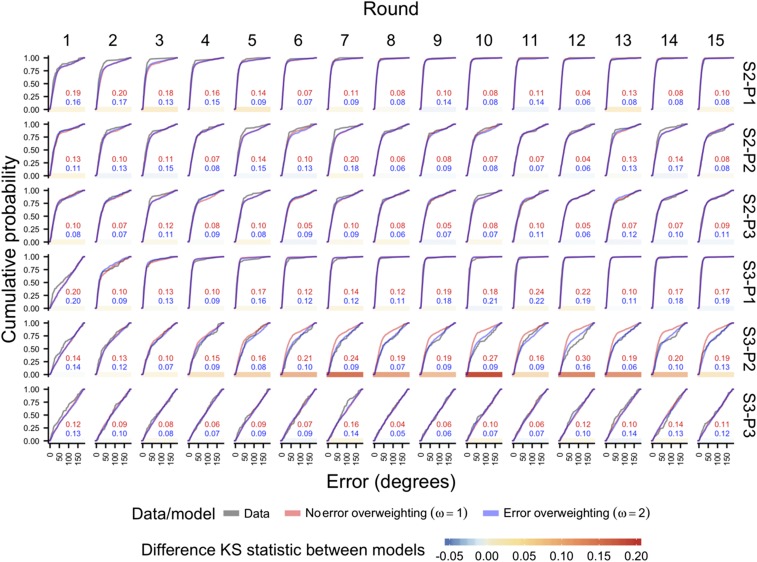
Comparison of the model performance with and without the overweighting of the partner’s errors (i.e., and ), for each of the 15 rounds and each of the six conditions. Subpanels show smoothed empirical cumulative distribution function plots for the observed errors of participants (data) and the two models. Numbers indicate the Kolmogorov–Smirnov (KS) statistic D when comparing an empirical distribution to the distributions predicted by either model. D measures the maximum distance between the cumulative distribution functions of the empirical and predicted distributions and thus indicates the misfit of either model. The color bars at the Bottom of each subpanel color-code the difference in D between the two models for that condition and round; positive numbers indicate that the model with (i.e., no error overweighting) deviated more from the observed data than the model with . The predictions are clearly superior when they include the overweighting of the partner’s errors, as the simpler model fails to reproduce the observed dynamics in condition S3-P2 (individuals, S, facing a high difficulty level of 3 paired with partners, P, facing a medium difficulty level of 2). The simpler model expects much lower errors than observed. The average values of the distributions are shown in Fig. S2.
Judgment Propagation.
In study 2, we examined the dynamics of judgment propagation in chains involving six people, A, B, C, D, E, and F (Fig. 2B). Each person in the chain was paired with their predecessor in the chain for 15 consecutive rounds. That is, in each round, the individual at position k observed the final estimate of the individual at position k ‒ 1 before entering her or his final estimate. This estimate, in turn, served as the advice given to the individual at position k + 1. The originator (individual A) had no partner and was thus never subject to social influence. A always experienced a low difficulty level of 1, whereas all subsequent individuals always experienced a high difficulty level of 3. At round 1, all individuals in the chain were strangers. However, we expected B to soon notice A’s good level of performance and to adopt A’s judgments. Consequently, we expected C to notice B’s good level of performance and to indirectly adopt A’s estimates. Round after round, we expected A’s judgments to propagate increasingly further down the chain, with F eventually performing as well as A.
We collected data for 20 independent chains, each composed of six unique participants. In each round, we measured the influence of individual A on all subsequent individuals (B to F). Social influence s was measured as follows:
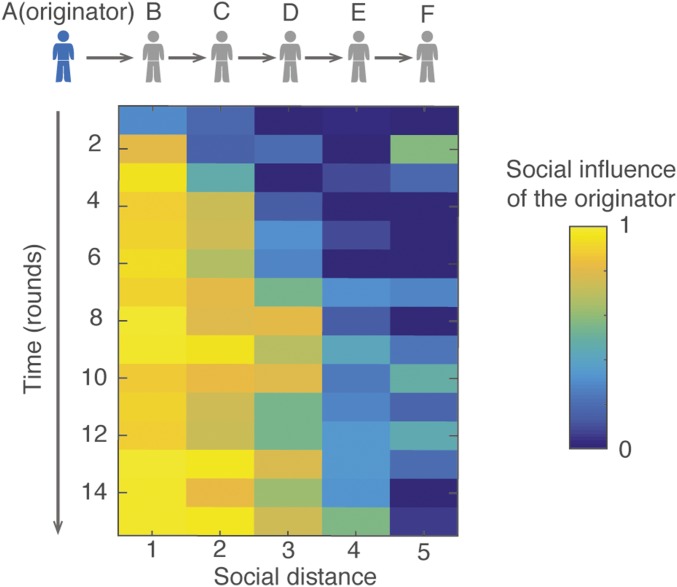
where is the observed error of the participant; the baseline error is the average error of all participants facing a task of difficulty level i before any interaction occurs. The social influence s thus measures the degree to which participants facing a high difficulty level 3 can minimize their error to that of the baseline error displayed by individual A (who faces a low difficulty level of 1), scaled by . The values of s for all rounds and social distances, averaged across all 20 chains, are shown in Fig. 4. Waves of judgment propagation are clearly visible, indicating that propagation occurred. The judgment of A spread to B after two rounds, to C after four rounds, and even to D after about eight rounds. However, individuals E and F were rarely influenced by the judgment of A within the time horizon of the experiment (i.e., 15 rounds).
Fig. 4.
Judgment propagation down the chain (study 2). Observed intensity of social influence averaged over 20 experimental chains. The color coding indicates the influence of the originator’s judgment on the final estimates of all other individuals in the chain, as a function of their social distance from the originator (x axis) and the number of the round (y axis; Fig. 2B). Individuals located one degree of separation from the originator (i.e., social distance = 1) rapidly adopted the originator’s judgments (social influence approached 1 as early as round 2). Individuals located two degrees of separation from the originator were influenced by the originator after about four rounds of interaction. Participants located at a social distance greater than three were rarely influenced by the originator.
To better understand the mechanisms underlying this propagation pattern, we conducted simulations of the same experimental setup using our model (calibrated with the fitted parameter values from study 1). We first evaluated the impact of each component of the model separately (Fig. 5A). Compared with a simple contagion model, the inclusion of information distortion curtailed the range of propagation to about 10 degrees of separation. This is obviously insufficient to explain the much shorter propagation ranges observed. However, combining information distortion with the overweighting of the partner’s errors drastically limited the propagation range to around three to four degrees of separation, consistent with our data (see the analytical calculations in Supporting Information).
Fig. 5.
Dynamic features of judgment propagation in study 2. (A) The intensity and range of social contagion after 15 rounds, assuming different propagation mechanisms (model previously calibrated in study 1): full and immediate adoption of the partner’s judgment (in black), distortion of information only (in blue), and distortion of information and error overweighting (in red). Circles correspond to experimental data. (B) Intensity and range of social contagion over 100 rounds of interactions as predicted by the model. The range of social contagion initially increased with time but eventually plateaued at a social distance of four. (C) The time delay required for social influence to travel through the chain increased exponentially with social distance. The dots indicate the model predictions (for 1,000 simulation runs), and the lines show the best exponential fit. For distances larger than four persons, the time delay exceeded 100 rounds before a weak influence (s = 0.2, in blue) appeared. Strong influence (s = 0.8, in red) could not propagate beyond a social distance of three persons because information distortion rendered the (indirect) adoption of the originator’s judgment increasingly impossible. The Inset shows the same figure with a logarithmic transformation along the y axis, confirming the exponential growth of the time delay.
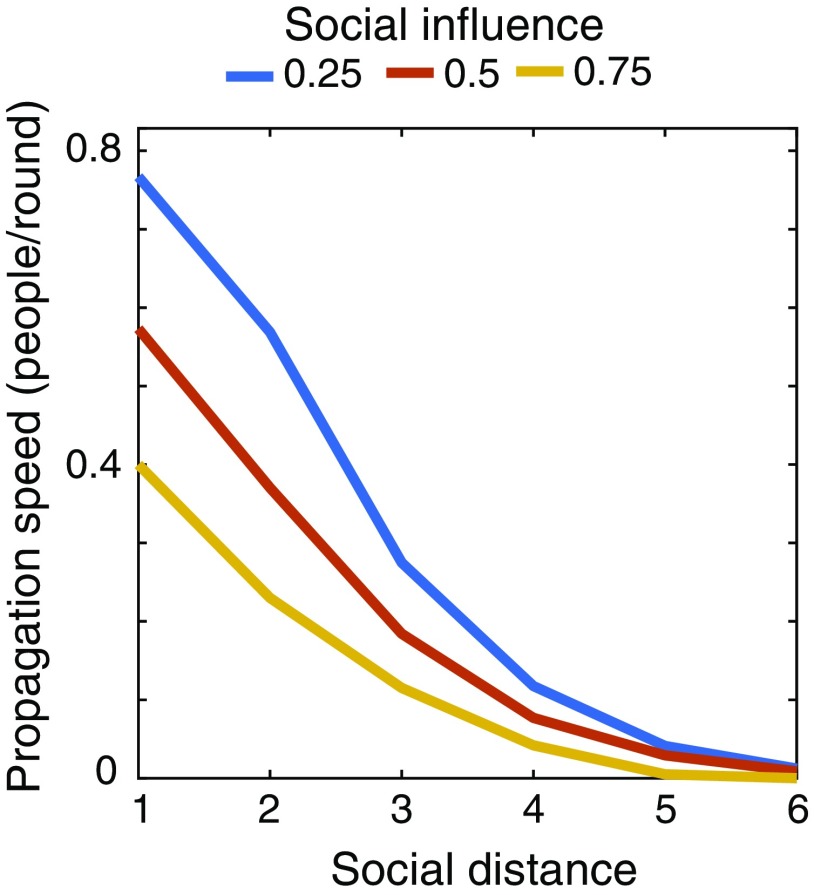
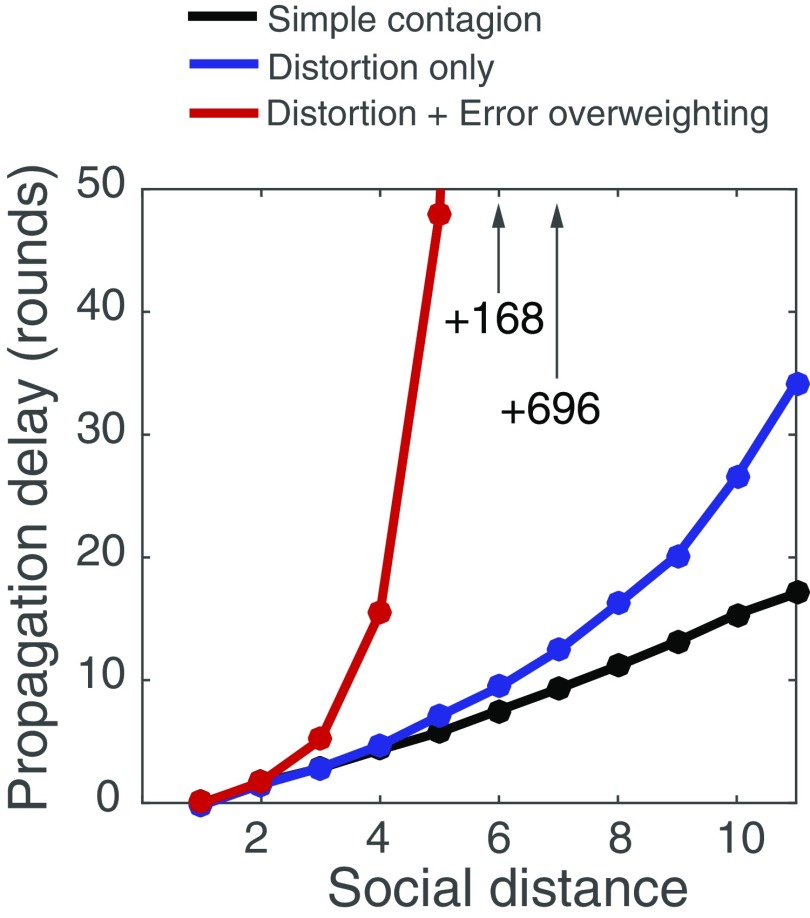
Finally, we used the model to explore the dynamics that take place over an extended time horizon. Fig. 5B shows the social influence of originator A over 100 rounds of interactions. The propagation range initially increased with the number of rounds but eventually plateaued at a social distance of approximately three degrees of separation for strong influence (s > 0.7) and four degrees of separation for moderate influence (s > 0.4). At five degrees of separation, social influence was no longer visible. We then calculated the time required until the originator’s influence traveled different social distances. As Fig. 5C shows, the time required increased exponentially with social distance. That is, the time needed to reach the next individual in the chain was almost three times longer than the time needed to reach the previous one. The contagion wave thus slowed down with social distance, and traveling further than four individuals from the source thus required an excessively large number of rounds (see the propagation speed curves in Fig. S5). An analytical exploration of the model (presented in Supporting Information) revealed that each component of the model changed the functional form of the propagation delays. In the absence of information distortion and error overweighting, propagation time increased linearly with social distance. However, the inclusion of information distortion resulted in a polynomial increase in propagation times, and the addition of error overweighting resulted in the propagation time growing exponentially, consistent with our observations (Figs. S6 and S7). Both of these factors impacted the functional form of the propagation delays.
Fig. S5.
Speed of judgment propagation as a function of the social distance from its source. The colors indicate the strength of social influence: weak (s = 0.25, in blue), intermediate (s = 0.5, in red), and high (s = 0.75, in yellow). Waves of social contagion slow down with increasing distance from the judgment source.
Fig. S6.
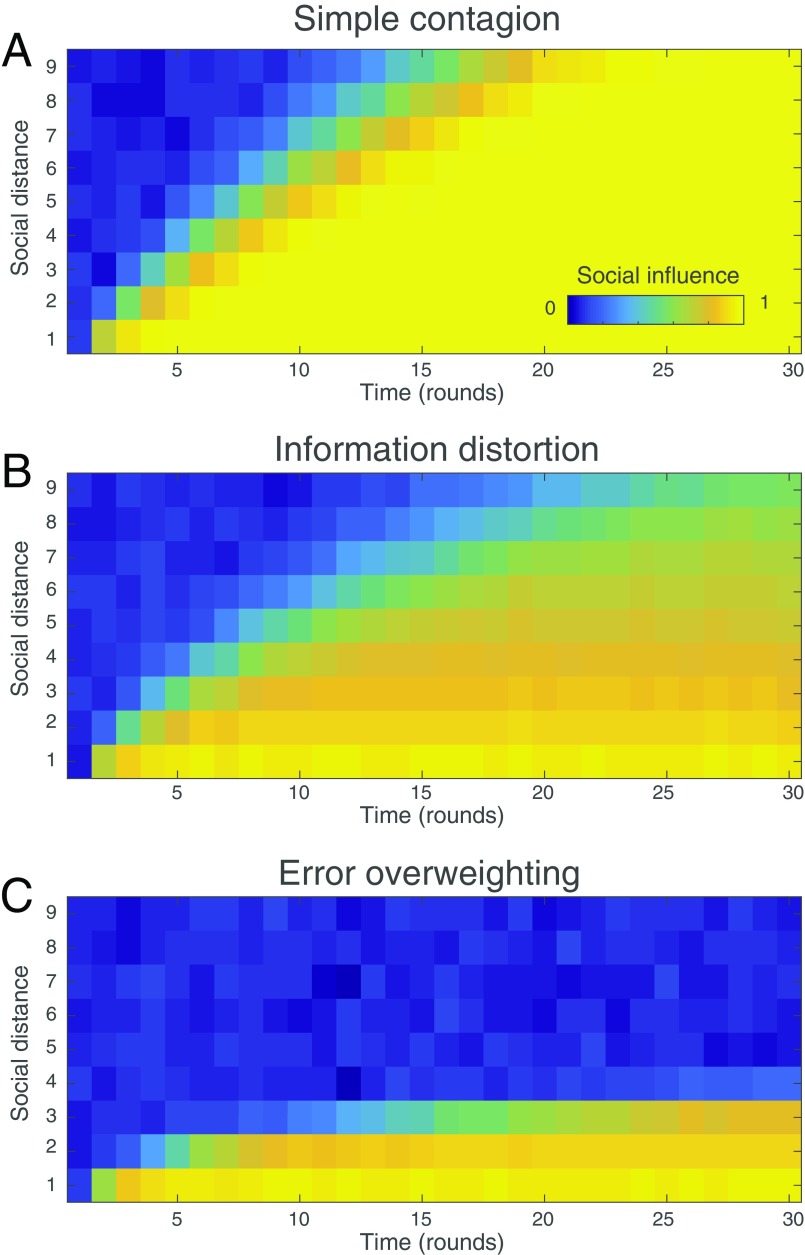
Propagation mechanisms. Social influence of the originator when assuming (A) a simple contagion effect, (B) the distortion of information, and (C) the addition of error overweighting. The color-coding indicates the strength of social influence of the originator as a function of the social distance (y axis) and the round number (x axis). Results are averaged over 1,000 simulation runs.
Fig. S7.
Propagation delays. The time delay required for social influence to travel through the chain, assuming the three mechanisms presented in Fig. S6 is shown (for 1,000 simulation runs). Although a simple contagion mechanism yields linear propagation delays (in black), the inclusion of information distortion yields a polynomial increase (in blue), and the addition of error overweighting yields exponential increase. For the red curve, the propagation delays for social distances 6 and 7 equal 168 rounds and 696 rounds, respectively.
Discussion
Social-contagion phenomena are difficult to study because they root in two intertwined layers of complexity, namely (i) that induced by the network structure and (ii) that induced by the behavioral processes that operate within the network. In this article, we disentangled both layers and examined, in detail, the behavioral processes that drive judgment propagation for a simple network structure, namely, a transmission chain. Our experimental design enabled us to trigger waves of judgment propagation down the chain and study the behavioral factors influencing propagation.
For the time window of 15 interactions and a linear, unidirectional network structure examined here, we found that judgments rarely propagated beyond a distance of about three individuals. Our numerical and analytical results suggest that judgments could propagate farther, but the time necessary to do so increases exponentially with social distance. Propagation over distances greater than three to four individuals would require (i) a consistently more accurate originator, (ii) an error-free observation of others’ performance, and (iii) a static chain structure to be maintained during several hundreds of interactions.
Our results reveal some of the factors impeding spatial propagation beyond this range. First, judgments become progressively more distorted over successive social transmissions. Such distortion may even occur when individuals are able to accurately observe others’ judgment and performance. In our behavioral data, distortion stemmed from imprecisions in imitating the partner’s judgment or from slight deliberate alterations to the partner’s judgment. Consequently, judgments tend to become gradually less accurate—and therefore less influential—as they travel further from their source. The second factor that impairs long-range propagation is the overweighting of other people’s errors [also called “egocentric discounting” (25)]. This effect has previously been described for pairs in the advice-taking and reputation formation literature (25); we have shown that it is also key to judgment propagation or lack thereof. In a pair, overweighting the partner’s errors slows down the adoption of judgments because each error committed needs to be compensated for by several good performances. In a chain, the delay is amplified at each further position: the perceived quality of individual B in the eyes of individual C decreases as long as B performs poorly and thus as long as B has not yet adopted the judgment of A. For each subsequent step down the chain, the same process repeats with longer time delays. Overweighting other people’s errors therefore contributes to the observed exponential growth of the time delays.
These results raise a number of interesting issues. Most importantly, future research should investigate how these behavioral dynamics may change in more complex network topologies (29). It is conceivable that multiple simultaneous sources of influence, as rendered possible in a more complex network, convey different judgments and may operate as sources of “noise.” If so, such noise, in turn, is likely to impair propagation. However, clustered networks with redundant ties could also expose individuals to a converging judgment originating from different pathways and thus provide social reinforcement for its adoption (15). Our experimental design is versatile. It could be adapted to examine how judgments propagate through more complex network topologies and the extent to which presently observed limitedness of judgment propagation generalizes.
When combined with recent techniques assessing the structure of a social network (30), our approach could offer an experimental microworld that eventually can help to predict where and when the results of a promotion campaign will be most visible. Clusters of people separated by fewer than three individuals are likely to respond similarly to social interventions, giving rise to the clustering of judgments within regions of social networks (19). Additional simulations that we conducted show that good performers engender longer influence pathways (Fig. S8). This “human factor”—that is, the initiator’s past performance—influences the dynamics in addition to other structural factors related to the target’s surrounding network structure, such as the node’s degree or centrality (e.g., ref. 15). In sum, the complex interplay between human factors and the structure of the social network is key to better understand the dynamics of judgment propagation.
Fig. S8.
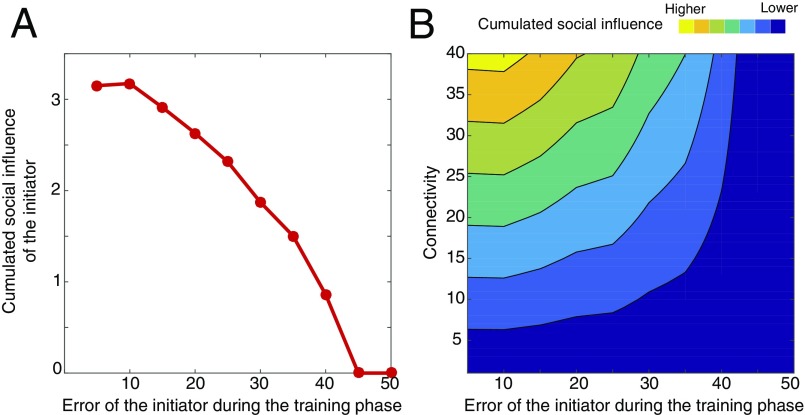
Impact of the initiator’s initial performance. (A) The initiator’s cumulated social influence decreases with increasing error of the initiator during the training phase. (B) Increasing the connectivity of the initiator enhances the reach of judgment propagation, but this effect is compensated by increasing error of the initiator during the training phase. Both high connectivity and good performances of the initiator are necessary ingredients for creating strong judgment propagation (i.e., high cumulated social influence). Simulation results are computed after a training phase of 50 rounds of interactions and averaged over 1,000 simulations. The model parameters are identical to those used in the main text, namely, , , , and .
Materials and Methods
Experimental Design.
The experimental task was to estimate the direction (i.e., angle) in which 50 dots, displayed in a circular area, moved on a computer screen (Fig. 1). The task was developed using HTML/JavaScript and SmartFoxServer. A set of 25 unique angles equidistantly distributed between 0° and 360° served as true angles. The animation was displayed at a rate of 20 frames per s. While the dots were still moving, participants indicated their estimate by using the computer mouse to place a black arrow in the circular area. Once they had confirmed their first estimate (by pressing a mouse button), the movement of the dots was interrupted and a blue arrow indicating the partner’s estimate was displayed. Participants could then use the mouse to revise the angle of their black arrow and pressed a button to confirm their final estimate. Participants who did not wish to revise their estimate could immediately press the confirmation button. Finally, the correct angle was displayed as a red arrow. Furthermore, the number of points p scored by the participant in that round was displayed. The number of points awarded was an exponentially decreasing function of the error rounded to the closest integer, where is the error on the final estimate expressed in radians. Participants could therefore score between 0 and 10 points in each round. At the end of the experiment, the total number of points was converted into monetary bonuses at a rate of €0.005 per point.
Procedure.
Data were collected between November 2015 and January 2016. The experimental procedure was approved by the Ethics Committee of the Max Planck Institute for Human Development. All participants gave informed consent to the experiment. Fifteen participants were recruited for a preliminary study in which we collected the partners’ estimates, and 100 participants were recruited for the main phase comprising studies 1 and 2 (58 males, 42 females; Mage = 25.4 y; SD = 3.7). They received a flat fee of €10 for their participation, in addition to a monetary bonus depending on performance. In the preliminary phase, we collected independent estimates from 15 participants for each of the 25 true angles, and for each of the three difficulty levels (Fig. 1 for the implementation of the difficulty levels). Thus, each participant in the preliminary study provided one estimate for each true angle at each difficulty level (75 estimates in total). Partners’ estimates in the main experiment (i.e., studies 1 and 2) were drawn from this pool of data.
In the main experiment, after receiving instructions, participants first completed five individual training rounds at each difficulty level. For study 1, they were then paired with a partner for 15 consecutive rounds (Fig. 2A). The partner was chosen randomly among the participants in the preliminary study (see above). The 15 true angles and the corresponding estimates of the chosen partner were randomly drawn from the data provided by that partner during the preliminary phase. In each round, participants first estimated the angle, then observed their partner’s estimate, and then indicated their final estimate. Subsequently, the correct angle was revealed, the participant’s total score was updated, and a new round started. After 15 rounds, participants were informed that they would be paired with a new partner and another series of 15 rounds started. This procedure was repeated six times, corresponding to the six conditions Si-Pj with i in {2,3} and j in {1,2,3}, where i is the difficulty level faced by the participant and j is the difficulty level faced by the partner. As a manipulation check, we implemented a seventh condition S1-P3, in which the individual faced a low difficulty level and the partner faced a high difficulty level. As expected, participants in this condition systematically disregarded their partner’s judgment because they could easily provide an accurate answer of their own. The results of this condition are not reported in the manuscript. For study 2, each participant participated in another series of 15 rounds in the chain setup (Fig. 2B). A new chain was started every five participants (i.e., at participant numbers 1, 6, 11, and so on). In 15 consecutive rounds, the first participant in each chain (e.g., participant number 1) was paired with a partner (the originator) randomly drawn from the participants in the preliminary study. The 15 final estimates given by that participant served as the 15 pieces of advice that the next participant (participant 2) received. This procedure was repeated until the end of the chain was reached (e.g., until participant 5 was paired with participant 4) and a new chain started (e.g., participant 6 was paired with a random partner from the preliminary study). In this way, we collected a total of 20 independent chains. All participants in the chains experienced the highest difficulty level (except for the originator of the chain, who was drawn from the preliminary study and experienced a low difficulty level). In total, participants took part in eight series of 15 rounds: seven corresponding to the seven Si-Pj conditions in study 1, and one corresponding to the chain setup in study 2. The order of the eight conditions was randomized, that is, the position of each condition in the experiment was counterbalanced across participants. Finally, all participants completed eight additional series of 15 rounds for another study, in which they faced two or three partners at the same time. The results of this study are not reported in the present paper. The experiment lasted about 60 min in total.
Analytical Calculation of the Propagation Delays
In this section, we examine analytically and numerically the role of (i) the distortion of information and (ii) the error overweighting (also called “egocentric discounting” in ref. 26) on the dynamics of judgment propagation and their impact on the nature of the propagation delays.
Our experimental results have shown that individuals assess the performance of their partner relative to their own. That is, individual B will adopt individual A’s judgment if B believes that A performs better than her with a sufficiently high degree of certainty. Formally, we have described this process as follows: at the end of each round , individuals update their perceived quality of their partner based on the outcome of that round. In the main text, we defined as follows:
where represents the estimation errors made by the focal individual and represents the estimation errors made by his or her partner , at round . The parameter is the error-overweighting coefficient. Initially, the perceived quality is set to . Hence, if the partner performs better than the focal individual , the perceived quality gradually increases over rounds. On the contrary, if performs worse than , the perceived quality decreases over rounds. If reaches a certain positive threshold value, adopts ’s judgment.
In the following, we will rely on this model to examine information distortion and the error-overweighting effect impact on the nature of the propagation delays in a chain where the first individual (the “originator”) faces an easy task and all proceeding individuals face a difficult task (i.e., as in our chain setup in study 2).
Simple Contagion.
In this first, simple scenario, we assume no information distortion and no error overweighting. That is, the parameter is set to in the equation. Under these conditions, when two individuals and have equal performances (i.e., when , the equation leads to . That is, the perceived quality of in the eyes of stays constant as long as and perform equally.
For instance, if the individual B needs rounds to adopt A’s judgment and thus sends a series of inaccurate judgments to C during the first rounds, then the perceived quality of B in the eyes of C stays at the neutral value 0 during these first rounds. Once B adopts A’s judgment and starts sending accurate judgments to C, the perceived quality of B in the eyes of C starts increasing immediately above 0. Thus, the time needed for C to adopt B’s judgment once B starts performing good is identical to the time that B needed to adopt A’s judgment (i.e., rounds). Therefore, the length of the preceding series of noisy judgments sent by B does not impact the adoption time of C.
Consequently, in this simple contagion model, if a judgment needs rounds to travel from A to B, it will require another rounds to travel from B to C, and rounds to travel from the nth to the (n + 1)th individual. The total propagation time required for a judgment to travel from the originator A to the nth individual is rounds. The propagation delay, therefore, increases linearly with the social distance n (Figs. S6A and S7).
Distortion of Information.
Let us now examine the impact of the distortion of information (while still assuming no error overweighting, i.e., ). In this second scenario, the judgment undergoes further degradation every time it is transmitted from one individual to the next. As a consequence, when an individual adopts the judgment of its predecessor , the error made by remains slightly higher than the error initially made by .
At the first transmission in the chain (i.e., between A and B), the difference is high because the error of A is close to 0 and the error of B is high. Hence, the perceived quality of A in the eyes of B increases fast, leading to the rapid adoption of A’s judgment. Let us call the number of rounds needed before B adopts A’s judgment (corresponding to the number of rounds needed before the perceived quality reaches the adoption threshold).
Once B has adopted A’s judgment, the error of B remains higher than the original error of A due to the information distortion. Thus, at the next transmission between B and C, the difference will be smaller than it was when the judgment propagated from A to B. Consequently, the perceived quality of B in the eyes of C will increase at a slower pace. Eventually, will reach the adoption threshold and C will adopt B’s judgment, but the adoption time will be longer than it was at the first transmission. Calling the adoption delay caused by the information distortion, the judgment will need rounds to travel from B to C.
Analogously, the judgment that C adopts from B has undergone two successive distortions. Once C adopts B’s judgment, the perceived quality of C in the eyes of D starts increasing in turn, but slower than at the previous transmission. The time needed before the judgment propagates from C to D is now rounds because it has undergone two distortions when it reaches C (assuming the delays caused by the distortion add up linearly).
More generally, the judgment will need rounds to travel from the nth to the (n + 1)th individual. In total, the judgment will need rounds to travel persons away from A, which is equivalent to , and is a nonlinear function of the social distance . In this scenario, the propagation delay increases in polynomial time with the social distance (Figs. S6B and S7).
Error Overweighting.
Finally, let us examine the impact of the error overweighting. As we observed in our experiment (and is established in extant literature; see ref. 26), people tend to overweight their partner’s errors relative to their own. Based on the empirical observations, we estimated the error-overweighting coefficient to be . The crucial effect of error overweighting is that, as long as an individual performs equally to her partner, the perceived quality of that partner decreases. When and , the term is negative (except when , that is, when two excellent performers interact).
In other words, if B needs rounds to adopt A’s judgments and thus sends a series of inaccurate judgments to C during the first rounds, then the perceived quality of B in the eyes of C keeps decreasing during rounds, even though C does not perform any better than B. Once B adopts A’s judgment and starts sending reliable signals to C, the perceived quality of B in the eyes of C is lower than 0. Therefore, C needs to overcome the noisy history of B before the perceived quality becomes positive again and can eventually reach the adoption threshold.
Formally, let be the number of rounds needed for the judgment to travel from the originator to the individual, we have the following:
In addition, more generally:
This recursive time series produces exponentially growing sums that equal
In this scenario, the total propagation time is therefore a power function of (i.e., an exponential growth; Figs. S6C and S7). Note that, for simplification, we ignored the additional delays induced by the distortion of information, which grow much slower (i.e., polynomial growth) and thus become negligible once n increases.
In conclusion, each component of the model has a different qualitative impact on the nature of the propagation delays, which is confirmed by numerical simulations in Figs. S6 and S7.
Enhancing Judgment Propagation
In this section, we explore numerically some additional properties of judgment propagation based on the characteristics of the originator of the judgment.
In contrast to our experimental setup, which assumed that the members of a chain are complete strangers at the beginning of the process, real-world communication chains are mostly composed of people who already know each other well because they share a common history of past interactions. Real-world social networks are thus comparable to the state of our experimental chains after many rounds of interactions. To account for this fact, we created chains of six individuals (denoted A, B, C, D, E, and F) and “trained” the chains during 50 consecutive rounds (corresponds to a delay after which the adoption curves have flattened; Fig. 5B in the main text). During this training phase, each individual in the chain could observe and possibly adopt the judgment of the preceding individual (i.e., as in our previous simulation setup). In such a way, we produced situations where the individuals know their predecessor well, which is comparable to real-world situations. After this training phase (i.e., at round 51), we injected a signal in A and measured how it impacted the judgments of B, C, D, E, and F.
First, we tested the extent to which the performance of A during the training phase impacted the reach of A’s judgment on the chain. For this, we varied the estimation error made by A during the initial 50 rounds of the training phase between (low error, comparable to the difficulty level 1 in the experiment) to (intermediate error, comparable to the difficulty level 2 in the experiment). In each case, we measured, at the end of the training phase, the cumulated social influence that A has on all of the other individuals: , where is the social influence that A has on the judgment of X, calculated according to the equation given in the main text.
The results are shown in Fig. S8A. The higher the error of A during the training phase, the weaker the overall social impact of the intervention targeted at individual A on the rest of the chain. In practice, this result implies that targeting an individual who is perceived by her peers as being competent in a particular domain would boost the propagation of the desired judgment over a larger social horizon (even influencing those who do not know the target person directly).
It is also interesting to examine the interplay between the originator’s performance and its degree of connectivity (i.e., how many other persons are directly connected to A). In fact, a well-known result from the literature suggests that targeting individuals with a high degree of connectivity is an efficient propagation strategy (see, e.g., ref. 17). In fact, if A has direct influence on two individuals, B and B′, then his or her judgment should propagate along two chains of influence simultaneously: to C and D, but also to C′ and D′, thus influencing twice as many individuals. Although high connectivity diffuses the judgment through many chains in parallel, high performance diffuses the judgment farther in each chain. Clearly, the influence of A is stronger when both criteria are maximized. However, a compensation effect exists: high connectivity with low performance might be as inefficient as high performance with low connectivity, which is indeed what additional simulations show (Fig. S8B).
In sum, we have shown that the reach of judgment propagation is enhanced when the originator of the judgment is recognized by her peers as being competent. Although this effect can be counterbalanced by a low degree of connectivity, the opposite is also true: targeting an individual with a high degree of connectivity is only efficient if that individual also exhibits a history of good performances.
Supplementary Material
Acknowledgments
We thank Larissa Conradt and Winnie Poel for fruitful discussions and early contributions to the project. We are grateful to Anita Todd and Susannah Goss for editing the manuscript. This research was supported by a grant from the German Research Foundation as part of the priority program on “New Frameworks of Rationality” (SPP 1516) awarded to R.H. (HE 2768/7-2). The funders had no role in study design, data collection and analysis, decision to publish, or preparation of the manuscript.
Footnotes
The authors declare no conflict of interest.
This article is a PNAS Direct Submission.
This article contains supporting information online at www.pnas.org/lookup/suppl/doi:10.1073/pnas.1611998114/-/DCSupplemental.
References
- 1.Christakis NA, Fowler JH. The spread of obesity in a large social network over 32 years. N Engl J Med. 2007;357:370–379. doi: 10.1056/NEJMsa066082. [DOI] [PubMed] [Google Scholar]
- 2.Christakis NA, Fowler JH. The collective dynamics of smoking in a large social network. N Engl J Med. 2008;358:2249–2258. doi: 10.1056/NEJMsa0706154. [DOI] [PMC free article] [PubMed] [Google Scholar]
- 3.Centola D. An experimental study of homophily in the adoption of health behavior. Science. 2011;334:1269–1272. doi: 10.1126/science.1207055. [DOI] [PubMed] [Google Scholar]
- 4.Fowler JH, Christakis NA. Cooperative behavior cascades in human social networks. Proc Natl Acad Sci USA. 2010;107:5334–5338. doi: 10.1073/pnas.0913149107. [DOI] [PMC free article] [PubMed] [Google Scholar]
- 5.Moussaïd M, Brighton H, Gaissmaier W. The amplification of risk in experimental diffusion chains. Proc Natl Acad Sci USA. 2015;112:5631–5636. doi: 10.1073/pnas.1421883112. [DOI] [PMC free article] [PubMed] [Google Scholar]
- 6.Slutkin G. Contagion of Violence: Workshop Summary. National Academy Press; Washington, DC: 2012. Violence is a contagious disease; pp. 94–111. [Google Scholar]
- 7.Bond RM, et al. A 61-million-person experiment in social influence and political mobilization. Nature. 2012;489:295–298. doi: 10.1038/nature11421. [DOI] [PMC free article] [PubMed] [Google Scholar]
- 8.Kramer AD, Guillory JE, Hancock JT. Experimental evidence of massive-scale emotional contagion through social networks. Proc Natl Acad Sci USA. 2014;111:8788–8790. doi: 10.1073/pnas.1320040111. [DOI] [PMC free article] [PubMed] [Google Scholar]
- 9.Suri S, Watts DJ. Cooperation and contagion in web-based, networked public goods experiments. PLoS One. 2011;6:e16836. doi: 10.1371/journal.pone.0016836. [DOI] [PMC free article] [PubMed] [Google Scholar]
- 10.Apicella CL, Marlowe FW, Fowler JH, Christakis NA. Social networks and cooperation in hunter-gatherers. Nature. 2012;481:497–501. doi: 10.1038/nature10736. [DOI] [PMC free article] [PubMed] [Google Scholar]
- 11.Leskovec J, Adamic L, Huberman B. The dynamics of viral marketing. ACM Trans Web. 2007;1:5. [Google Scholar]
- 12.Couzin I, Krause J. Self-organization and collective behavior in vertebrates. Adv Stud Behav. 2003;32:1–75. [Google Scholar]
- 13.Centola D, Macy M. Complex contagions and the weakness of long ties. Am J Sociol. 2007;113:702–734. [Google Scholar]
- 14.Bonaccio S, Dalal RS. Advice taking and decision-making: An integrative literature review, and implications for the organizational sciences. Organ Behav Hum Decis Process. 2006;101:127–151. [Google Scholar]
- 15.Centola D. The spread of behavior in an online social network experiment. Science. 2010;329:1194–1197. doi: 10.1126/science.1185231. [DOI] [PubMed] [Google Scholar]
- 16.Watts D, Dodds P. Influentials, networks, and public opinion formation. J Consum Res. 2007;34:441–458. [Google Scholar]
- 17.Taylor SJ, Muchnik L, Aral S. 2014 Identity and Opinion: A Randomized Experiment. Available at dx.doi.org/10.2139/ssrn.2538130. Accessed March 20, 2017.
- 18.Aral S, Walker D. Tie strength, embeddedness, and social influence: A large-scale networked experiment. Manage Sci. 2014;60:1352–1370. [Google Scholar]
- 19.Castellano C, Fortunato S, Loreto V. Statistical physics of social dynamics. Rev Mod Phys. 2009;81:591–646. [Google Scholar]
- 20.Bikhchandani S, Hirshleifer D, Welch I. A theory of fads, fashion, custom, and cultural change as informational cascades. J Polit Econ. 1992;100:992–1026. [Google Scholar]
- 21.Christakis NA, Fowler JH. Social contagion theory: Examining dynamic social networks and human behavior. Stat Med. 2013;32:556–577. doi: 10.1002/sim.5408. [DOI] [PMC free article] [PubMed] [Google Scholar]
- 22.Morgan TJH, et al. Experimental evidence for the co-evolution of hominin tool-making teaching and language. Nat Commun. 2015;6:6029. doi: 10.1038/ncomms7029. [DOI] [PMC free article] [PubMed] [Google Scholar]
- 23.Kempe M, Mesoudi A. Experimental and theoretical models of human cultural evolution. Wiley Interdiscip Rev Cogn Sci. 2014;5:317–326. doi: 10.1002/wcs.1288. [DOI] [PubMed] [Google Scholar]
- 24.Soll JB, Larrick RP. Strategies for revising judgment: How (and how well) people use others’ opinions. J Exp Psychol Learn Mem Cogn. 2009;35:780–805. doi: 10.1037/a0015145. [DOI] [PubMed] [Google Scholar]
- 25.Yaniv I, Kleinberger E. Advice taking in decision making: Egocentric discounting and reputation formation. Organ Behav Hum Decis Process. 2000;83:260–281. doi: 10.1006/obhd.2000.2909. [DOI] [PubMed] [Google Scholar]
- 26.Harvey N, Fischer I. Development of experience-based judgment and decision making: The role of outcome feedback. In: Betsch T, Haberstroh S, editors. The Routines of Decision Making. Lawrence Erlbaum; Mahwah, NJ: 2005. pp. 119–137. [Google Scholar]
- 27.Newsome WT, Paré EB. A selective impairment of motion perception following lesions of the middle temporal visual area (MT) J Neurosci. 1988;8:2201–2211. doi: 10.1523/JNEUROSCI.08-06-02201.1988. [DOI] [PMC free article] [PubMed] [Google Scholar]
- 28.Biele G, Rieskamp J, Gonzalez R. Computational models for the combination of advice and individual learning. Cogn Sci. 2009;33:206–242. doi: 10.1111/j.1551-6709.2009.01010.x. [DOI] [PubMed] [Google Scholar]
- 29.Newman MEJ. Models of the small world. J Stat Phys. 2000;101:819–841. [Google Scholar]
- 30.Onnela J-P, et al. Structure and tie strengths in mobile communication networks. Proc Natl Acad Sci USA. 2007;104:7332–7336. doi: 10.1073/pnas.0610245104. [DOI] [PMC free article] [PubMed] [Google Scholar]
Associated Data
This section collects any data citations, data availability statements, or supplementary materials included in this article.


