Abstract
Research in neurooncology traditionally requires appropriate in vivo animal models, on which therapeutic strategies are tested before human trials are designed and proceed. Several reproducible animal experimental models, in which human physiologic conditions can be mimicked, are available for studying glioblastoma multiforme. In an ideal rat model, the tumor is of glial origin, grows in predictable and reproducible patterns, closely resembles human gliomas histopathologically, and is weakly or nonimmunogenic. In the current study, we used MRI and histopathologic evaluation to compare the most widely used allogeneic rat glioma model, C6-Wistar, with the F98-Fischer syngeneic rat glioma model in terms of percentage tumor growth or regression and growth rate. In vivo MRI demonstrated considerable variation in tumor volume and frequency between the 2 rat models despite the same stereotactic implantation technique. Faster and more reproducible glioma growth occurred in the immunoresponsive environment of the F98-Fischer model, because the immune response is minimized toward syngeneic cells. The marked inability of the C6-Wistar allogeneic system to generate a reproducible model and the episodes of spontaneous tumor regression with this system may have been due to the increased humoral and cellular immune responses after tumor implantation.
Glioblastoma multiforme is the most common form of primary brain tumor; its aggressive, treatment-refractory nature make it one of the most lethal cancers.12 Several reproducible animal experimental models of glioblastoma multiforme, in which features of human tumor physiology can be reproduced, are available.6,15 Although rat glioma models do not reproduce human glioblastoma multiforme conditions perfectly, they are the most similar and versatile options available.
Among glioma experimental models, the most widely used are orthotopic models. Although no current glioma model fully recapitulates the genomic and phenotypic signatures of human tumors, xenografts are well established for studying mechanisms determining tumor formation, growth, and progression. However, because they typically are established in athymic animals, xenograft models have the pitfall of not reproducing natural immune response, which can be important in the evaluation of appropriate therapy.9
For studies in animals with an intact immune system, allogeneic glioma models have been widely used and incorporate the ‘immune-privileged’ state of the CNS, its lack of conventional lymphatics, the presence of the blood–brain barrier, and the presumed paucity of antigen-presenting cells within the neural parenchyma.16 Our understanding of the immunoregulatory system of the CNS has expanded greatly over the past decade. Many components of the immune system are now known to play key roles in the CNS. In fact, immunocompetent cells occur within the brain parenchyma, where they reportedly provide surveillance and allow the brain to mount an immunologic response in association with the peripheral mechanisms of immunity, including both cellular and humoral components.8 Furthermore, even when the endothelial cells of the blood–brain barrier express only low levels of the adhesion molecules required for lymphocyte emigration, activated T cells pass through the blood–brain barrier and infiltrate the brain.4 Thus an immune response can be generated toward stereotactically implanted cells in allogeneic glioma models. The most widely used allogeneic rat glioma model is the C6-Wistar model, which our group has used to evaluate the tumor presence through histopathology only.13 Other authors have shown that this model generates pronounced humoral and cellular immune responses after tumor implantation, leading to spontaneous tumor regression.14 In contrast, the syngeneic F98-Fischer model develops a glioma in which tumor cells originate in the same strain as the host and are therefore less immunogenic .2 The goal of our current study is to use MRI and histopathology to compare the most widely used allogeneic rat glioma model, C6-Wistar, with the F98-Fischer syngeneic rat glioma model in terms of percentage tumor growth or regression and tumor growth rate.
Materials and Methods
Rats.
Housing and experimental procedures were in accord with European Directive (2010/63/EU) and Italian law (DL 26/2014) regulating the use of animals for scientific purposes and were approved by the local bioethics committee. Male Wistar (n = 24) and Fischer (n = 8) rats (Rattus norvegicus; weight, 200 to 250 g; Charles River, Wilmington, MA) were used. The rats were pair-housed under standard conditions of 22 ± 1 °C, a 12:12-h light:dark cycle (lights on, 0700), and unrestricted access to food and water.
Cell culture.
C6 cells.
Rat C6 glioma cells from 2 different sources (ATCC, Rockville, MD [C6-ATCC cells], and Interlab Cell Line Collection, Biotechnology Department, National Institute for Cancer Research, Genoa, Italy [C6-ICLC cells]) were grown as adherent monolayers in T75 flasks at 37 °C in Ham F12 medium supplemented with 10% fetal calf serum, 1% glutamine, and 1% antibiotic–antimycotic solution. On the day of surgery, cells were trypsinized, centrifuged, counted, and resuspended at 106 cells in 2 μL 1% agar in PBS. A trypan blue exclusion test was performed to assess cell viability before implantation; cell viability exceeded 95% in each experiment.10
F98 cells.
Rat F98 glioma cells were obtained from LGC Standards (Milan, Italy) and maintained in DMEM supplemented with 10% FBS and 1% antibiotic–antimycotic solution in a humidified 37 °C incubator gassed with 5% CO2. On the day of surgery, cells were trypsinized, centrifuged, counted, and resuspended at 105 cells in 2 μL 1% agar in DMEM. A trypan blue exclusion test was performed to assess cell viability before implantation; cell viability exceeded 95% in each experiment.18
Experimental protocol.
Rats were allocated in 3 groups: 13 Wistar rats received C6-ATCC glioma cells, 11 Wistar rats received C6-ICLC glioma cells, and 8 Fischer rats received F98 glioma cells. The surgical approach and cell injection were performed by the same operator for all 3 groups.
Rats were anesthetized by using 1.5% to 2.5% isoflurane and 0.8 L/min oxygen and then fixed in a stereotactic apparatus. Wistar rats each received 106 C6 glioma cells in 2 μL 1% agar in PBS, whereas Fischer rats were each injected stereotactically with 105 F98 glioma cells in 2 μL 1% agar in DMEM. To this end, a 1.2-mm burr hole was drilled into the right side of the skull (2.5 mm anterior and 2 mm lateral to bregma) to expose the dura mater. By using a microliter syringe equipped with a 26-gauge needle and connected to the manipulating arm of the stereotactic apparatus, glioma cells were injected into the caudate nucleus at a depth of 6 mm from the dura mater over a 5-min period.
The analgesic ketoprofen was administered at dosages of 2.5 mg/kg once daily every 48 h for first and second weeks after surgery; 5 mg/kg daily every 48 h for the third week; and then 5 mg/kg daily for the remainder of the experiment. The rats were routinely housed and monitored daily for neurologic symptoms and signs of cognitive and motor impairment, such as lethargy, hemiplegia, and weight loss. At the end of the last MRI (day 30 for Wistar rats; day 11 for Fischer rats), the animals were anesthetized with tiletamine–zolazepam (0.1 mL/kg; Zoletil 100, Virbac, Carros, France) and euthanized with CO2.
In vivo monitoring.
Glioma growth was monitored on days 20 and 30 after implantation in groups 1 and 2 (Wistar rats) and on days 7, 9, and 11 after implantation in Fischer rats by using MRI with a high-field (7 Tesla) horizontal bore magnet (Pharmascan, Bruker, Karlsruhe, Germany). Rats were anesthetized with 2% isoflurane in an oxygen:air mixture (1:1) at a flow rate of 3 L/min and placed in an MR probe in a supine position. The respiration rate (normal range, 30 to 50 breaths/min) was monitored throughout the experiment by using an abdominal pneumatic pillow. For Wistar rats, T2-weighted images (30 transverse slices; slice thickness, 1.5 mm; field of view, 5.0 × 5.0 cm2; matrix, 256 × 256 pixels) were acquired in trasversal and dorsal planes by using a rapid acquisition with relaxation enhancement (RARE) sequence (repetition time, 3064 ms; echo time, 35.5 ms; total acquisition time, 3.14 min). For Fischer rats, T1-weighted images (15 transverse slices; slice thickness, 1.5 mm; field of view, 5.0 × 5.0 cm2; matrix, 128 × 128 pixels) were in addition acquired by using a multislice spin–echo sequence (repetition time, 400 ms; echo time, 8.4 ms; number of averages, 6) in trasversal and dorsal planes after intravenous injection of 0.5 mmol/kg gadobenate dimeglumine into the tail vein.
MRI findings were classified as positive when focal measurable hyperintensity was present at the site of the injection; suspected, when slight and diffuse hyperintensity was present at the end or along the needle insertion tract in the absence of a mass lesion effect; and negative, when no hyperintensity was present at the site of injection. When tumor was visible, tumor volume was measured (Paravision 5.0 software, Bruker) and calculated as the sum of tumor areas measured by manual outlining of each slice of the T1- and T2-weighted datasets, multiplied by the slice thickness. All the images were assessed blinded by 2 of the authors (AV and ML), and discordant cases were reviewed until a consensus was reached.
The results of the last MRI acquisition available for each rat were compared with those from the haematoxylin- and eosin-stained histopathologic sections.
Histology and immunohistochemistry.
After euthanasia, all rats underwent complete necropsy. Brains were collected and stored in 10% neutral buffered formalin for histologic evaluation. Slide sections (thickness, 5 mm) were obtained by using a microtome (Leica Microsystems, Wetzlar, Germany) and stained with hematoxylin and eosin. Histologic features were classified as positive when a tumor mass was present and negative when no tumor was detected. All the slides were assessed blinded by 2 of the authors (EB and MTC) using light microscopy, and discordant cases were reviewed under a multihead microscope until a consensus was reached.
Selected slides underwent immunohistochemical staining with polyclonal antibodies for Ki67 (dilution, 1:100; catalog no. M7240; Dako, Carpinteria, CA) and glial fibrillary acidic protein (GFAP; dilution, 1:2000; rabbit anticow, catalog no. Z0334, Dako). Immunohistochemical staining was performed by using the labeled streptavidin–biotin method (LSAB and System HRP Dako LSAB 2 System–HRP for use on rat specimens, Dako, Milan, Italy). Sections were heated at 98 °C for 25 min in sodium citrate buffer (0.01 M, pH 6.0) for antigen retrieval. Endogenous peroxidase activity can be quenched incubating the specimen for 5 min in 3% hydrogen peroxide at room temperature. Slides were then incubated overnight with the primary antibodies in a humidified chamber at 4 °C followed by sequential 10-min incubations with biotinylated link antibody and peroxidase-labeled streptavidin. The reaction was visualized by using 3,3′-diaminobenzidine tetrahydrochloride (Sigma–Aldrich, St Louis, MO). Nuclei were counterstained with hematoxylin and eosin. Positive and negative immunohistochemistry controls were routinely used. Glioma cell proliferation was assessed by counting the percentage of Ki67-positive glioma cell nuclei in 5 independent high-power (magnification, 200×) fields per rat.11
The Shapiro–Wilk test was used to establish the normality or nonnormality of distribution. Data were analyzed by one-way ANOVA followed by the Tukey–Kramer test; P values less than 0.05 were taken to indicate statistical significance.
Results
In vivo monitoring.
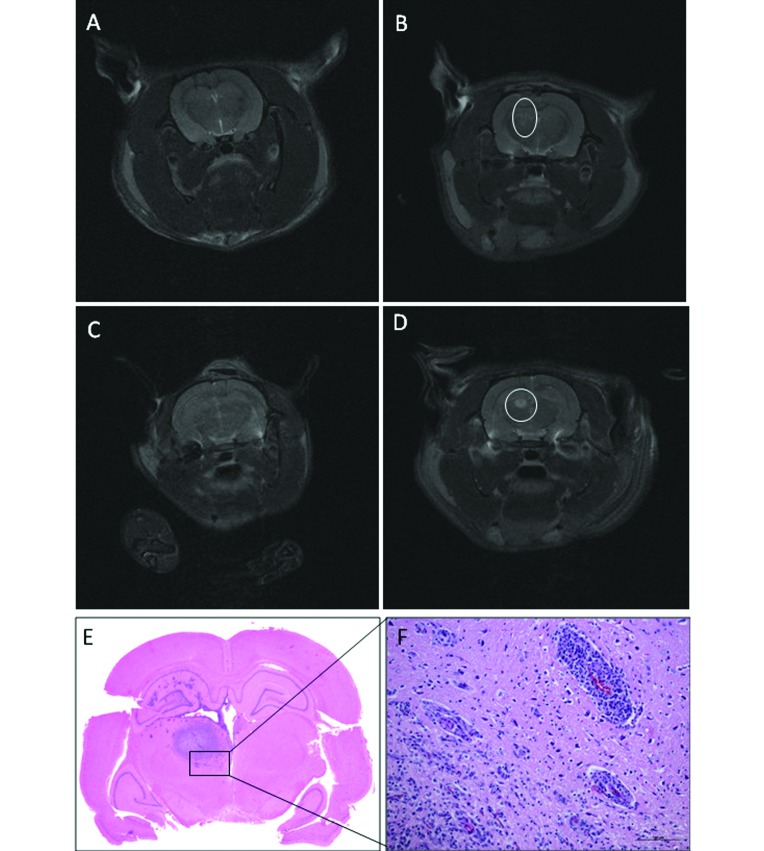
The 13 Wistar rats that received C6-ATCC glioma cells were evaluated with MRI as described. On day 20 after cell injection, 10 rats (nos. 1, 2, 4, 5, 6, 8, 9, 11, 12, and 13) had no noticeable lesions, even though the needle tract confirmed correct implantation (Figure 1 A). In the remaining 3 rats (nos. 3, 7, and 10), the MRI findings were judged as suspected, because they showed widening of the hypointense needle tract, which was surrounded by a hyperintense peripheral rim (Figure 2 B). On day 30, 10 rats were available for MRI, of which 6 were still tumor-negative (nos. 1, 4, 5, 6, 8, and 9), 1 rat was now considered positive (no. 2; Figure 1 C and D), 1 rat with a suspected lesion became negative (no. 10), and the remaining 2 rats remained suspected for tumor growth (nos. 3 and 7). The remaining 3 rats died before the second MRI and were submitted for anatomopathologic investigation.
Figure 1.
Transverse T2-weighted MR images of Wistar rats that received C6-ATCC glioma cells. (A) Rat 12 on day 20: the needle tract is still identifiable, but no hyperintensity is present at the site of inoculation; the rat was judged as tumor negative. (B) Rat 4 on day 20: slight widening of the needle tract associated with hyperintense rim; the rat was judged as suspected (circle). (C) Rat 2 on day 20: no lesions detected. (D) Rat 2 on day 30: a well-defined, round, homogeneous hyperintensity is present in the caudate nucleus (circle). (E) Tumor mass. (F) Neovascularization and mononuclear cell infiltration present at the tumor periphery. Hematoxylin and eosin stain; bar, 100 µm.
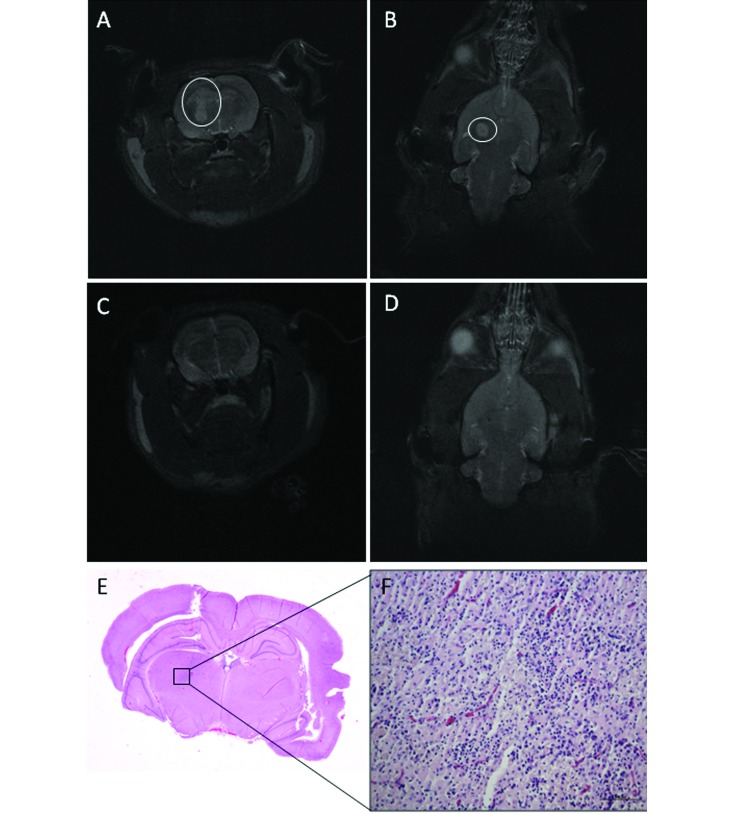
Figure 2.
Wistar rat (no. 24) that received C6-ICLC glioma cells. (A) Transverse and (B) dorsal T2-weighted MR images on day 20 reveal a 20-mm3 hyperintense mass along the needle tract (A-B, circles). (C) Transverse and (D) dorsal T2-weighted MR images on day 30 show that the mass has disappeared; the needle tract is still identifiable on the dorsal image. (E and F) Tumor regression is characterized by inflammatory foci, rare lymphocytes, and neovascular proliferation. Hematoxylin and eosin stain; bar, 100 µm.
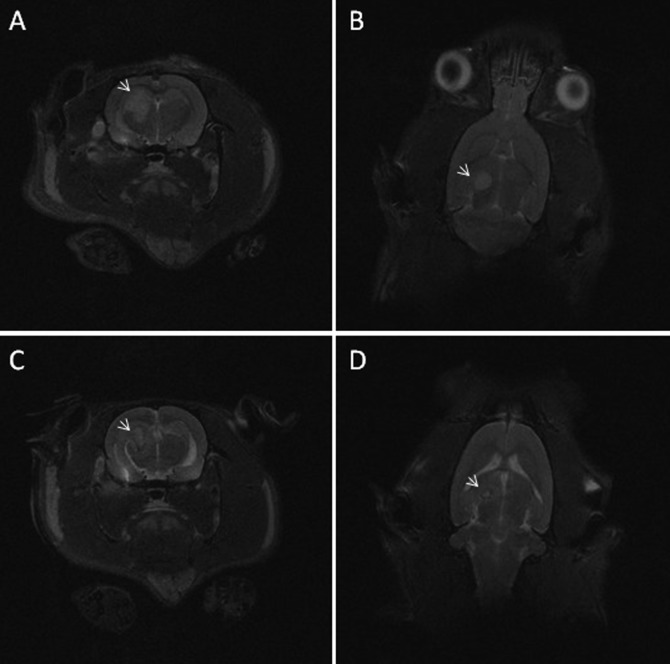
In addition, 11 Wistar rats implanted with C6-ICLC glioma cells were evaluated. On day 20, 9 rats (nos. 14, 15, 17, 18, 20, 21, 22, 23, and 24) each had a hyperintense mass (volume: range, 1.5 to 690 mm3; mean, 112.6 mm3; median, 42 mm3); one rat (no. 16) had a suspected lesion, and the remaining rat (no. 19) was negative for tumor. On day 30, 6 rats were available for MRI: 5 rats (nos. 18, 20, 22, 23, and 24) that were positive on MRI at 20 d were now tumor-negative (Figure 2 A through D), and 1 rat (no. 21) remained positive, but its lesion was smaller than on day 20 (Figure 3). The remaining 5 rats died before the second MRI and were submitted for anatomopathologic investigation. The masses in positive Wistar rats were characterized by their homogeneous hyperintensity, with defined margins in most cases (Figure 1 D).
Figure 3.
Wistar rat (no. 21) that received C6-ICLC glioma cells. (A) Transverse and (B) dorsal T2-weighted MR images on day 20 reveal a 42-mm3 hyperintense mass. (C) Transverse and (D) dorsal T2-weighted MR images on day 30 show that the mass is reduced (6 mm3) and less well-defined than on day 20, with a hyperintense core surrounded by a hypointense rim (arrows).
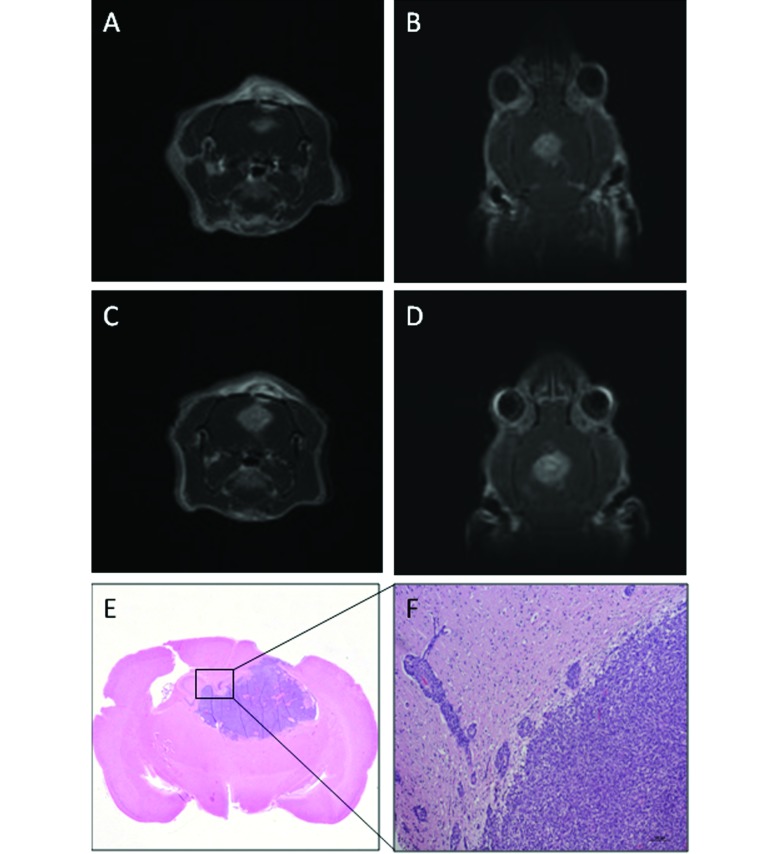
In the final group, 8 Fischer rats given F98 glioma cells were evaluated with MRI as previously described. At day 7, tumor was evident in 7 rats (nos. 25, 26, 27, 29, 30, 31, and 32; volume: range, 4.5 to 47.6 mm3; mean, 21.27 mm3; median, 20.5 mm3). The tumors frequently appeared as multiple masses along the needle tract. The lesions were hyperintense with regard to the cerebral parenchyma, often with internal foci of further increased hyperintensity. In 1 rat (no. 28), no mass was detected at day 7, but a slight and diffuse hyperintensity was noted at the meningeal–cortical interface at day 9; however no hyperintensity was present on day 11. The tumors in 7 lesion-positive rats enlarged rapidly from a mean volume of 51 mm3 (median, 50 mm3) on day 9 to 105.6 mm3 (median, 125.7 mm3) on day 11 (Figure 4 A through D).
Figure 4.
Fischer rat (no. 29) that received F98 glioma cells. (A) Transverse and (B) dorsal T1-weighted MR images on day 9 show a well-defined hyperintense mass (volume, 86 mm3), which has small internal foci of increased hyperintensity. (C) Transverse and (D) dorsal T1-weighted MR images on day 11: tumor volume, 148 mm3. (E) Tumor mass. (F) Numerous neoplastic cells abutting adjacent blood vessels. Hematoxylin and eosin stain, bar, 100 µm.
Therefore, considering the results of the last MRI available for each rat, among the Wistar rats (n = 13) that received C6-ATCC glioma cells, only 1 rat (8%) developed the tumor, 10 rats (77%) were free of tumor, and 2 (15%) had a questionable lesion. Among the Wistar rats (n = 11) given C6-ICLC glioma cells, 4 rats (36%) developed the tumor, 6 (55%) were judged negative and 1 rat (9%) was considered suspected . Among the Fischer rats (n = 8), 7 (88%) developed the tumor, and 1 rat (12%) appeared tumor-free.
Histology and immunohistochemistry.
Wistar rats.
Among all Wistar rats, only 4 developed tumors, 2 of which were large masses that distorted the normal cerebral architecture. All 4 tumors were composed of a mixed densely packed population of cells, most with astrocytic characteristics; the others were poorly differentiated and were fusiform, round, or pleomorphic in appearance. Necrotic areas with pseudopalisading of surrounding tumor cells were present in 2 animals; all 4 neoplasms had numerous typical and atypical mitotic figures. Parenchymal infiltration at tumor margin was very limited and characterized by a few neoplastic cells, either isolated or organized in small clusters, permeating the peritumoral area. Neovascularization was prominent only at the edge of the tumor margin. Significant mononuclear cell infiltration was present in the tumor masses and at the periphery (Figure 1 E and F). MRI-demonstrated tumor regression was characterized by inflammatory foci with typical rod-shaped microglia, rare lymphocytes, and neovascular proliferation (Figure 2 E and F).
Fischer rats.
The brain tumors were composed chiefly of variably sized, irregular, rounded, or elongated fusiform cells, typically arranged in a lobular pattern. Multifocal necrosis and mitotic figures were present in all tumors. Parenchymal invasion was abundant and characterized by small to numerous neoplastic cells that abutted adjacent blood vessels and invaded the adjacent brain parenchyma (Figure 4 E and F). Moderate vascular proliferation was present at the peripheral margin. A very limited and inconstant mononuclear inflammatory reaction was present around the blood vessels surrounding the tumor masses.
Immunohistochemistry.
Ki67 staining revealed a high proportion of mitotic figures in all tumors and did not differ among groups (Wistar-ATCC, 52.2% ± 7.2%; Wistar-ICLC, 51.7% ± 6.6%; Fischer, 51.6% ± 6.3%). Immunocytochemistry for glial fibrillary acidic protein revealed diffuse expression of this marker in the neoplastic cells, confirming their glial origin.
Comparison of histology results and MRI data.
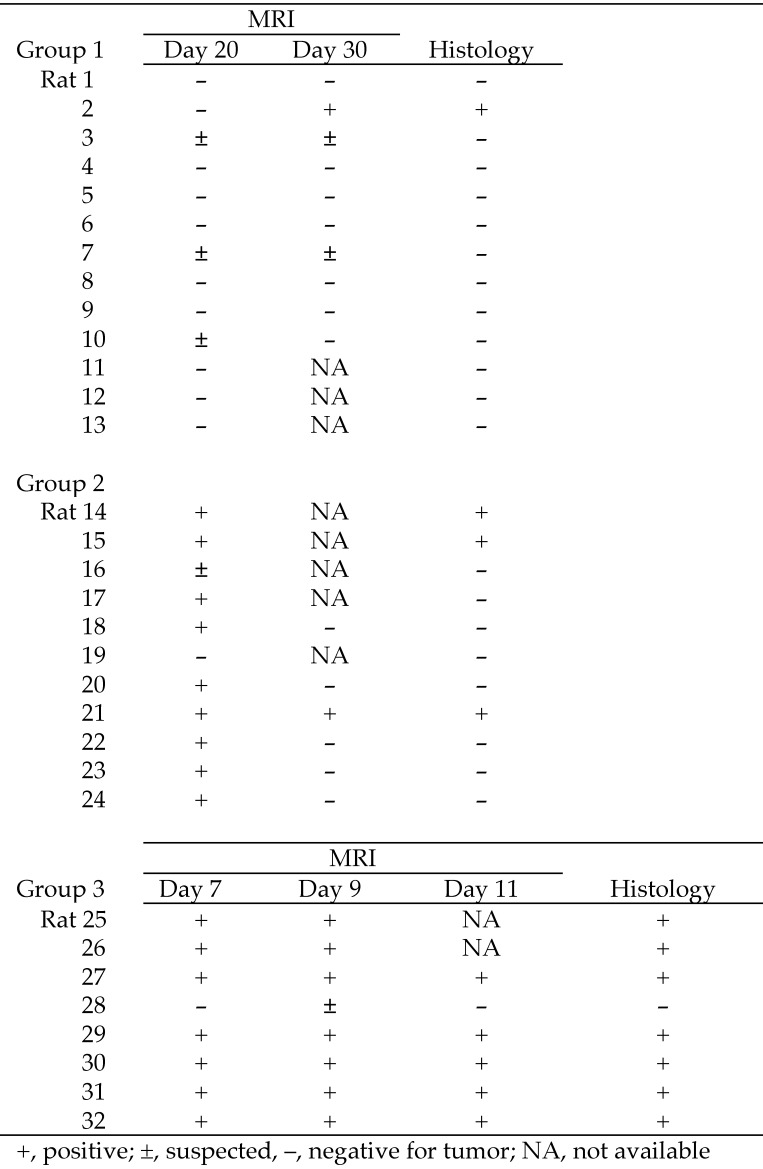
Comparing the results of the last MRI available for each rat with the histopathologic findings (Figure 5), histology confirmed the MRI findings in 85% of cases in animals that received C6-ATCC glioma cells (11 of 13 rats: 1, 2, 4, 5, 6, 8, 9, 10, 11, 12, and 13); the 2 rats judged as suspect for tumor on MRI at day 30 were negative at histology. In the Wistar rats that received C6-ICLC glioma cells, findings from MRI and histology agreed in 82% of cases (9 of 11 rats: nos. 14, 15, 18, 19, 20, 21, 22, 23, and 24), whereas the 2 rats (nos. 16 and 17) that were negative on histology had been positive or suspect for tumor on the last MRI. The agreement between MRI and histology findings was 100% in the Fischer rats.
Figure 5.
Comparison of MRI and histopathologic findings from 13 Wistar rats given C6-ATCC glioma cells (group 1), 11 Wistar rats that received C6-ICLC glioma cells (group 2), and 8 Fischer rats injected with F98 glioma cells (group 3). The percentage of agreement between MRI findings and histology was 84.6% for group 1, 81.8% for group 2, and 100% for group 3.
Discussion
To study possible new therapeutic strategies for glioblastoma multiforme, reproducible experimental animal models that mimic natural conditions occurring in the human spontaneous disease are needed. Unfortunately, positive in vivo experimental results using these models have not translated into any real therapeutic breakthrough for malignant glioma patients so far. The reproducibility of the model used likely influences the evaluation of the pharmacologic results obtained. Several glioma models are described in the literature.1,5,10 The most widely used model is the C6-Wistar rat model. The current study compared 2 rat glioma models: allogeneic C6-Wistar rats (implanted with C6 glioma cells from 2 different sources, C6-ATCC and C6-ICLC cells) and syngeneic F98-Fischer rats.
The results showed considerable variation in tumor volume and tumor engraftment among groups of implanted rats of similar weight and sex. Although the same implantation technique was used throughout, the success of tumor implantation, as evaluated by histopathology, was quite variable: 8% in Wistar rats that received C6-ATCC glioma cells, 27% in Wistar rats given C6-ICLC glioma cells, and 88% in Fischer rats. Two C6 cell strains were used in Wistar rats, in which the percentage of rats with tumors was initially high (maximum, 82%) on MRI at day 20; however, spontaneous tumor regression had occurred by 10 d later, as demonstrated by MRI, in 5 rats. Histology confirmed tumor growth in a maximum of only 27% of the allogeneic rats. Considering the low percentage of success of the implantation of C6 cells in Wistar rats, we conclude that this animal model does not represent a suitable experimental system.
C6-ATCC and C6-ICLC cells are glial cell strains cloned from an adult rat glial tumor that was induced by using repeated injections of methylnitrosourea and subsequently processed through a series of alternating in vitro and in vivo passages.5 The C6 glioma is composed of a pleomorphic population of cells with variably shaped nuclei and focal invasion into contiguous normal brain. The only difference between the 2 cell lines is the laboratory of production and classification (that is, American Type Culture Collection for C6-ATCC cells and the National Institute for Cancer Research in Genoa, Italy for the C6-ICLC cells). Because this tumor arose in an outbred Wistar rat, there is no syngeneic host in which it can be propagated. This serious limitation diminishes its usefulness for survival studies because the tumor is immunogenic, even in Wistar rats.3 The significant inflammatory reaction observed in and around the tumors in the present study confirms the immunogenicity of the tumor cells.
In the Fischer rats, implantation was successful in 88% of cases, with rapid tumor onset and a constant rate of tumor growth until rats were euthanized for histology. The F98 cell line used in these rats is an anaplastic glioma cell line with a minor sarcomatous component that originally was produced after a single intravenous injection of N-ethyl-N-nitrosourea into a 20-wk pregnant Fischer rat.2 The tumor is composed of a mixed population of spindle-shaped cells, the majority of which have fusiform nuclei, and a smaller number of polygonal cells with round to oval nuclei. The tumor is characterized by extensive invasion of contiguous normal brain with islands of tumor cells at varying distances from the tumor mass, many of which form perivascular clusters.3 These cells show low immunogenicity when implanted in their syngeneic host and, after implantation, animals develop infiltrative tumors that are very resistant to conventional treatment.2 This pattern replicates the clinical situation with human malignant gliomas.
With regard to the time necessary for tumor development, tumor appearance was delayed in Wistar model (that is, 20 d in rats that received C6-ICLC glioma cells) as compared with Fischer model, in which tumors were already apparent at day 7. This difference can influence the cost of the study, because a faster onset decreases study duration and thus per-diem charges.
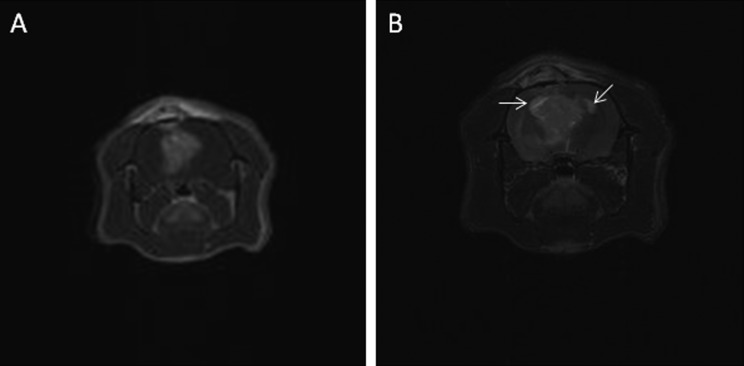
Regarding the MRI protocols, good images were obtained in the Wistar model by using T2-sequences, which demonstrated well-defined and measurable tumor masses. However, in the Fischer group, the tendency of the tumor to involve and follow the ventricular system resulted in poorly defined tumor margins on T2-imaging. Thus in Fischer rats, better results were obtained by using contrast-enhanced T1 sequences than with T2 imaging, even though the T1 image matrix was lower (Figure 6).
Figure 6.
Group 3 (Fischer rats, F98 glioma cells): T1-weighted (A) and T2-weighted (B) transverse images of rat n. 29 at day 11: in the T-2 weighted images the signal of the lateral ventricles filled with cerebrospinal fluid (arrows) can be confused with the tumor signal. Owing to the tendency of the Fischer model to involve and follow the pattern of the ventricular system, T1-weighted postcontrast images were preferred for measuring tumor volume.
MRI and histologic results demonstrated complete agreement for Fischer rats but showed less agreement in Wistar rats. Among Wistar rats that received C6-ATCC glioma cells, discrepancies involved 2 rats (no. 3 and 7) that were judged ‘suspected’ for tumor formation at the last MRI. Histopathology excluded the presence of the tumor in those rats, revealing only a glial reaction at the end or along the needle insertion tract. Among the Wistar rats injected with C6-ICLC glioma cells, one animal (no. 17) that was positive on the day-20 MRI was negative at histology; however, this animal died on day 29, before the final MRI and thus explaining the lack of correlation in this case. In fact, on day 30, the MRI of the other 5 rats (nos.18, 20, 22, and 24) showed spontaneous regression of the lesions between the first and the second MRI. A similar spontaneous regression might have occurred in rat 17 between days 20 and 30. Thus, the use of in-vivo MRI allowed us to follow the onset and the evolution of the tumor, demonstrating several cases of spontaneous regression of the mass in Wistar groups.
The inability of the C6-Wistar allogeneic system to yield a reproducible model, together with the observed cases of spontaneous tumor regression, could be due to humoral and cellular immune responses after tumor implantation, as reported previously.7,17 In the allogeneic model, the effect of the immune response toward the implanted cells might be related to the different tumor phenotypes of C6 cells, which can also influence growth patterns and tumorgenicity.19
Regarding the syngeneic F98-Fischer model, the F98 cell line is probably only weakly immunogenic. This property permits the development of infiltrative masses with histopathologic and radiobiologic characteristics comparable to those of aggressive, primary human brainstem tumors, facilitating preclinical testing of therapeutics to treat these lethal tumors.
According to our current results, tumor volume and frequency vary considerably between different rat glioma models (C6-Wistar, F98-Fischer) using the same stereotactic implantation technique. Moreover, MRI demonstrated several cases of spontaneous tumor regression in the C6-Wistar model. Consequently our results indicate that allogeneic models provide intrinsically variable outcomes that can interfere with the evaluation of therapeutic protocols. Conversely, gliomas in syngeneic models develop faster and grow more reproducibly in an immunoresponsive environment, because the immune response toward syngeneic cells is minimal. This feature of syngeneic models can influence the cost of the experiment, because a faster onset reduces study duration and per-diem charges. The use of MRI allows researchers to follow tumor onset and growth in vivo and demonstrates more homogeneous outcomes across rats, allowing better evaluation of therapeutic protocols.
Acknowledgments
We thank Fondazione San Paolo (Development of solid lipid nanoparticles [SLN] as vehicles of antineoplastic drugs to improve pharmacological glioblastoma therapy, grant no. ORTO11WNST) and the Italian Ministry of Education, Universities, and Research (MUIR Ricerca Locale 2014) for funding.
References
- 1.Auer RN, Del Maestro RF, Anderson RA. 1981. Simple and reproducible experimental in vivo glioma model. Can J Neurol Sci 8:325–331. [DOI] [PubMed] [Google Scholar]
- 2.Barth RF. 1998. Rat brain tumor models in experimental neuro-oncology: the 9L, C6, T9, F98, RG2(D74), RT2, and CNS1 gliomas. J Neurooncol 36:91–102. [DOI] [PubMed] [Google Scholar]
- 3.Barth RF, Kaur B. 2009. Rat brain tumor models in experimental neurooncology: the C6, 9L, T9, RG2, F98, BT4C, RT2, and CNS1 gliomas. J Neurooncol 94:299–312. [DOI] [PMC free article] [PubMed] [Google Scholar]
- 4.Becher B, Prat A, Antel JP. 2000. Brain–immune connection: immunoregulatory properties of CNS-resident cells. Glia 29:293–304. [PubMed] [Google Scholar]
- 5.Benda P, Lightbody J, Sato G, Levine L, Sweet W. 1968. Differentiated rat glial cell strain in tissue culture. Science 161:370–371. [DOI] [PubMed] [Google Scholar]
- 6.Chen L, Zhang Y, Yang J, Hagan JP, Li M. 2013. Vertebrate animal models of glioma: understanding the mechanisms and developing new therapies. Biochim Biophys Acta 1836:158–165. [DOI] [PMC free article] [PubMed] [Google Scholar]
- 7.Grobben B, De Deyn PP, Slegers H. 2002. Rat C6 glioma as experimental model system for the study of glioblastoma growth and invasion. Cell Tissue Res 310:257–270. [DOI] [PubMed] [Google Scholar]
- 8.Hickey WF. 2001. Basic principles of immunologic surveillance of the normal central nervous system. Glia 36:118–124. [DOI] [PubMed] [Google Scholar]
- 9.Huszthy PC, Daphu I, Niclou SP, Stieber D, Nigro JM, Sakariassen PØ, Miletic H, Thorsen F, Bjerkvig R. 2012. In vivo models of primary brain tumors: pitfalls and perspectives. Neuro Oncol 14:979–993. [DOI] [PMC free article] [PubMed] [Google Scholar]
- 10.Mathieu D, Lecomte R, Tsanaclis AM, Larouche A, Fortin D. 2007. Standardization and detailed characterization of the syngeneic Fischer–F98 glioma model. Can J Neurol Sci 34:296–306. [DOI] [PubMed] [Google Scholar]
- 11.Morrone FB, Oliveira DL, Gamermann P, Stella J, Wofchuk S, Wink MR, Meurer L, Edelweiss MI, Lenz G, Battastini AM. 2006. In vivo glioblastoma growth is reduced by apyrase activity in a rat glioma model. BMC Cancer 6:226. [DOI] [PMC free article] [PubMed] [Google Scholar]
- 12.Nicholas MK, Lukas RV, Chmura S, Yamini B, Lesniak M, Pytel P. 2011. Molecular heterogeneity in glioblastoma: therapeutic opportunities and challenges. Semin Oncol 38:243–253. [DOI] [PubMed] [Google Scholar]
- 13.Panciani PP, Fontanella M, Tamagno I, Battaglia L, Garbossa D, Inghirami G, Fagioli F, Pagano M, Ducati A, Lanotte M. 2012. Stem-cell–based therapy in high-grade glioma: why the intraventricular route should be preferred? J Neurosurg Sci 56:221–229. [PubMed] [Google Scholar]
- 14.Parsa AT, Chakrabarti I, Hurley PT, Chi JH, Hall JS, Kaiser MG, Bruce JN. 2000. Limitations of the C6/Wistar rat intracerebral glioma model: implications for evaluating immunotherapy. Neurosurgery 47:993–999. [DOI] [PubMed] [Google Scholar]
- 15.Stylli SS, Luwor RB, Ware TM, Tan F, Kaye AH. 2015. Mouse models of glioma. J Clin Neurosci 22:619–626. [DOI] [PubMed] [Google Scholar]
- 16.Toda M. 2013. Glioma stem cells and immunotherapy for the treatment of malignant gliomas. ISRN Oncol. doi:10.1155/2013/673793. [DOI] [PMC free article] [PubMed] [Google Scholar]
- 17.Tonn JC. 2002. Model systems in neurooncology. Acta Neurochir Suppl 83:79–83. [DOI] [PubMed] [Google Scholar]
- 18.Zhang X, Guo M, Shen L, Hu S. 2014. Combination of photodynamic therapy and temozolomide on glioma in a rat C6 glioma model. Photodiagnosis Photodyn Ther 11:603–612. [DOI] [PubMed] [Google Scholar]
- 19.Zhang SJ, Ye F, Xie RF, Hu F, Wang BF, Wan F, Guo DS, Lei T. 2011. Comparative study on the stem-cell phenotypes of C6 cells under different culture conditions. Chin Med J (Engl) 124:3118–3126. [PubMed] [Google Scholar]


