

Abstract
Objectives
To examine patient, community, and insurance plan predictors of high-risk prescribing in the elderly Medicare Advantage population.
Study Design
Cohort study.
Methods
We compared patient, community, and insurance plan characteristics of 77,247 respondents to the Health Outcomes Survey in 203 Medicare Advantage plans with and without new Medicare Part D claims for high-risk medications from June 2006–May 2007.
Results
15.6% of Medicare Advantage enrollees received a new prescription for a high-risk medication during 12 months of follow-up. In adjusted analyses, new users of high-risk medications were more likely to be women (OR: 1.35, 95% CI: 1.28 to 1.42), and they reported poorer general health (Physical Component Summary score 37.3 vs. 40.4, p<0.05) than did individuals who never received a high-risk prescription. Age ≥85 was protective against receipt of a high-risk medication (OR relative to persons 65–69: 0.69, 95% CI: 0.64 to 0.75). Incidence of high-risk prescribing varied by census division, with a two-fold difference between regions with the lowest and highest rates (9% in New England vs. 18% in the West South Central). Muscle relaxants, antihistamines, and opiates accounted for over two-thirds of new dispensings of high-risk medications. Approximately 67% of new users of high-risk medications received only one dispensing.
Conclusions
High-risk prescribing varies widely by geography and drug class in the Medicare Advantage population. Women, persons with worse self-reported health, and those residing in the southern regions of the US more frequently receive high-risk medications. Variations may highlight areas for targeted interventions to reduce high-risk prescribing among the elderly.
INTRODUCTION
High-risk prescribing has been associated with adverse drug reactions in the elderly population.1,2 Among patients aged 65 and older, adverse drug reactions are of particular concern because they contribute to increased health care utilization, increased Medicare spending, and worse health outcomes.3,4 Medicare managed care (Medicare Advantage) plans are required to report the proportion of their enrollees receiving drugs that are considered potentially inappropriate for the elderly using Healthcare Effectiveness Data and Information Set (HEDIS) quality indicators. The HEDIS measures are based on established lists of high-risk medications that can cause adverse drug reactions in the elderly. The first list of high-risk medications was published in 1991 as the Beers criteria.5–7 Zhan and colleagues further classified a subset of these drugs into three categories (always inappropriate for the elderly, rarely appropriate for the elderly, and sometimes indicated for the elderly), marking distinctions that are relevant for clinical practice (Supplemental Table 1).8
Many factors influence the prescribing process, including a patient’s indication and preference for a drug, provider practice patterns, and differential prescription drug coverage by insurance plans. It is necessary to consider all such forces simultaneously to understand their relative importance in for high-risk prescribing. Studies of high-risk prescribing in the elderly have been conducted previously in both hospitalized and community-dwelling patient populations, but have primarily focused on patient-level predictors or populations within limited geographic areas.8–11 Given previously described geographic variations in quality and appropriateness of prescribing practices, smaller localized studies may identify different predictors in different regions.12,13 In order to identify national predictors of high-risk prescribing in the elderly that can be translated into improvements in prescribing policy or practice, it is necessary to evaluate a large, nationally representative sample of elderly individuals. It is particularly relevant to examine such questions using data following the introduction of Medicare Part D, as expanded prescription drug coverage has increased access to medications among the elderly.14
We therefore examined patient, community, and insurance plan predictors of high-risk prescribing in the elderly Medicare Advantage population. Because over 25% of the Medicare population is now enrolled in Medicare Advantage plans, characterizing high-risk prescribing within this population is increasingly important. Using a nationally representative study sample, we compared Medicare Advantage beneficiaries with new Medicare Part D claims for high-risk medications to those without claims for high-risk medications during the same interval.
METHODS
Sources of Data & Study Population
We conducted a cohort study that estimated the associations between baseline patient, community, and insurance plan characteristics and subsequent initiation of a high-risk medication. Patient and insurance plan characteristics and patient mortality ascertainment were obtained from the 2006–2008 Medicare Health Outcomes Survey (HOS) (Cohort 9), which features a nationally representative sample of Medicare Advantage beneficiaries. The HOS surveys a random sample of approximately 1,000 beneficiaries in every participating Medicare Advantage plan during a baseline year and then again after two years.15 For Cohort 9 of the HOS, the survey sampled 203 Medicare Advantage plans and had a response rate of 69% for the baseline questionnaire. Prescription information was drawn from the 2006 and 2007 Medicare Part D Event files containing information about every Medicare-paid prescription filled by individuals in the study sample, including survey non-respondents. Community characteristics were obtained from the 2006–2007 Area Resource File (ARF), which includes data on all counties in the United States. Individuals in the HOS were linked by county code to the corresponding entries in the ARF.
Cohort 9 of the Medicare HOS included 203 reporting Medicare Advantage plans, and a total sample size of 188,515 beneficiaries. From this population, the sample was further restricted to the 89,330 beneficiaries age 65 or older who completed at least 80% of the baseline survey and had at least one Medicare Part D claim between January 2006 and May 2007. The final study sample consisted of 77,247 individuals who had no high-risk prescriptions during a 5 month baseline period (January through May of 2006) prior to the administration of the 2006 HOS (Figure 1).
FIGURE 1.
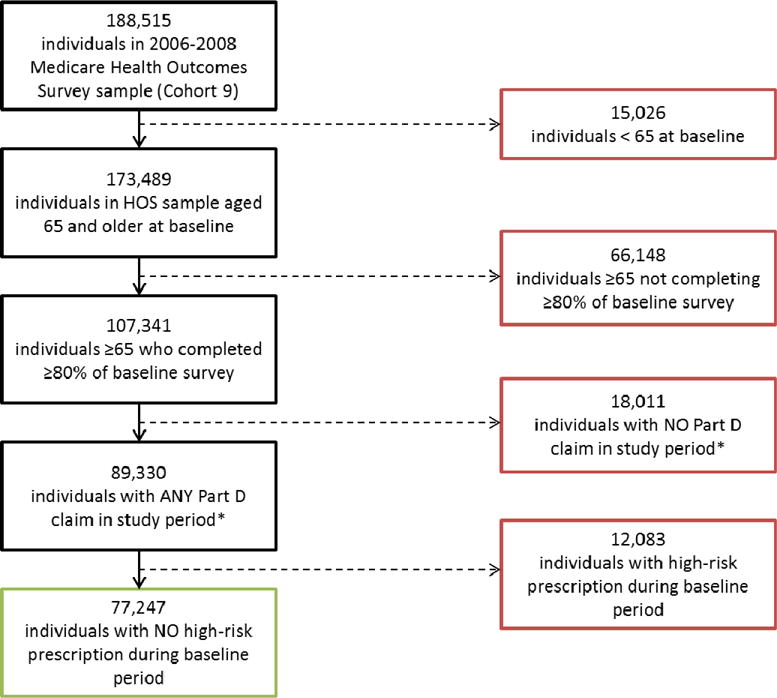
Construction of study sample.
*January 2006–May 2007.
Conceptual Model
We employed the model of health services use developed by Andersen, Aday, and Newman in which the use of health service use is driven by predisposing (e.g. age, sex, education), enabling (e.g. income, insurance), and need-based (e.g. disease-burden, disability) factors.16–18 Phillips and colleagues built upon this model to include community characteristics as determinants of health care use.19 These models informed variable selection for these analyses seeking to assess the relative importance of a variety of determinants in predicting the receipt of a high-risk prescription among the elderly.
Study Variables
The primary outcome of interest was receipt of a new dispensing for a high-risk medication. New users were defined as individuals with no high-risk prescriptions prior to completion of the baseline survey (January to May 2006) who received a new prescription for a high-risk medication during a twelve-month period after the survey (June 2006 to May 2007) (Supplemental Figure 1). In the analyses we used dichotomous indicators of receipt of high-risk medications according to the Zhan criteria as the dependent variables of interest. These variables included an indicator for receipt of any high-risk medication and indicators for each Zhan sub class reflecting medications that are always inappropriate for the elderly, medications that are rarely appropriate for the elderly, and medications that are sometimes indicated for the elderly. We conducted additional analyses using dichotomous indicators of receipt of any high-risk medications in the most commonly prescribed drug classes (antihistamines, opiates, skeletal muscle relaxants) (Supplemental Table 2) as the outcome. We also stratified our main analysis by US census division.
The primary independent variables were patient socio-demographic characteristics, including age, sex, race, marital status, highest educational attainment, and annual household income, measured prior to the receipt of any high-risk medication. Baseline measures of patient health included self-reported general health (excellent/very good, good/fair/poor), limitation in moderate activity (any limitation, no limitation), total number of chronic conditions reported in the HOS, total number of unique drugs received, as well as Physical Component Summary (PCS) and Mental Component Summary (MCS) scores. The PCS and MCS scores range from 0–100 and are calculated based on individuals’ responses to survey items included in the HOS that are derived from the Veterans RAND 12 Item Health Survey (VR-12), a validated instrument that spans eight dimensions of physical and mental health, and are used to measure disease burden and health related quality of life.20,21 The VR-12 is scored using a t-score transformation with a norm of 50 and a standard deviation of 10, where higher scores denote better health. Self-reports of physical health and functional status have been shown to predict mortality, health care costs, and use of health care services, even after adjustment for the presence of coexisting conditions.22–24
The following community and insurance plan characteristics were also included as independent variables: percent of county population under the poverty line, percent of county population that is white, and percent of county population aged 65 and older, as well as the per capita supply of physicians for each county, the US census division in which each Medicare Advantage plan operates, plan model type (staff/group, non-staff/non-group), plan profit status, the number of years a plan has participated in Medicare Advantage, and the number of beneficiaries served by a plan.
Analyses
We identified prevalent and new users of high-risk medications among the full HOS population (both respondents and non-respondents) and among those who completed at least 80% of the baseline survey. We conducted chi-square and t-tests to compare the distribution of potential predictors across exposure categories. We employed generalized logistic regression models to estimate adjusted odds ratios for potential predictors of receiving new prescriptions for high-risk medications, using generalized estimating equations to account for patient clustering within Medicare Advantage plans. We also estimated adjusted odds ratios for potential predictors of receiving Zhan criteria drugs classified as antihistamines, opiates, and skeletal muscle relaxants. We repeated regression analyses, stratifying by US census division. All analyses were performed with SAS software, version 9.2 (SAS Institute). Results are reported with 95% confidence intervals. The study was approved by the institutional review board of Brown University; the requirement for informed consent was waived.
RESULTS
In the full study population age 65 or older with at least one Medicare Part D claim between January 2006 and May 2007 (n=143,684), 13.5% had at least one dispensing of a high-risk medication during the first five months of 2006, and an additional 13.5% had at least one high-risk medication dispensing between June 2006 and May 2007. Of the beneficiaries age 65 or older who and had at least one Medicare Part D claim between January 2006 and May 2007 and completed at least 80% of the baseline survey (n=89,330), 13.5% had at least one dispensing of a high-risk medication during the first five months of 2006. These individuals, classified as prevalent users, were excluded from subsequent analyses. The final study sample consisted of 77,247 individuals not using high-risk medications for the first five months of 2006. Of these, 15.6% received a new dispensing of a high-risk medication according to the Zhan criteria from June 2006 through May 2007 (Table 1).
TABLE 1.
Patient, Community, and Insurance Plan Characteristics of Medicare Advantage Enrollees with New Prescriptions and without Prescriptions for High-Risk Medications between June 2006 – May 2007
| New High-Risk Prescription | No High-Risk Prescription | ||||
|---|---|---|---|---|---|
|
| |||||
| Always Inappropriate | Rarely Appropriate | Sometimes Indicated | Any Category | ||
| N (%) | 1,394 (1.8) | 7,653 (9.9) | 5,895 (7.6) | 12,040 (15.6) | 65,207 (84.4) |
|
PATIENT CHARACTERISTICS | |||||
| Mean Age, y (SD) | 74.4 (6.5) | 75.0 (6.6) | 75.5 (6.8) | 75.3 (6.7) | 75.3 (6.8) |
| Female, % | 72 | 68 | 65 | 66 | 58 |
| Race, % | |||||
| White | 87 | 87 | 84 | 86 | 85 |
| Black | 5 | 9 | 10 | 9 | 9 |
| Other | 8 | 4 | 6 | 5 | 6 |
| Married, % | 57 | 53 | 53 | 54 | 56 |
| Annual Household Income | 17 | 15 | 18 | 16 | 13 |
| <$10,000, % | |||||
| Any College Education, % | 33 | 33 | 32 | 33 | 37 |
| Self-Reported General Health, % | |||||
| Excellent/Very Good | 21 | 24 | 22 | 24 | 33 |
| Good/Fair/Poor | 79 | 76 | 78 | 76 | 67 |
| Limitation in Moderate Activity, % | |||||
| No Limitation | 34 | 35 | 35 | 37 | 47 |
| Any Limitation | 66 | 65 | 65 | 63 | 53 |
|
Mean Number of Chronic Conditions (SD) |
3.7 (2.2) | 3.6 (2.2) | 3.6 (2.2) | 3.5 (2.2) | 2.9 (2.0) |
|
Mean Number of Unique Prescriptions (SD) |
14.4 (7.2) | 12.5 (6.4) | 13.1 (6.7) | 11.9 (6.1) | 7.6 (5.0) |
|
Mean Number of Unique Zhan High-Risk Prescriptions (SD) |
1.7 (0.9) | 1.4 (0.7) | 1.4 (0.7) | 1.2 (0.4) | NA |
|
Mean Physical Component Summary (PCS) Score, (SD) |
36.5 (12.0) | 36.7 (12.0) | 36.3 (12.1) | 37.3 (12.0) | 40.4 (11.8) |
|
Mean Mental Component Summary (MCS) Score, (SD) |
49.3 (12.0) | 50.7 (11.5) | 49.9 (11.7) | 50.7 (11.4) | 52.5 (10.6) |
|
COMMUNITY CHARACTERISTICS | |||||
|
Mean Percentage of White Residents, (SD) |
73.7 (26.0) | 79.6 (18.0) | 78.0 (20.0) | 78.6 (19.3) | 79.3 (17.2) |
|
Mean Percentage of Elderly Residents, (SD) |
13.3 (3.2) | 13.5 (3.6) | 13.2 (3.3) | 13.3 (3.4) | 13.3 (3.2) |
| Mean Percentage of Residents under Poverty Line, (SD) | 11.4 (5.2) | 12.3 (4.4) | 12.3 (4.6) | 12.2 (4.5) | 12.1 (4.4) |
| Mean Household Income, (SD) | $46,744 ($17,645) | $49,556 ($12,855) | $49,546 ($13,836) | $49,630 ($13,610) | $51,869 ($12,930) |
| Mean # MDs Per/1000 Residents, (SD) | 3.0 (1.8) | 2.9 (1.7) | 3.0 (1.2) | 3.0 (1.8) | 3.1 (1.8) |
|
PLAN CHARACTERISTICS | |||||
| Model Type, % | |||||
| Staff/Group | 11 | 12 | 12 | 12 | 14 |
| Non-Staff/Non-Group | 89 | 88 | 88 | 88 | 86 |
| Profit Status, % | |||||
| Not For Profit | 23 | 27 | 30 | 29 | 34 |
| For Profit | 77 | 73 | 70 | 71 | 66 |
| Years Participating in Medicare | |||||
| <5 | 34 | 26 | 26 | 26 | 24 |
| 5–10 | 25 | 30 | 29 | 29 | 27 |
| ≥10 | 41 | 44 | 45 | 45 | 49 |
| Population Served | |||||
| <4,845 | 19 | 22 | 22 | 22 | 22 |
| 4,845 – 16,295 | 25 | 24 | 25 | 25 | 26 |
| 16,296 – 32,390 | 27 | 28 | 27 | 27 | 26 |
| >32,390 | 29 | 26 | 26 | 26 | 26 |
p-values for all comparisons <0.01
New users of high-risk medications were more likely to be women than those without a prescription for a high-risk medication (66% vs. 58%), were more likely to have annual income <$10,000 (16% vs. 13%), and were less likely to have any college education (33% vs. 37%) (all p-values <0.01). New users also reported poorer general health, greater activity limitation, and more chronic conditions than individuals who never received a high-risk medication. On average, they received approximately 4 more unique prescriptions in 2006–7 than did individuals without a prescription for a high-risk medication (11.9 prescriptions vs. 7.6 prescriptions). Individuals newly receiving drugs classified as “rarely appropriate” and “always inappropriate” had poorer health at baseline than those receiving drugs classified as “sometimes indicated.”
Individuals receiving and not receiving high-risk medications were similar with respect to measured community and insurance plan characteristics. However, individuals with any high-risk prescription were more likely to be enrolled in for-profit plans (71% vs. 66%). High-risk prescribing varied widely by geographic region. New England and the Middle Atlantic had the lowest rates (9% and 11% respectively); the East and West South Central regions the highest rates (16% and 18%, respectively), with more than a two-fold difference between the best and worst performing regions (Figure 2).
FIGURE 2.
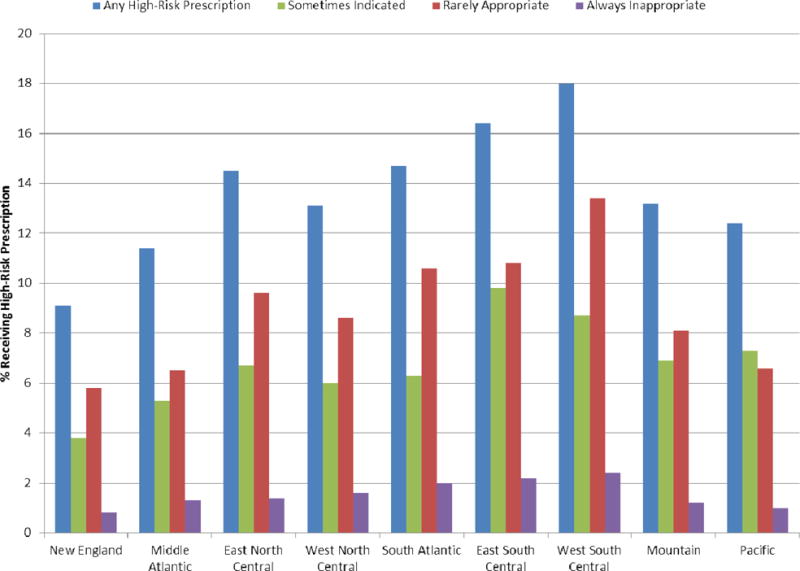
New high-risk prescribing (as defined by the Zhan criteria) among elderly Medicare Advantage beneficiaries by U.S. Census Division, June 2006 to May 2007.
Among the 12,040 new users of high-risk medications, 8,117 (67.4%) had only a single dispensing between June of 2006 and May 2007. Only 800 individuals (6.6%) had four or more dispensings of the same high-risk medication during the study period. Compared to those with only one dispensing of a high-risk medication, individuals receiving four or more dispensings of a high-risk medication had poorer self-rated health, and were more likely to be women (72% vs 64%) (Supplemental Table 3).
In logistic regression analyses adjusted for patient, community, and insurance plan characteristics, the risk of being prescribed a new high-risk medication decreased as age increased (Cochran-Armitage trend test: p<0.05) (Table 2). Age ≥85 was protective against receipt of a high-risk medication (OR: 0.69, 95% CI: 0.64 to 0.75). This effect was observed for all sub-classifications of appropriateness (all tests for trend: p<0.05) (Supplemental Table 4). Women were more likely to receive high-risk prescriptions (OR: 1.35, 95% CI: 1.28 to 1.42). Black enrollees were less likely than white enrollees to receive a high-risk prescription (OR: 0.90, 95% CI 0.83 to 0.98). Individuals with higher PCS and MCS scores were less likely to receive all classifications of high-risk medications, as were individuals with fewer than three chronic conditions. Individuals in for-profit plans were more likely to be prescribed a high-risk medication (OR: 1.10, 95% CI: 1.02 to 1.19).
TABLE 2.
Adjusted Odds of Receiving a High-Risk Medication among Elderly Medicare Advantage Beneficiaries
| Any Zhan High-Risk Prescription | |
|---|---|
|
| |
| OR (95% CI) | |
| PATIENT CHARACTERISTICS | |
| Age* | |
| 65–69 | Ref. |
| 70–74 | 0.92 (0.86 to 0.98) |
| 75–79 | 0.98 (0.91 to 1.04) |
| 80–85 | 0.88 (0.82 to 0.94) |
| >85 | 0.69 (0.64 to 0.75) |
| Sex | |
| Male | Ref. |
| Female | 1.35 (1.28 to 1.42) |
| Race | |
| White | Ref. |
| Black | 0.90 (0.83 to 0.98) |
| Other | 0.93 (0.83 to 1.03) |
| Marital Status | |
| Single/Widowed/Divorced | Ref. |
| Married | 1.06 (1.00 to 1.12) |
| Annual Household Income | |
| <$10,000 | Ref. |
| $10,000 –$19,999 | 0.97 (0.89 to 1.04) |
| $20,000 – $29,999 | 0.90 (0.83 to 0.98) |
| ≥$30,000 | 0.90 (0.83 to 0.98) |
| Education | |
| No College Education | Ref. |
| Any College Education | 0.97 (0.92 to 1.01) |
| Physical Component Summary (PCS) Score | |
| Q1: <30 | Ref. |
| Q2: 30 – 40 | 0.84 (0.79 to 0.90) |
| Q3: 41 – 49 | 0.74 (0.69 to 0.80) |
| Q4: >49 | 0.61 (0.56 to 0.65) |
| Mental Component Summary (MCS) Score | |
| Q1: <45 | Ref. |
| Q2:45 – 55 | 0.91 (0.85 to 0.97) |
| Q3: 56 – 60 | 0.89 (0.83 to 0.96) |
| Q4: >60 | 0.81 (0.76 to 0.86) |
| Number of Chronic Conditions | |
| <Median (<3) | Ref. |
| ≥Median (≥3) | 1.31 (1.23 to 1.38) |
Cochran-Armitage trend test for age effect p<0.05. Analyses also adjusted for community and insurance plan characteristics and census division.
In stratified analyses adjusting for patient, community, and insurance plan characteristics, the age effect observed in the full sample was most pronounced in New England and the Middle Atlantic, but was not present in the East South Central, West South Central, or Mountain divisions (tests for trend in these three divisions: p>0.05) (Supplemental Table 5). Women were more likely to receive a high-risk prescription in all divisions but New England.
Approximately two-thirds of all high-risk prescriptions received in the study population and 71% of new high-risk prescriptions were classified as antihistamines (29%), opiates (23%), and skeletal muscle relaxants (19%) (Supplemental Table 6). The protective effect of age observed in the full sample was also seen for skeletal muscle relaxants, with older individuals being less likely to receive a high-risk medication (Table 3). A slight age effect was observed for antihistamines, and the effect was reversed for opiates, with risk increasing with older age (all tests for trend: p<0.05).
TABLE 3.
Adjusted Odds of Receiving a High-Risk Prescription by Drug Class.
| Skeletal Muscle Relaxants OR (95% CI) |
Antihistamines OR (95% CI) |
Opiates OR (95% CI) |
|
|---|---|---|---|
| N | 1,967 | 1,620 | 2,465 |
| Age* | |||
| 65–69 | Ref. | Ref. | Ref. |
| 70–74 | 0.85 (0.76 to 0.95) | 0.89 (0.77 to 1.02) | 1.07 (0.94 to 1.23) |
| 75–79 | 0.67 (0.59 to 0.77) | 0.95 (0.83 to 1.09) | 1.24 (1.11 to 1.38) |
| 80–85 | 0.46 (0.40 to 0.54) | 0.89 (0.76 to 1.04) | 1.32 (1.16 to 1.50) |
| >85 | 0.26 (0.20 to 0.34) | 0.82 (0.67 to 1.00) | 1.11 (0.94 to 1.31) |
| Sex | |||
| Male | Ref. | Ref. | Ref. |
| Female | 1.24 (1.12 to 1.38) | 1.29 (1.15 to 1.44) | 1.59 (1.45 to 1.73) |
| Race | |||
| White | Ref. | Ref. | Ref. |
| Black | 1.07 (0.91 to 1.25) | 0.86 (0.71 to 1.04) | 0.77 (0.65 to 0.91) |
| Other | 0.79 (0.61 to 1.02) | 1.19 (0.94 to 1.49) | 0.97 (0.79 to 1.19) |
| Marital Status | |||
| Single/Widowed/Divorced | Ref. | Ref. | Ref. |
| Married | 1.06 (0.95 to 1.19) | 1.06 (0.95 to 1.19) | 1.06 (0.97 to 1.17) |
| Annual Household Income | |||
| <$10,000 | Ref. | Ref. | Ref. |
| $10,000 – $19,999 | 1.02 (0.90 to 1.15) | 0.89 (0.76 to 1.04) | 1.03 (0.90 to 1.18) |
| $20,000 – $29,999 | 0.86 (0.73 to 1.00) | 0.90 (0.75 to 1.08) | 0.93 (0.81 to 1.06) |
| ≥$30,000 | 0.95 (0.81 to 1.11) | 0.82 (0.69 to 0.98) | 0.89 (0.77 to 1.02) |
| Education | |||
| No College Education | Ref. | Ref. | Ref. |
| Any College Education | 1.09 (0.99 to 1.19) | 0.89 (0.79 to 1.00) | 0.92 (0.84 to 1.02) |
| Physical Component Summary (PCS) Score | |||
| Q1: <30 | Ref. | Ref. | Ref. |
| Q2: 30 – 40 | 0.87 (0.78 to 0.97) | 0.77 (0.67 to 0.87) | 0.83 (0.74 to 0.93) |
| Q3: 41 – 49 | 0.79 (0.69 to 0.91) | 0.79 (0.68 to 0.91) | 0.72 (0.64 to 0.82) |
| Q4: >49 | 0.66 (0.56 to 0.77) | 0.67 (0.57 to 0.78) | 0.53 (0.46 to 0.61) |
| Mental Component Summary (MCS) Score | |||
| Q1: <45 | Ref. | Ref. | Ref. |
| Q2:45 – 55 | 0.88 (0.78 to 1.00) | 0.81 (0.72 to 0.91) | 1.08 (0.96 to 1.21) |
| Q3: 56 – 60 | 0.99 (0.85 to 1.14) | 0.81 (0.69 to 0.95) | 0.95 (0.83 to 1.09) |
| Q4: >60 | 0.92 (0.80 to 1.05) | 0.70 (0.60 to 0.82) | 0.96 (0.86 to 1.08) |
| Number of Chronic Conditions | |||
| <Median (<3) | Ref. | Ref. | Ref. |
| ≥Median (≥3) | 1.26 (1.14 to 1.40) | 1.11 (0.99 to 1.25) | 1.31 (1.19 to 1.43) |
Cochran-Armitage trend test for age effect p<0.05 for all three drug classes. Analyses also adjusted for community and insurance plan characteristics and census division.
DISCUSSION
This study examined predictors of receiving a new prescription for a high-risk medication among elderly Medicare Advantage beneficiaries. We found that female gender, younger age, and poorer self-reported health status predicted receipt of a high-risk prescription. We also noted variation in predictors when stratifying by census division and drug class. Our findings suggest that potentially inappropriate medications are prescribed not only according to patient characteristics, but also to regional practice patterns. The primary contribution of our study is the examination of predictors of use of high-risk medications among new users, which improves upon prior studies that have relied on characteristics of prevalent users to characterize high-risk prescribing patterns. Additional strengths of this analysis include the use of a large, nationally representative sample of Medicare managed care enrollees, and the assessment of a comprehensive set of predictor variables.
Our findings demonstrate that geographic variation in the rate of high-risk prescribing in the Medicare Advantage population is comparable to that reported for traditional Medicare beneficiaries enrolled in stand-alone Part D programs. Zhang and colleagues noted rates of high-risk prescribing at the hospital referral region (HRR) level ranging from 11.4% to 44.0% in the Medicare fee-for-service population following the institution of Part D.8 Similarly, we observed a two-fold difference in the incidence high-risk prescribing between the New England census division (18%) and the West South Central census division (37%) in the elderly Medicare Advantage population. Our analysis revealed that the antihistamines, skeletal muscle relaxants, and opiate pain medications contraindicated by the Zhan criteria account for nearly two-thirds of the high-risk medications prescribed. Pugh and colleagues note that that these drugs are commonly requested by patients, and that the role of patient preferences in high-risk prescribing is yet unknown.9
The protective effect of older age has been observed previously in studies using data from 1999 onward.9,10,25 This finding is consistent with the notion that practitioners have gradually become more familiar with drugs to be avoided in the elderly and have decreased prescribing these medications to older patients at higher risk of having an adverse drug reaction. However, our analyses stratified by census division show a significant protective age effect in the region with the least high-risk prescribing, and little or no age effect in the regions with the most high-risk prescribing. Therefore, our study extends prior research by demonstrating that advanced age may not protect against use of high-risk medications in areas in which norms of practice are more inclined to use these agents.
This study used the Zhan criteria, which is the least inclusive of the existing criteria sets defining high-risk prescribing in the elderly. As such, our analysis provides the most conservative estimates of high-risk prescribing rates in the overall Medicare Advantage population. Compared to prior studies using the Zhan criteria, our analysis revealed comparable rates of high-risk prescribing, with 23.0% of the full study population having at least one high-risk prescription in 2006–7.8,10,26 Our findings suggest that prescribing of these drugs has remained fairly stable in recent years, despite the proliferation of guidelines regarding drugs to be avoided in the elderly. However, approximately two-thirds of individuals with a new prescription for a high-risk medication received only one dispensing, suggesting that high-risk medications are frequently prescribed for short-term episodic care. Although Medicare Part D has increased access to prescription drugs among the elderly, HEDIS reporting of high-risk prescribing has also become mandatory for Medicare Advantage plans. Given these competing forces, it will be important to continue to examine patterns of high-risk prescribing, not only with respect to the number of individuals exposed to high-risk medications, but also to the duration of exposure.
The primary limitation of our study is the potential for exposure misclassification. It is possible that our analysis underestimates the number of individuals exposed to drugs that are sometimes indicated—namely, antihistamines that are available over the counter, such as diphenhydramine and chlorpheniramine. This may result in an underestimation of the overall rate of high-risk prescribing in the sample, and inaccurate identification of predictors of use for this particular sub-group of the Zhan high-risk medications. However, this limitation should not affect estimation of predictors for other classifications of appropriateness, or for other drug classes. Additionally, we were limited to assessing drugs that generated Part D claims which would not include prescriptions paid for entirely out-of-pocket or under non-Part D drug benefits. Although the extent to which this occurs is unknown, we would not expect the use of non-Part D drugs to vary according to enrollees’ high-risk drug exposure status. Such non-differential underestimation is unlikely to negatively impact the findings of this analysis. Our analysis was limited to survey respondents (61.9% of sampled individuals ≥65), as we lacked information about socio-demographic and patient-reported health measures for survey non-respondents. As a result our findings may not be generalizable to the full elderly Medicare Advantage population.
In conclusion, we found high rates of high-risk prescribing in the post-Part D Medicare Advantage population, with muscle relaxants, antihistamines, and opiates accounting for over two-thirds of new dispensings of high-risk medications. We observed wide geographic variation in the use of these medications; persons residing in the Southern regions of the United States have markedly higher use of these medications even after accounting for an extensive set of individual and community-level predictors. Although persons 85 years of age and older were less likely to receive high-risk medications, the protective effect of age was only evident in regions with lower overall use of these agents. These variations may highlight areas for targeted interventions to reduce high-risk prescribing among the elderly.
Supplementary Material
SUPPLEMENTAL FIGURE 1. Study timeline.
Summary.
In the elderly Medicare Advantage population, high-risk medications are prescribed not only according to patient characteristics, but also to regional practice patterns. Such variations highlight areas for targeted interventions to reduce high-risk drug exposure among the elderly:
Women are significantly more likely than men to receive a high-risk prescription; plans may consider targeting female beneficiaries in efforts to reduce exposure
Plans and practitioners operating in southern regions should work together to reduce the high proportion of elderly individuals who receive high-risk prescriptions
Acknowledgments
Funding Sources:
National Institute on Aging; Health Assessment Lab.
References
- 1.Fick DM, Mion LC, Beers MH, Waller JL. Health outcomes associated with potentially inappropriate medication use in older adults. Res Nurs Health. 2008;31:42–51. doi: 10.1002/nur.20232. [DOI] [PMC free article] [PubMed] [Google Scholar]
- 2.Gray CL, Gardner C. Adverse drug events in the elderly: an ongoing problem. J Manag Care Pharm. 2009;15(7):568–571. doi: 10.18553/jmcp.2009.15.7.568. [DOI] [PMC free article] [PubMed] [Google Scholar]
- 3.Bond CA, Raehl CL. Adverse drug reactions in United States hospitals. Pharmacotherapy. 2006;26(5):601–608. doi: 10.1592/phco.26.5.601. [DOI] [PubMed] [Google Scholar]
- 4.Budnitz DS, Shehab N, Kegler SR, Richards CL. Medication use leading to emergency department visits for adverse drug events in older adults. Ann Intern Med. 2007;147:755–765. doi: 10.7326/0003-4819-147-11-200712040-00006. [DOI] [PubMed] [Google Scholar]
- 5.Beers MH, Ouslander JG, Rollingher I, Reuben DB, Brooks J, Beck JC. Explicit criteria for determining inappropriate medication use in nursing home residents. Arch Intern Med. 1991;151(9):1825–1832. [PubMed] [Google Scholar]
- 6.Beers MH. Explicit criteria for determining potentially inappropriate medication use by the elderly: an update. Arch Intern Med. 1997;157(14):1531–1536. [PubMed] [Google Scholar]
- 7.Fick DM, Cooper JW, Wade WE, Waller JL, Maclean JR, Beers MH. Updating the Beers criteria for potentially inappropriate medication use in older adults. Arch Intern Med. 2003;163:2716–2724. doi: 10.1001/archinte.163.22.2716. [DOI] [PubMed] [Google Scholar]
- 8.Zhan C, Sangl J, Bierman AS, et al. Potentially inappropriate medication use in the community-dwelling elderly. JAMA. 2001;286:2823–2829. doi: 10.1001/jama.286.22.2823. [DOI] [PubMed] [Google Scholar]
- 9.Pugh MV, Hanlon JT, Zeber JE, Bierman A, Cornell J, Berlowitz DR. Assessing potentially inappropriate prescribing in the elderly Veterans Affairs population using the HEDIS 2006 quality measures. J Manag Care Pharm. 2006;12(7):537–545. doi: 10.18553/jmcp.2006.12.7.537. [DOI] [PMC free article] [PubMed] [Google Scholar]
- 10.Buck MD, Atreja A, Brunker CP, et al. Potentially inappropriate medication prescribing in outpatient practices: prevalence and patient characteristics based on electronic health records. Am J Geriat Pharmacother. 2009;7:84–92. doi: 10.1016/j.amjopharm.2009.03.001. [DOI] [PubMed] [Google Scholar]
- 11.Hustey FM, Wallis N, Miller J. Inappropriate prescribing in an older ED population. Am J Emerg Med. 2007;25:804–807. doi: 10.1016/j.ajem.2007.01.018. [DOI] [PubMed] [Google Scholar]
- 12.Zhang Y, Baicker K, Newhouse JP. Geographic variation in the quality of prescribing. New Engl J Med. 2010;363(21):1985–1988. doi: 10.1056/NEJMp1010220. [DOI] [PMC free article] [PubMed] [Google Scholar]
- 13.Qato DM, Trivedi AN. Receipt of high risk medications among elderly enrollees in Medicare Advantage plans. J Gen Intern Med. 2013 Apr;28(4):546–553. doi: 10.1007/s11606-012-2244-9. [DOI] [PMC free article] [PubMed] [Google Scholar]
- 14.The State of Health Care Quality 2008. Washington, DC: National Committee for Quality Assurance; 2008. [Google Scholar]
- 15.Medicare Health Outcomes Survey: 2006–2008 Cohort 9 Performance Measurement Data User’s Guide. Centers for Medicare & Medicaid Services; 2008. [Google Scholar]
- 16.Aday L, Andersen R. A framework for the study of access to medical care. Health Serv Res. 1974;9(3):208–220. [PMC free article] [PubMed] [Google Scholar]
- 17.Andersen R, Newman JF. Societal and individual determinants of medical care utilization in the United States. Milbank Q. 1973;51(1):95–124. [PubMed] [Google Scholar]
- 18.Andersen RM. Revisiting the behavioral model and access to medical care: Does it matter? J Health Soc Behav. 1995;36(1):1–10. [PubMed] [Google Scholar]
- 19.Phillips KA, Morrison KR, Andersen R, Aday L. Understanding the context of healthcare utilization: assessing environmental and provider-related variables in the behavioral model of utilization. Health Serv Res. 1998;33(3):571–596. [PMC free article] [PubMed] [Google Scholar]
- 20.Kazis LE, Miller DR, Skinner KM, et al. Applications of methodologies of the Veterans Health Study in the VA Healthcare System. J Ambulatory Care Manage. 2006;29(2):182–188. doi: 10.1097/00004479-200604000-00011. [DOI] [PubMed] [Google Scholar]
- 21.Kazis LE, Selim A, Rogers W, Ren XS, Lee A, Miller DR. Dissemination of methods and results from the Veterans Health Study: Final comments and implications for future monitoring strategies within and outside the Veterans Healthcare System. Journal of Ambulatory Care Management. 2006;29(4):310–319. doi: 10.1097/00004479-200610000-00007. [DOI] [PubMed] [Google Scholar]
- 22.DeSalvo KB, Bloser N, Reynolds K, He J, Muntner P. Mortality prediction with a single general self-rated health question. J Gen Intern Med. 2006;21(3):267–275. doi: 10.1111/j.1525-1497.2005.00291.x. [DOI] [PMC free article] [PubMed] [Google Scholar]
- 23.DeSalvo KB, Jones TM, Peabody J, et al. Health care expenditure prediction with a single item, self-rated health measure. Med Care. 2009;47(4):440–447. doi: 10.1097/MLR.0b013e318190b716. [DOI] [PubMed] [Google Scholar]
- 24.Miilunpalo S, Vuori I, Oja P, Pasanen M, Urponen H. Self-rated health status as a health measure: the predictive value of self-reported health status on the use of physician services and on mortality in the working-age population. J Clin Epidemiol. 1997;50(5):517–528. doi: 10.1016/s0895-4356(97)00045-0. [DOI] [PubMed] [Google Scholar]
- 25.Goulding MR. Inappropriate medication prescribing for elderly ambulatory care patients. Arch Intern Med. 2004;164:305–312. doi: 10.1001/archinte.164.3.305. [DOI] [PubMed] [Google Scholar]
- 26.Simon SR, Chan KA, Soumerai SB, et al. Potentially inappropriate medication use by elderly persons in U.S. health maintenance organizations, 2000–2001. J Am Geriatr Soc. 2005;53:227–232. doi: 10.1111/j.1532-5415.2005.53107.x. [DOI] [PubMed] [Google Scholar]
Associated Data
This section collects any data citations, data availability statements, or supplementary materials included in this article.
Supplementary Materials
SUPPLEMENTAL FIGURE 1. Study timeline.