

Abstract
Background
Cervical dystonia (CD) involves painful involuntary contraction of the neck and shoulder muscles and abnormal posture in middle-aged adults. Botulinum neurotoxin type A (BoNT-A) is effective in treating CD but little is known about its associated cost-effectiveness.
Objective
To evaluate the cost-effectiveness of abobotulinumtoxinA for treating CD from the UK payer perspective.
Methods
A Markov model was developed to evaluate the cost-effectiveness of abobotulinum-toxinA versus best supportive care (BSC) in CD, with a lifetime horizon and health states for response, nonresponse, secondary nonresponse, and BSC in patients with CD (mean age: 53 years; 37% male). Clinical improvement measured using Toronto Western Spasmodic Torticollis Rating Scale (TWSTRS) was mapped to utility using data from a randomized trial of abobotulinumtoxinA. Health care resource use, costs, and other inputs were from the British National Formulary, Personal Social Services Research Unit, published literature, or expert opinion. Costs and outcomes were discounted at 3.5% per annum.
Results
In the base case, the incremental lifetime quality-adjusted life-years (QALYs) gained from abobotulinumtoxinA arm versus BSC was 0.253 per patient, whereas the incremental cost was £7,160, leading to an incremental cost-effectiveness ratio (ICER) of £30,468 per QALY. One-way sensitivity analyses showed that these results were sensitive to the proportion of responders to abobotulinumtoxinA at first injection, duration between injections, the number of reinjections allowed among primary nonresponders, and any difference in baseline TWSTRS value between the BSC and abobotulinumtoxinA arms. Probabilistic sensitivity analysis showed that abobotulinumtoxinA was cost-effective 46% and 49% of times at thresholds of £20,000 and £30,000 per QALY, respectively. Scenarios are considered including vial-sharing, productivity losses, secondary response/nonresponse at subsequent injections, 5-year time horizon, and alternative reinjection intervals for BoNT-As produced ICERs ranging from cost-saving to £40,777 per QALY, versus BSC.
Conclusion
AbobotulinumtoxinA was found to be cost-effective in treating adults with CD, at acceptable willingness-to-pay thresholds in the UK.
Keywords: cost-effectiveness analysis, cervical dystonia, botulinum neurotoxin type A, abobotulinumtoxinA
Introduction
Dystonia is a disorder that causes involuntary contraction of skeletal muscles, abnormal posture, and severe pain or discomfort. Dystonia may be more common than evidence suggests, owing to under-recognition, misdiagnosis, or late clinical presentation.1,2 Cervical dystonia (CD) is the most commonly reported type and mainly affects neck and shoulder muscles in middle-aged patients.3–5 CD’s prevalence in Europe seems to exceed than elsewhere (e.g., up to 233 cases per 1,000,000 population6 vs 89 per 1,000,000 in the US7). Within the UK specifically, data have suggested that there are up to 24,000 cases8 although, interestingly, a much higher estimate (up to 70,000 cases) has been proposed by the Dystonia Society.9 Data on the associated economic burden of CD are scarce. However, 6-month costs for the US have been estimated as $1,255 to $63,320.8 Evidence on lost productivity due to work absenteeism is also sparse, although employment statistics show that at least one-third of patients with CD stop working as the disease progresses.10
Conventional therapeutic options for CD include skeletal muscle relaxants, anticholinergics, and rehabilitative therapy. In addition, some patients need deep brain stimulation therapy and selective peripheral denervation.4 Pharmacotherapy involving botulinum neurotoxin type A (BoNT-A) injection has also proven effective11,12 for CD, especially when combined with conventional therapy. By reducing muscle force, such treatment can alleviate pain, increase the range of free movement, and improve resting posture. Consequently, BoNT-A therapy can reduce the everyday care burden of managing CD13 and also improves patients’ and potentially, caregivers’ quality of life (QoL). BoNT-A usage for CD has also been shown to result in productivity-related gains through decreased absenteeism and sickness leave.14 Also, another study found that, compared with patients on oral medications, more of those on BoNT-A treatments had improvement in employment status (oral medications: 18.5%; BoNT-As: 66.1%) and restoration of full employment with normal productivity (oral medications: 0%; BoNT-As: 12.9%).15 Such results may reflect BoNT-As’ ability to reduce pain and bring about functional improvements in patients with CD, given the strong association between pain and physical dysfunction with job impairment.16
These findings invite questions about the comparative effects of the various BoNT-As available. Currently, three such products are used for CD in the UK: abobotulinumtoxinA (Dysport®: Ipsen Limited, Slough, UK), onabotulinumtoxinA (Botox®: Allergan Limited, Marlow, UK), and incobotulinumtoxinA (Xeomin®: Merz Pharmaceuticals GmbH, Frankfurt/Main, Germany). Of note, although no published head-to-head trials have compared the effectiveness of these BoNT-As, a recent mixed treatment comparison reported similar improvements in scores on the Toronto Western Spasmodic Torticollis Rating Scale (TWSTRS; which comprises three independently scored subscales [severity, disability, pain], with the three scores being summed to give the TWSTRS total score [range 0–87, best to worst]17).18,19 However, evidence also suggests that these BoNT-As differ in key characteristics, including time to first improvement, maximum benefit derived by patients, duration of symptomatic relief, and costs.8,20 This lack of clarity about the relative merits of different BoNT-As in CD is echoed by other key unknowns regarding these drugs. In particular, despite the significant costs of CD to the UK National Health Service(NHS),8 there are no published UK data on the associated productivity losses of patients not treated with BoNT-As nor on the cost-effectiveness of these treatments. Little or no evidence exists on cost-effectiveness of BoNT-As for CD in the UK, although one study21 showed BoNT-As to be cost-effective over a 1-year time horizon relative to BSC from the US government perspective.
With such data gaps in mind, we used economic modeling to assess the cost-effectiveness of abobotulinumtoxinA and other BoNT-As versus best supportive care (BSC) as treatment for CD, from the perspective of the UK NHS and Personal Social Services (PSS). For these purposes, BSC comprised oral medications (including benzodiazepines, baclofen, and anticholinergic agents), deep brain stimulation, and selective peripheral denervation.
Methods
Overview
Ethical permission was not required for this study as it was based purely on secondary data. A Markov model22,23 with a 3-month cycle duration was developed in Microsoft Excel® (2010) to predict the costs, benefits, and incremental cost-effectiveness ratios (ICERs) per life-year and quality-adjusted life-year (QALY) from initiation of BoNT-A therapy or BSC over an analytic time horizon (lifetime in base case; varied in scenario analyses) or until death. The analysis adopted the perspective of the UK NHS and PSS. Model costs and outcomes were discounted at 3.5% per annum based on the National Institute for Health and Care Excellence reference case.24 The currency year for the analyses was 2013.
Key characteristics of the population in the model were intended to closely match those in an abobotulinumtoxinA trial.25 In this study, the mean age was 53.0 years (standard deviation [SD]: 13.0 years); 37% were males and the mean baseline total TWSTRS score was 44.9 (SD: 8.4). As there is no evidence that CD increases mortality risk, the model calculated age-specific mortality using interim life tables from the UK Office for National Statistics.26
Model structure
Figure 1 presents the model structure for the BoNT-A and BSC arms, which was informed by consultation with clinical experts. In the BoNT-A arm, patients with CD starting active treatment are divided into two health states: “no response” or “response.” Response was defined as an improvement in TWSTRS from baseline of at least 20% at week 4 or 8 or 12, in the base case (higher improvement in TWSTRS from baseline (≥30%) has been tested as part of alternative scenario analysis). Owing to unavailability of data, it was assumed that patients not responding to the initial injection do not achieve response in subsequent injection cycles. Similarly, patients who respond to the initial injection are assumed not to develop secondary nonresponse. Accordingly, only the first injection cycle determines the number of responding and nonresponding patients throughout the model. In an alternative scenario, the model assumed that nonresponders could achieve response with subsequent reinjections given at higher doses. Before treatment discontinuation, nonresponders are allowed up to six BoNT-A reinjections (with electromyographic or ultrasound guidance) before moving to BSC. Initial responders were allowed to receive up to four reinjections before becoming secondary nonresponders and may require investigations (a frontalis or anti-BoNT-A antibody titer test) to determine whether they are resistant to the BoNT-A, before they move to BSC. The enforced discontinuation after these cycles of nonresponse is modeled using tunnel states in the Markov design. Additionally, patients receiving BoNT-A may discontinue treatment due to causes such as loss of effect, severe adverse events (AEs), or other reasons according to an annual discontinuation rate. Once patients discontinue treatment, they move on to BSC. At all health states, patients can die. In the nonactive treatment (BSC) arm, patients start and remain in BSC state until death.
Figure 1.

Model structure.
Notes: *Level of response is based on average change of TWSTRS from baseline in the three groups from trial reanalysis. TWSTRS and quality of life are tracked for each health state. All patients at any state are at risk of death.
Abbreviations: BSC, best supportive care; TWSTRS, Toronto Western Spasmodic Torticollis Rating Scale.
Dysphagia is a commonly reported AE that may impair the patient’s QoL or carry certain management costs. Disutility and costs associated with dysphagia were included in the model for the proportion of patients who experience it, but it was assumed not to cause treatment discontinuation.
Model inputs
Efficacy inputs
Data on clinical efficacy (improvements in TWSTRS) were derived from the Phase III placebo-controlled trial of abobotulinumtoxinA (NCT00288509).25 In this study, compared with placebo, a abobotulinumtoxinA produced significant decreases from baseline in the mean TWSTRS total scores compared with placebo at week 4 (−15.6, SD: 2.0 vs −6.7, SD: 2.0; p<0.001) with significant improvements sustained to week 12 (−9.1, SD: 1.7 vs −4.9, SD: 1.7; p=0.019).25 The model assumed that within a model cycle, which was set to be equal to one injection cycle, responders to BoNT-A could experience a sharp improvement in the total TWSTRS score by week 4, with this peaking at week 8, and then waning by week 12. It also assumed that the TWSTRS score at the end of each cycle did not return fully to the baseline value due to residual benefit from BoNT-A as shown in Figure S1. It was also assumed that patients on BSC could benefit from minor improvements in TWSTRS compared to baseline.
Other clinical inputs such as reinjection interval, annual rate of all-cause treatment discontinuation, and AE rates for dysphagia per injection are given in Table S1, with corresponding assumptions.
Utility inputs
For the model, death was assigned a utility of 0 and 1 represented a state of perfect health. Utility data were derived from the Phase III trial of abobotulinumtoxinA.25 Specifically, the relationship between TWSTRS and utility was determined using a repeated-measures logistic regression analysis on the 36-item Short Form Health Survey and TWSTRS data at baseline or week 12 (Table S2, Figure 2). A preference-based value set was applied to patient responses to the 36-item Short Form Health Survey to obtain utilities. In the model, utility was linked at all times to the TWSTRS score such that improvement or worsening of TWSTRS corresponded with an increasing or decreasing utility. The calculated baseline utility and utility gains at weeks 0, 4, 8, and 12 are detailed in Table 1.
Figure 2.
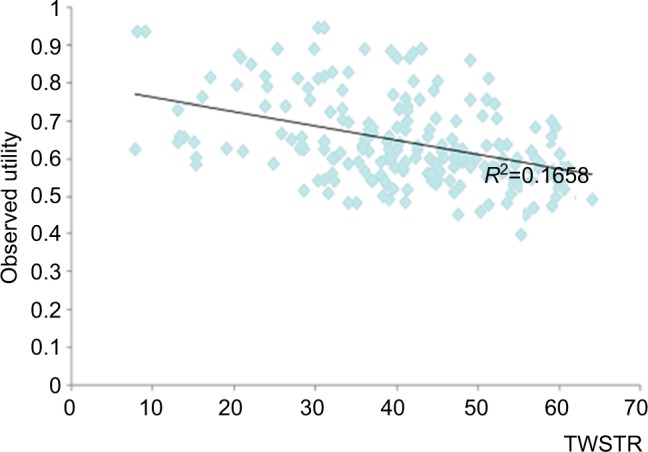
Graphical representation of linkage between utility and TWSTRS estimated from analysis of abobotulinumtoxinA trial. Data extrapolated from a previous study.25
Notes: The line represents the best fit to the available data given by the blue points showing reduced utility with higher TWSTRS total score.
Abbreviation: TWSTRS, Toronto Western Spasmodic Torticollis Rating Scale.
Table 1.
Discounted costs and health outcomes in base-case analysis
| Costs | AbobotulinumtoxinA (£) | BSC without BoNT-A injections (£) | Incremental (AbobotulinumtoxinA vs BSC) (£) |
|---|---|---|---|
| Drug cost | 5,188 | 0 | 5,188 |
| Concomitant medications cost | 429 | 488 | −59 |
| Drug administration cost | 4,600 | 0 | 4,600 |
| Disease management cost | 6,300 | 8,869 | −2,569 |
| Indirect cost | – | – | – |
| Total cost | 16,517 | 9,357 | 7,160 |
| Health outcomes | AbobotulinumtoxinA | BSC without BoNT-A injections | Incremental |
| Life-years | 18.042 | 18.042 | 0.000 |
| QALYs | 11.970 | 11.735 | 0.235 |
| Mean treatment duration with BoNT-A (years) | AbobotulinumtoxinA | ||
| Mean treatment duration (years) | 10.309 | ||
| Nonresponders | 0.575 | ||
| Responders | 9.734 | ||
| Cost-effectiveness results | AbobotulinumtoxinA vs BSC without BoNT-A injections | ||
| Incremental QALYs gained | 0.235 | ||
| Incremental costs | £7,160 | ||
| Incremental cost per QALY (ICER) | £30,468 | ||
Abbreviations: BoNT-A, botulinum neurotoxin type A; BSC, best supportive care; ICER, incremental cost-effectiveness ratio; QALYs, quality-adjusted life-years.
Resource use and cost inputs
Direct medical costs in the model comprised the value of all goods, services, and other resources involved in providing the intervention and all current and future consequences linked to the disease process. These included primarily drug costs, administration costs, and disease management costs as outlined in Table 2. All other resources used, concomitant medication costs, and unit costs are detailed in Table S1. In particular, the model assumed that the drug dose varied between first injection and reinjections, as well as among health states with different response levels (nonresponders and responders). Reinjections were associated with a higher dose than first injection, as real-world treatment patterns indicate that doctors normally start with the lowest dose and increase it gradually in subsequent injections if the patient does not respond. Consequently, nonresponders have a higher average dose than responders. Model inputs for first injection were obtained from the summary of product characteristics (SmPC) for each BoNT-A,27–29 while doses and treatment intervals for subsequent injections were those suggested by clinical experts.
Table 2.
Direct and indirect costs (please refer to Table S1 for further details on the base-case model inputs)
| Costs | Details | Source/assumptions |
|---|---|---|
| Direct costs | ||
| Drug costs | £154 per 500 unit vial at initial dose of BoNT-A, 750 units at subsequent doses; £0 for BSC | Dose varied between first injection and reinjections, as well as among health states with different response levels (nonresponders and responders). Model inputs for drug costs were derived from the BNF,34 the SmPC of BoNT-A products,27–29 and expert clinical input |
| Drug administration costs | £146 per neurologist visit for each cycle of BoNT-A; £0 for BSC | Incurred for each injection according to the treating health care professional who administered the BoNT-A injection and the frequency of treatments. Estimated using costs from the PSS,35 frequency of visits from the US ANCHOR-CD study (Ipsen Pharma, unpublished data, 2012), and UK clinical experts |
| Disease management costs | £138 per year for BoNT-A; £493 per year for BSC | Hospitalizations, surgery, or health care professional visits that arise in addition to BoNT-A administration visits or costs of not being treated with BoNT-As. Calculated based on costs derived from Unit Costs of Health and Social Care 2011” published by PSS in the UK and “National Schedule of Reference Costs Year 2010–2011” published by Department of Health in the UK.35 Frequency of disease management interventions was based on consultation with clinical experts in the UK |
| Indirect costs* | ||
| Productivity loss | Average hourly wage was £12.76. Number of hours lost per week: 2 hours for BoNT-A; 5 hours for BSC |
Indirect costs per week were estimated by multiplying the lost productivity time by the average hourly income in the UK. Average hourly wage was based on data from the ONS26 and the number of hours lost derived from published literature30 |
Note:
Indirect costs are only included as part of alternative scenario analysis.
Abbreviations: ANCHOR-CD, AbobotulinumtoxinA Neurotoxin: Clinical and Health Economics Outcomes Registry in Cervical Dystonia; BNF, British National Formulary; BoNT-A, botulinum neurotoxin type A; BSC, best supportive care; ONS, Office for National Statistics; PSS, Personal Social Services; SmPC, summary of product characteristics.
Drug administration costs were incurred for each injection according to the health care professional who gave the BoNT-A injection and the frequency of treatments. Concomitant medication costs were incurred for medications used by patients with CD in addition to BoNT-A therapy. Disease management costs comprised those of hospitalizations, surgery, or health care professional visits required additionally to those for BoNT-A administration.
Indirect costs primarily included costs associated with productivity losses of patients with CD. To quantify the economic impact of productivity losses, lost productive time (LPT) from Stacy et al (2012)30 was used to estimate the per-person hours per week associated with reduced performance at work (“presenteeism”) and absence from work (“absenteeism”) due to disability. The associated indirect costs per week were estimated by multiplying the LPT by the average hourly income in the UK (given in Table S1). Due to unavailability of data, indirect costs for time to doctor office visits and for caregivers’ time were not considered.
Analyses
Base-case analysis
The base-case analysis compared the costs and QALYs, discounted at 3.5%, of using abobotulinumtoxinA versus BSC, from the NHS and PSS perspective over a lifetime horizon in a scenario where response is considered as at least 20% improvement in TWSTRS total score from baseline and vial-sharing was not allowed. The base-case model parameters are presented in Table S1 alongside their assumptions, with the exception of indirect costs, which were considered only in an alternative scenario analysis described ahead.
Alternative scenario analysis
Alternative scenario analyses were conducted to test the following assumptions: productivity losses incurred by patients with CD; sharing of vials; analytic time horizon of 5 years; injection cycles as in the SmPCs, specifically, 16 weeks for abobotulinumtoxinA,28 10 weeks for incobotulinumtoxinA,29 10 weeks cycle for onabotulinumtoxinA27; at least 30% improvement in TWSTRS from baseline and allowance of secondary nonresponse following the initial BoNT-A injection, or achievement of response at subsequent injection cycles for initial nonresponders. The following comparisons were also performed: onabotulinumtoxinA versus BSC; incobotulinumtoxinA versus BSC; abobotulinumtoxinA versus onabotulinumtoxinA; and abobotulinumtoxinA versus incobotulinumtoxinA.
One-way sensitivity analysis
To identify model drivers and examine key areas of uncertainty within the model, one-way sensitivity analyses were provided for all major model variables. Parameters were varied between a minimum and maximum range that was determined directly from published data. Where data were not available to inform this range, the minimum and maximum values were ±20% of the base-case value. Tornado diagrams were generated for incremental costs, incremental QALYs and ICERs, and incremental net benefit using a £20,000/QALY threshold. Table S3 lists the parameters varied in one-way sensitivity analysis.
Probabilistic sensitivity analysis
To account for multivariate and stochastic uncertainties in the model, a probabilistic sensitivity analysis was performed. Probabilistic parameters were defined according to appropriate statistical distributions to ascertain uncertainty. The selection of distributions was dependent on the nature of the underlying parameter, with beta distribution being used for probabilities and utilities, and gamma distribution used for positively valued parameters such as the costs.
The probabilistic sensitivity analysis was run for 5,000 simulations. The incremental gains in terms of QALYs were plotted against incremental costs of abobotulinumtoxinA and its comparators on the cost-effectiveness plane. A cost-effectiveness acceptability curve was generated to show the probability of being cost-effective for each treatment over a range of willingness-to-pay values for a QALY. Table S4 lists the distribution of parameters varied in probabilistic sensitivity analysis.
Results
Base-case results
The discounted costs and health outcomes for abobotulinumtoxinA and BSC for the base case are given in Table 1. The total incremental QALYs gained from abobotulinumtoxinA compared to BSC was 0.235 per patient, with the total incremental cost being £7,160. This corresponds to an ICER of £30,468 per QALY gained.
Alternative scenario results
The results of abobotulinumtoxinA versus BSC for the alternative scenarios are presented in Table 3. With vial-sharing, the total incremental QALYs gained were unchanged but the associated total incremental costs were £6,234, corresponding to an ICER of £26,526 per QALY (i.e., lower than the base-case ICER). When productivity losses were considered, the QALYs remained unchanged but the total incremental costs were –£7,311, implying that abobotulinumtoxinA usage was cost-saving compared to BSC. Changing the time horizon to 5 years resulted in total incremental costs of £2,809, incremental QALYs of 0.083, and an ICER of £38,117. Considering 5% secondary nonresponders and 25% secondary responders resulted in total incremental QALYs of 0.247, total incremental costs of £10,072, and an ICER of £40,777. With a 16-week reinjection interval for abobotulinumtoxinA,28 the incremental costs and QALYs were found to be £5,396 and 0.252, respectively, with an associated ICER of £21,413. Considering response as 30% improvement in TWSTRS from baseline resulted in an ICER of £29,089 (i.e., lower than the base-case ICER).
Table 3.
Alternative scenario results: abobotulinumtoxinA compared to BSC
| Scenario | AbobotulinumtoxinA
|
BSC
|
Incremental (AbobotulinumtoxinA vs BSC)
|
||||
|---|---|---|---|---|---|---|---|
| Total costs (discounted) | QALYs | Total costs (discounted) | QALYs | Total costs (discounted) | QALYs | ICERs | |
| Base case | £16,517 | 11.970 | £9,357 | 11.735 | £7,160 | 0.235 | £30,468 |
| Considering 5% secondary nonresponders and 25% secondary responders | £19,429 | 11.982 | £9,357 | 11.735 | £10,072 | 0.247 | £40,777 |
| Considering 16 weeks reinjection interval for abobotulinumtoxinA* | £14,728 | 11.948 | £9,332 | 11.696 | £5,396 | 0.252 | £21,413 |
| Considering response as ≥30% improvement in TWSTRS from baseline | £16,222 | 11.974 | £9,357 | 11.738 | £6,865 | 0.236 | £29,089 |
| Considering indirect costs due to productivity loss | £61,971 | 11.970 | £69,282 | 11.735 | −£7,311 | 0.235 | Cost-saving |
| Considering vial-sharing | £15,591 | 11.970 | £9,357 | 11.735 | £6,234 | 0.235 | £26,526 |
| Time horizon = 5 years | £5,443 | 2.942 | £2,280 | 2.859 | £2,809 | 0.083 | £38,117 |
Note:
Same reinjection interval (16 weeks) was assumed for BSC.
Abbreviations: BSC, best supportive care; ICERs, incremental cost-effectiveness ratios; QALYs, quality-adjusted life-years; TWSTRS, Toronto Western Spasmodic Torticollis Rating Scale.
Table S5 presents comparisons of onabotulinumtoxinA and incobotulinumtoxinA versus BSC and abobotulinumtoxinA versus onabotulinumtoxinA and incobotulinumtoxinA for 12- and 10-week reinjection intervals. Compared to BSC, the ICERs for onabotulinumtoxinA and incobotulinumtoxinA were £48,978 and £58,554 for the 12-week injection cycle, and £48,625 and £44,933 for the 10-week interval, respectively, due to higher drug-acquisition costs associated with onabotulinumtoxinA and incobotulinumtoxinA compared to abobotulinumtoxinA.
One-way sensitivity analysis results
One-way (deterministic) sensitivity analysis was conducted on the parameters listed in Table S3. The tornado diagrams given in Figures S2–S5 show the most influential parameters on outcomes for abobotulinumtoxinA versus BSC. Incremental costs were most influenced by the proportion of responders to abobotulinumtoxinA at first injection, duration of the reinjection interval, and the number of cycles of reinjection allowed among primary nonresponders. Incremental QALYs and incremental net benefit were most sensitive to number of cycles of reinjection allowed amongst primary nonresponders and proportion of responders and nonresponders to abobotulinumtoxinA at first injection. ICERs were most sensitive to TWSTRS value at baseline among BSC and abobotulinumtoxinA patients and the number of cycles of reinjection allowed among primary nonresponders.
Probabilistic sensitivity analysis results
Results of the probabilistic sensitivity analysis conducted for the base case are presented in Figures 3 and 4. The cost-effectiveness plane shows that, although abobotulinumtoxinA is more costly than BSC, it is also more effective. The CEAC showed that abobotulinumtoxinA had a 46% probability of being cost-effective at a threshold of £20,000 compared to BSC without BoNT-A injections.
Figure 3.

Cost-effectiveness planes of incremental costs per QALY of abobotulinumtoxinA versus BSC.
Abbreviation: BSC, best supportive care; QALY, quality-adjusted life-year.
Figure 4.

Cost-effectiveness acceptability curves of abobotulinumtoxinA and BSC without toxins injections.
Abbreviation: BSC, best supportive care.
Discussion
Our economic model showed for patients with CD in the UK that abobotulinumtoxinA was cost-effective compared to BSC, at a maximum acceptable willingness-to-pay threshold of £30,000 per QALY24 under base-case assumptions. Specifically, the treatment provided a lifetime gain of 0.235 QALYs at an incremental cost of £7,160 and the health benefits was attributable to a reduction in the severity of CD (as measured by TWSTRS, which correlated directly with patients’ utility). In addition, the results remained broadly consistent in both testing of alternative scenarios to the base cases and across a range of sensitive analyses. Overall, therefore, our findings represent a significant development in the knowledge of the economic and health benefits of using BoNT-As for this indication, given that few other economic evaluations of these treatments for CD have been previously published.21,31
As with many models, ours had limitations arising from data availability and structural assumptions. In terms of clinical response, data were available to estimate the proportion of responders and their improvement in TWSTRS total score for the first injection cycle from clinical trial25 but not for subsequent cycles. Therefore, it was assumed that only the first injection determined response, although in clinical practice additional responses would probably be achieved in subsequent cycles for more patients. Furthermore, there was a lack of data on the quantities of abobotulinumtoxinA administered and health care resources consumed in managing patients. We made the assumption that the utility–TWSTRS relationship, which was estimated based on data from one cycle of botulinum toxin use, would apply equally to subsequent cycles, though we cannot know how this relationship may differ at later times. Having to extrapolate outcomes beyond the timeframe of available clinical data was another unavoidable limitation – one commonly encountered in this type of evaluation.
A key strength of our study is how it took account of productivity gains resulting from effective treatment for CD. The importance of CD’s effect on productivity has been recognized previously, although studies have not generally quantified it suitably for subsequent use in economic evaluations. For instance, a study of almost 300 patients by the Finnish Dystonia Association32 found 97 subjects (39%) had retired because of CD at a median age of 48 years, while many others reported sick leave, reduced productivity, and loss of employment.14,33 Similarly, a second study found 53.3% of patients with CD reported that employment status was negatively affected through reduced hours or responsibilities, including 18.9% of patients who had lost employment due to CD symptoms.15
Another reason that is essential to demonstrate the cost-effectiveness of BoNT-A is that many patients receive inappropriate treatment (e.g., physiotherapy alone), given that CD is an under-recognized condition and BoNT-As are consequently underutilized for CD. To the extent that cost of treatment with BoNT-A is a potential barrier, it is important to communicate the cost-effectiveness of BoNT-A. In conclusion, we believe that in demonstrating the cost-effectiveness of abobotulinumtoxinA as treatment for CD, our study makes a compelling case for wider use in the UK of such therapy that can benefit patients with this physically and psychologically debilitating condition.
Conclusion
The use of abobotulinumtoxinA in adult patients with CD was found to be cost-effective at an acceptable willingness-to-pay threshold in the UK and also provided additional QoL gains. This evidence should help to inform clinical decision making and commissioning where BoNT-A therapy is being considered as a potential treatment for CD.
Supplementary materials
Illustration of QALY gain in first (A) and subsequent cycle (B) when TWSTRS is assumed to have residual benefit at week 12.
Abbreviations: QALYs, quality-adjusted life-years; TWSTRS, Toronto Western Spasmodic Torticollis Rating Scale.
Tornado diagram of one-way sensitivity analysis on incremental cost.
Abbreviations: BSC, best supportive care; BoNT-A, botulinum neurotoxin type A.
Tornado diagram of one-way sensitivity analysis on incremental benefit.
Abbreviations: BSC, best supportive care; QALY, quality-adjusted life-year; TWS, Toronto Western Spasmodic.
Tornado diagram of one-way sensitivity analysis on ICER.
Abbreviations: BSC, best supportive care; ICER, incremental cost-effectiveness ratio; TWS, Toronto Western Spasmodic.
Tornado diagram of one-way sensitivity analysis on incremental net benefit with a willingness-to-pay threshold of £20,000/QALY.
Abbreviations: BSC, best supportive care; INB, incremental net benefit; QALY, quality-adjusted life-year; TWS, Toronto Western Spasmodic.
Table S1.
Model inputs
| Parameters | Base case
|
Source/assumptions | |||
|---|---|---|---|---|---|
| AbobotulinumtoxinA | OnabotulinumtoxinA | IncobotulinumtoxinA | BSC | ||
| Clinical inputs | |||||
| Change from baseline of TWSTRS at weeks 4, 8, 12 (mean (SE)) | |||||
| TWSTRS change from baseline at 4 weeks | −5.0 (2.0) | AbobotulinumtoxinA trial1 | |||
| No response | −0.6 (0.0) | −0.6 (0.0) | −0.6 (0.0) | – | AbobotulinumtoxinA trial 1 |
| Response | −20.3 (2.0) | −20.3 (2.0) | −20.3 (2.0) | – | OnabotulinumtoxinA and incobotulinumtoxinA are assumed to have same response as abobotulinumtoxinA |
| TWSTRS change from baseline at 8 weeks | −4.2(2.0) | AbobotulinumtoxinA trial1 | |||
| No response | −0.1 (0.0) | −0.1 (0.0) | −0.1 (0.0) | – | AbobotulinumtoxinA trial1 |
| Response | −18.3 (2.0) | −18.3 (2.0) | −18.3 (2.0) | – | OnabotulinumtoxinA and incobotulinumtoxinA are assumed to have same response as abobotulinumtoxinA |
| TWSTRS change from baseline at 12 weeks | −3.3 (2.0) | AbobotulinumtoxinA trial1 | |||
| No response | −0.2 (0.1) | −0.2 (0.1) | −0.2 (0.1) | – | AbobotulinumtoxinA trial1 |
| Response | −9.4 (2.0) | −9.4 (2.0) | −9.4 (2.0) | – | OnabotulinumtoxinA and incobotulinumtoxinA are assumed to have same response as abobotulinumtoxinA |
| Response rate of first injection for BoNT-A therapies (%) | |||||
| Response rate of first injection | |||||
| No response | 37.0 | 37.0 | 37.0 | AbobotulinumtoxinA trial1 | |
| Response | 63.0 | 63.0 | 63.0 | OnabotulinumtoxinA and incobotulinumtoxinA are assumed to have same response as abobotulinumtoxinA | |
| Response rate of subsequent injection for BoNT-A therapies (%) | |||||
| Annual rate of response after initial nonresponse (rate per year) | 0.0 | 0.0 | 0.0 | Patients who do not respond at the initial injection do not achieve response in subsequent injection cycles | |
| Annual rate of secondary nonresponse after initial response (rate per year) | 0.0 | 0.0 | 0.0 | Similarly, patients who achieve response at the initial injection do not develop secondary nonresponse | |
| Reinjection interval for BoNT-A therapies (weeks) | |||||
| Duration of treatment cycle (weeks) | 12.0# | 12.0## | 12.0### | Assumed to be in line with abobotulinumtoxinA SmPC2 and experts clinical opinion | |
| Annual rate of all-cause treatment discontinuation (%) | |||||
| Discontinuation rate per year | |||||
| No response | 1.1 | 1.1 | 1.1 | – | Kessler et al (1999)3 |
| Response | 1.1 | 1.1 | 1.1 | – | |
| Adverse events by BoNT-A therapies (%) | |||||
| Dysphagia rate per injection | 15 | 19 | 13 | – | Inferred from SmPCs of BoNT-A products2,4,5 |
| Utility inputs | |||||
| Baseline utility and utility gains (mean) | |||||
| BoNT-A | BSC 0.6368 | Calculated from estimated utility-TWSTRS relationship and TWSTRS data at weeks 0, 4, 8, and 12 | |||
| Baseline utility | |||||
| No response | 0.6398 | ||||
| Response | 0.6349 | ||||
| QALYs gain per person for | 0.0026 | ||||
| first cycle | |||||
| No response | 0 | 0 | 0 | ||
| Response | 0.0117 | 0.0117 | 0.0117 | ||
| QALY gain per person for subsequent cycles | 0.0035 | ||||
| No response | 0 | 0 | 0 | ||
| Response | 0.0130 | 0.0130 | 0.0130 | ||
| Resource use and cost inputs | |||||
| Drug costs | |||||
| Cost per vial | £154.00 per 500 unit vial, £92.40 per 500 unit vial | £276.40 per 200 unit vial, £138.20 per 100 unit vial | £129.90 per 100 unit vial, £72.00 per 50 unit vial | – | BNF6 |
| Average dose per cycle: first injection | |||||
| Mean dose (units) | 500 | 200 | 200 | – | SmPC of BoNT-A products2,4,5 |
| Average dose per cycle: subsequent injections | |||||
| Mean dose (units) – no response | 750 | 300 | 300 | Expert clinical input | |
| Mean dose (units) – response | 400 | 133 | 160 | ||
| Drug administration costs and frequency of use of BoNT-A therapies | |||||
| Cost per injection (per visit) for BoNT-A therapies | Frequency of use (for 1 visit per injection) for BoNT-A | Frequency of use (for 1 visit per injection)for BSC | Administration costs were derived from PSS7 Frequency of visits was collected from Ipsen US ANCHOR-CD study (Ipsen Pharma, unpublished data, 2012) and verified with clinical experts in the UK |
||
| Neurologist visit | £146.00 | 73.5% | NA | ||
| Neurophysiologist visit | £146.00 | 26.5% | NA | ||
| Nurse visit | £42.00 | 0.0% | NA | ||
| Concomitant medication costs and frequency of use | |||||
| Unit costs (per mg) | Dose per day (mg) | Unit drug costs and dosing schedule for concomitant medications were obtained from BNF6 | |||
| Anticholinergics | £0.0070 | 1 | |||
| Benzodiazepines | £0.0720 | 1 | |||
| Analgesics | £0.0003 | 1,000 | |||
| Dopamine antagonist | £0.0990 | 2.5 | |||
| Beta blockers | £0.0011 | 40 | |||
| Baclofen | £0.0020 | 60 | |||
| Antiepileptics | £0.0006 | 600 | |||
| Other muscle relaxants | £0.0094 | 7.5 | |||
| Frequency of use (for BoNT-As and BSC) | BoNT-A (%) | BSC (%) | Distribution of frequency of use among different drugs were collected from Ipsen US ANCHOR-CD study (Ipsen Pharma, unpublished data, 2012) and verified with clinical experts in UK | ||
| % of patients taking concomitant medications | 35 | 50 | |||
| Anticholinergics | 0.6 | 0.6 | |||
| Benzodiazepines | 23.5 | 26.5 | |||
| Analgesics | 33.5 | 33.5 | |||
| Dopamine antagonist | 0.6 | 0.6 | |||
| Beta blockers | 0.6 | 0.6 | |||
| Baclofen | 3.2 | 3.2 | |||
| Antiepileptics | 5.8 | 5.8 | |||
| Other muscle relaxants | 29.2 | 29.2 | |||
| Disease management costs and frequency of disease management interventions | |||||
| Unit costs | Frequency per year (for BoNT-A) | Frequency per year (for BSC) | The disease management costs were derived from “Unit Costs of Health and Social Care 2011” published by (PSS) in the UK and “National Schedule of Reference Costs Year 2010–2011” published by Department of Health in the UK7 The frequency of disease management interventions was based on consultation with clinical experts in UK |
||
| Neurologist visit (excluding BoNT-A injection per visit) | £146.00 | 0 | 2 | ||
| GP visit (per visit) | £53.00 | 2 | 2 | ||
| Hospitalization (per day) | £428.00 | 1.5% | 1.5% | ||
| Average length of stay | – | 5 | 5 | ||
| Deep brain stimulation (per surgery) | £4,384.89 | NA | 1% | ||
| Selective peripheral denervation (per surgery) | £1,867.00 | NA | 1% | ||
| Indirect costs* | |||||
| Median hourly wage in the UK (per hour) | £12.76 | Median hourly wage reported by Office for National Statistics Survey for 20138 |
|||
| LPT due to patients with CD and carers combined (number of hours per week) | |||||
| Productivity loss | 2 | 5 | The model uses LPT due to absenteeism and presenteeismfrom Stacy et al (2012)9 Indirect costs due to time to doctor office visit and caregiver time are not considered, since no data was available |
||
| Time to doctor office visit | – | – | |||
| Caregiver time | – | – | |||
| Total | 2 | 5 | |||
Notes:
Indirect costs are not included in the base case analysis.
For AbobotulinumtoxinA, it is 16 weeks as per AbobotulinumtoxinA SmPC – this is tested as part of scenario analyses,
For OnabotulinumtoxinA, it is 10 weeks as per OnabotulinumtoxinA SmPC – this is also tested as part of scenario analyses,
For IncobotulinumtoxinA, it is 10 weeks as per IncobotulinumtoxinA SmPC – this is also tested as part of scenario analyses.
Abbreviations: ANCHOR-CD, AbobotulinumtoxinA Neurotoxin: Clinical and Health Economics Outcomes Registry in Cervical Dystonia; BNF, British National Formulary; BoNT-A, botulinum neurotoxin type A; BSC, best supportive care; GP, general practitioner; LPT, lost productive time; PSS, Personal Social Services; QALYs, quality-adjusted life-years; SE, standard error; SmPC, summary of product characteristics; TWSTRS, Toronto Western Spasmodic Torticollis Rating Scale; NA, not available.
Table S2.
Estimates of statistical model linking utility and TWSTRS based on analysis of abobotulinumtoxinA trial
| Parameter | Parameter estimate | Parameter |
|---|---|---|
| Intercept | 1.255 | |
| Coefficient for TWSTRS | −0.0159 | |
| Covariance matrix Intercept | Coefficient for TWSTRS | |
| Intercept | 0.01157 | |
| Coefficient for TWSTRS | −0.000234 | 5.437E-06 |
Abbreviations: TWSTRS, Toronto Western Spasmodic Torticollis Rating Scale.
Table S3.
Parameters included in one-way sensitivity analysis
| Parameter/variable name | Description | Base-case input | Low value | High value |
|---|---|---|---|---|
| discH | Discount rate for health (%) | 0.035 | 0.028 | 0.042 |
| discC | Discount rate for cost (%) | 0.035 | 0.028 | 0.042 |
| iAge | Age (years) | 53.00 | 42.400 | 63.600 |
| pMale | Gender (% male) | 0.37 | 0.296 | 0.444 |
| TWSBline_NonResp | Mean baseline TWSTRS – nonresponders: abobotulinumtoxinA | 42.79 | 34.232 | 51.348 |
| TWSBline_Resp | Mean baseline TWSTRS – responders: abobotulinumtoxinA | 44.12 | 35.296 | 52.944 |
| TWSBline_BSC | Mean baseline TWSTRS – BSC | 43.63 | 34.902 | 52.353 |
| Coeff_TWS | Coefficient for TWSTRS | −0.02 | −0.019 | −0.013 |
| Coeff_Inter | Intercept | 1.26 | 1.004 | 1.506 |
| iReinj_PriNonResp | Number of reinjection attempts for primary nonresponders before abandoning treatment | 6.00 | 4.800 | 7.200 |
| iReinj_SecNonResp | Number of reinjection attempts for secondary nonresponders before abandoning treatment | 4.00 | 3.200 | 4.800 |
| TWSChangeAt4Wks_Abo_nonresponder | AbobotulinumtoxinA_TWSTRS change from baseline at 4 weeks – nonresponders | −0.61 | −0.643 | −0.583 |
| TWSChangeAt4Wks_Abo_fullresponder | AbobotulinumtoxinA _TWSTRS change from baseline at 4 weeks – responders | −20.29 | −22.290 | −18.290 |
| TWSChangeAt8Wks_Abo_nonresponder | AbobotulinumtoxinA _TWSTRS change from baseline at 8 weeks – nonresponders | −0.14 | −0.140 | −0.136 |
| TWSChangeAt8Wks_Abo_responder | AbobotulinumtoxinA _TWSTRS change from baseline at 8 weeks – responders | −18.30 | −20.300 | −16.300 |
| TWSChangeAt12Wks_Abo_nonresponder | AbobotulinumtoxinA _TWSTRS change from baseline at 12 weeks – nonresponders | −0.21 | −0.283 | −0.143 |
| TWSChangeAt12Wks_Abo_fullresponder | AbobotulinumtoxinA _TWSTRS change from baseline at 12 weeks – responders | −9.35 | −11.350 | −7.350 |
| TWSChangeAt4Wks_BSC | BSC_TWSTRS change from baseline at 4 weeks | −4.97 | −6.970 | −2.970 |
| TWSChangeAt8Wks_BSC | BSC_TWSTRS change from baseline at 8 weeks | −4.22 | −6.220 | −2.220 |
| TWSChangeAt12Wks_BSC | BSC_TWSTRS change from baseline at 12 weeks | −3.32 | −5.320 | −1.320 |
| distriFirstInj_Abo_nonresponder | Probability of nonresponse at first injection | 0.37 | 0.296 | 0.444 |
| distriFirstInj_Abo_responder | Probability of response at first injection | 0.63 | 0.504 | 0.756 |
| pAE_Abo | AE rate per injection: abobotulinumtoxinA (%) | 15% | 12% | 18% |
| dFirstInj_Abo | AbobotulinumtoxinA _first injection dosage: mean dose (unit) | 500.00 | 400.000 | 600.000 |
| dFirstInj_Ona | OnabotulinumtoxinA _first injection dosage: mean dose (unit) | 200.00 | 160.000 | 240.000 |
| dFirstInj_Inco | IncobotulinumtoxinA _first injection dosage: Mean dose (unit) | 200.00 | 160.000 | 240.000 |
| dReinj_Abo_nonresponder | Average abobotulinumtoxinA reinjection dosage: nonresponder (unit) | 750.00 | 600.000 | 900.000 |
| dReinj_Abo_responder | Average abobotulinumtoxinA reinjection dosage: responder (unit) | 400.00 | 320.000 | 480.000 |
| cDrugFirstInj_Abo | AbobotulinumtoxinA _first injection cost (£) | 154.00 | 123.200 | 184.800 |
| cDrugReinj_Abo_nonresponder | AbobotulinumtoxinA _reinjections cost – nonresponder (£) | 246.40 | 197.120 | 295.680 |
| cDrugReinj_Abo_fullresponder | AbobotulinumtoxinA _reinjections cost – responder (£) | 154.00 | 123.200 | 184.800 |
| cConMed_BoNTA | Concomitant Meds Cost_BoNTA (£) | 0.05 | 0.042 | 0.062 |
| cConMed_BSC | Concomitant Meds Cost _BSC (£) | 0.07 | 0.059 | 0.089 |
| cDrugAdmin | Cost Drug Admin (£) | 146.00 | 116.800 | 175.200 |
| cDisMgt_Abo | Cost Disease Management_AbobotulinumtoxinA (£) | 31.77 | 25.419 | 38.129 |
| cDisMgt_BSC | Cost Disease Management _BSC (£) | 113.31 | 90.645 | 135.967 |
| cAE | Cost AEs_BoNTA (£) | – | – | – |
| cIndirect_BoNTA | Cost Indirect_Abo (£) | 306.24 | 244.992 | 367.488 |
| cIndirect_BSC | Cost Indirect_BSC (£) | 765.60 | 612.480 | 918.720 |
| timeYearsInCycle_Abo | Reinjection Interval (years) | 0.23 | 0.184 | 0.276 |
Abbreviations: AE, adverse event; BoNTA, botulinum neurotoxin type A; BSC, best supportive care; TWSTRS, Toronto Western Spasmodic Torticollis Rating Scale.
Table S4.
Parameters included in probabilistic sensitivity analysis
| Parameter | Distribution |
|---|---|
| Utility at each TWSTRS score (based on mapping) | Multivariate normal (Cholesky) |
| Mean baseline TWSTRS distribution, nonresponders and responders at 0, 4, 8, 12 weeks | Gamma |
| Transition probability: response to secondary nonresponse | Beta |
| Duration of treatment cycle: abobotulinumtoxinA | Gamma |
| Treatment discontinuation rate per year | Gamma |
| AbobotulinumtoxinA_first injection dosage | Gamma |
| AbobotulinumtoxinA_reinjection dosage: nonresponder | Gamma |
| AbobotulinumtoxinA_reinjection dosage: responder | Gamma |
| Setting where drug is administered (distribution) | |
| Neurologist visit | Beta |
| Physiotherapist visit | Beta |
| Nurse visit | Beta |
| Disease management | |
| Neurologist visit (excluding BoNT-A injection) per year | Gamma |
| GP visit per year | Gamma |
| Hospitalization rate per year: BoNT-A | Beta |
| Hospitalization rate per year: BSC | Beta |
| Length of stay for hospitalization: BoNT-A | Gamma |
| Length of stay for hospitalization: BSC | Gamma |
Abbreviations: BSC, best supportive care; BoNT-A, botulinum neurotoxin type A; GP, general practitioner; TWSTRS, Toronto Western Spasmodic Torticollis Rating Scale.
Table S5.
Alternative scenario results: other comparisons
| Scenario | OnabotulinumtoxinA
|
BSC
|
Incremental (onabotulinumtoxinA vs BSC)
|
||||
|---|---|---|---|---|---|---|---|
| Total costs (discounted) | QALYs | Total costs (discounted) | QALYs | Total costs (discounted) | QALYs | ICERs | |
| Base case | £20,573 | 11.964 | £9,357 | 11.735 | £11,216 | 0.229 | £48,978 |
| Considering 10 weeks reinjection interval for onabotulinumtoxinA* | £21,968 | 11.954 | £9,277 | 11.693 | £12,691 | 0.261 | £48,625 |
|
| |||||||
| Scenario |
IncobotulinumtoxinA
|
BSC
|
Incremental (IncobotulinumtoxinA vs BSC)
|
||||
| Total costs (discounted) | QALYs | Total costs (discounted) | QALYs | Total costs (discounted) | QALYs | ICERs | |
|
| |||||||
| Base case | £22,473 | 11.959 | £9,357 | 11.735 | £13,116 | 0.224 | £58,554 |
| Considering 10 weeks reinjection interval for incobotulinumtoxinA* | £21,364 | 11.962 | £9,277 | 11.693 | £12,087 | 0.269 | £44,933 |
Note:
Same reinjection interval (10 weeks) was assumed for BSC.
Abbreviations: BSC, best supportive care; ICERs, incremental cost-effectiveness ratios; QALYs, quality-adjusted life-years.
References
- 1.Truong D, Brodsky M, Lew M, et al. Global dysport cervical dystonia study group Long-term efficacy and safety of botulinum toxin type A (Dysport) in cervical dystonia. Parkinsonism Relat Disord. 2010;16(5):316–323. doi: 10.1016/j.parkreldis.2010.03.002. [DOI] [PubMed] [Google Scholar]
- 2.Electronic medicines compendium (eMC) Dysport® 300 units, Dys-port® 500 units, summary of product characteristics. [Accessed January 2016]. Available from: https://www.medicines.org.uk/emc/medicine/870.
- 3.Kessler KR, Skutta M, Benecke R. Long-term treatment of cervical dystonia with botulinum toxin A: efficacy, safety, and antibody frequency. German Dystonia study group. J Neurol. 1999;246(4):265–274. doi: 10.1007/s004150050345. [DOI] [PubMed] [Google Scholar]
- 4.Electronic Medicines Compendium (eMC) Bortox® 100 units, Bortox® 50 units, Summary of Product Characteristics. [Accessed January 2016]. Available from: https://www.medicines.org.uk/emc/medicine/112; https://www.medicines.org.uk/emc/medicine/22562; https://www.medicines.org.uk/emc/medicine/20564.
- 5.Electronic medicines compendium (eMC) Xeomin® 100 units, Xeo-min® 50 units, summary of product characteristics. [Accessed January 2016]. Available from: https://www.medicines.org.uk/emc/medicine/20666; https://www.medicines.org.uk/emc/medicine/24582.
- 6.BNF: joint formulary committee British national formulary (online) 2012. [Accessed December, 2012]. Available from: http://www.medicinescomplete.com.
- 7.PSS . Unit costs of health and social care 2011 and National Schedule of Reference Costs Year 2010–2011. Personal social services research unit (PSS); 2015. [Accessed January 2016]. Available from: http://www.pssru.ac.uk. [Google Scholar]
- 8.Office for national statistics (ONS) Annual Survey of Hours and Earnings, 2013 Provisional Results. 2013. Available from: http://www.ons.gov.uk/ons/dcp171778_335027.pdf.
- 9.Stacy M, Bloudek L, Schwartz M, Brin M, Papapetropoulos S. Cervical dystonia substantially impacts employment status, absenteeism, and presenteeism: Baseline results from cervical dystonia patient registry for the observation of onabotulinumtoxinA efficacy (CD PROBE) Mov Disord. 2012;(27):1106. [Google Scholar]
Acknowledgments
This study was funded by Ipsen Pharma. An abstract of this paper was presented at the ISPOR 18th Annual European Congress, Milan, Italy, November 2015 as a poster presentation: http://www.valueinhealthjournal.com/article/S1098-3015(15)04544-1/abstract
The poster’s abstract was published in Value in Health, Volume 18, Issue 7:
Desai, K et al. AbobotulinumtoxinA In The Management of Cervical Dystonia In The United Kingdom: A Cost-Effectiveness Analysis. Value in Health, Volume 18, Issue 7, A757–A758.
Footnotes
Author contributions
All authors contributed toward data analysis, drafting and revising the paper and agree to be accountable for all aspects of the work.
Disclosure
MM, SA, and KD are employees of Evidera Inc., which received consultancy fees to conduct the research from Ipsen Pharma. JD and SG are both full-time employees of Ipsen Pharma. TH has received consultancy fees from Ipsen Pharma for work relating to Spasticity management TH has also received honoraria for lectures delivered from Merz and Allergan. Ipsen Pharma did not have any influence on the interpretation of data as well as the final conclusions drawn. The authors report no other conflicts of interest in this work.
References
- 1.Lalli S, Albanese A. The diagnostic challenge of primarydystonia: evidence from misdiagnosis. Mov Disord. 2010;25(11):1619–1626. doi: 10.1002/mds.23137. [DOI] [PubMed] [Google Scholar]
- 2.Albanese A, Asmus F, Bhatia KP, et al. EFNS guidelines on diagnosis and treatment of primary dystonias. Eur J Neurol. 2011;18(1):5–18. doi: 10.1111/j.1468-1331.2010.03042.x. [DOI] [PubMed] [Google Scholar]
- 3.Bloudek LM, Stacy M, Schwartz M, Brin M, Papapetropoulos S. Cost of cervical dystonia in the United States [abstract] Mov Disord. 2012;15(4):A142–A413. [Google Scholar]
- 4.Coelho M, Valadas AF, Mestre T, Ferreira JJ. Pain and quality of life in the treatment of cervical dystonia. Eur Neurol Rev. 2009;4(2):74–78. [Google Scholar]
- 5.Marras C, Van den Eeden SK, Fross RD, et al. Minimum incidence of primary cervical dystonia in a multiethnic health care population. Neurology. 2007;69(7):676–680. doi: 10.1212/01.wnl.0000267425.51598.c9. [DOI] [PubMed] [Google Scholar]
- 6.Warner T, Camfield L, Marsden C, et al. A prevalence study of primary dystonia in eight European countries. J Neurol. 2000;247(10):787–792. doi: 10.1007/s004150070094. [DOI] [PubMed] [Google Scholar]
- 7.Nutt JG, Muenter MD, Aronson A, Kurland LT, Melton LJ., 3rd Epidemiology of focal and generalised dystonia in Rochester, Minnesota. Mov Disord. 1988;3(3):188–194. doi: 10.1002/mds.870030302. [DOI] [PubMed] [Google Scholar]
- 8.Abogunrin S, Brand S, Desai K, Dinet J, Gabriel S, Harrower T. AbobotulinumtoxinA in the management of cervical dystonia in the United Kingdom: a budget impact analysis. Clinicoecon Outcomes Res. 2015;7:441–449. doi: 10.2147/CEOR.S86355. [DOI] [PMC free article] [PubMed] [Google Scholar]
- 9.Dystonia - NHS Choices. [Accessed July 22, 2016]. Available from: http://www.nhs.uk/conditions/dystonia/pages/introduction.aspx.
- 10.Zoons E, Dijkgraaf MG, Dijk JM, van Schaik IN, Tijssen MA. Botulinum toxin as treatment for focal dystonia: a systematic review of the pharmaco-therapeutic and pharmaco-economic value. J Neurol. 2012;259(12):2519–2526. doi: 10.1007/s00415-012-6510-x. [DOI] [PMC free article] [PubMed] [Google Scholar]
- 11.Walker FO. Botulinum toxin therapy for cervical dystonia. Phys Med Rehabil Clin. 2003;14(4):749–766. doi: 10.1016/s1047-9651(03)00045-7. [DOI] [PubMed] [Google Scholar]
- 12.Simpson David M, Hallett Mark, Ashman Eric J, et al. Practice guideline update summary: botulinum neurotoxin for the treatment of blepharospasm, cervical dystonia, adult spasticity, and headache. Neurology. 2016;86(19):1818–1826. doi: 10.1212/WNL.0000000000002560. [DOI] [PMC free article] [PubMed] [Google Scholar]
- 13.Hilker R, Schischniaschvili M, Ghaemi M, Jacobs A, Rudolf J. Health related quality of life is improved by botulinum neurotoxin type A in long term treated patients with focal dystonia. J Neurol Neurosurg Psychiatry. 2001;71(2):193–199. doi: 10.1136/jnnp.71.2.193. [DOI] [PMC free article] [PubMed] [Google Scholar]
- 14.Skogseid IM, Røislien J, Claussen B, Kerty E. Long-term botulinum toxin treatment increases employment rate in patients with cervical dystonia. Mov Disord. 2005;20(12):1604–1609. doi: 10.1002/mds.20670. [DOI] [PubMed] [Google Scholar]
- 15.Molho ES, Agarwal N, Regan K, Higgins DS, Factor SA. Effect of cervical dystonia on employment: a retrospective analysis of the ability of treatment to restore premorbid employment status. Mov Disord. 2009;24(9):1384–1387. doi: 10.1002/mds.22622. [DOI] [PubMed] [Google Scholar]
- 16.Comella CL, Jankovic J, Shannon KM, Tsui J, Swenson M, Leurgans S, Fan W, Dystonia Study Group Comparison of botulinum toxin serotyopes A and B for the treatment of cervical dystonia. Neurology. 2005;65(9):1423–1429. doi: 10.1212/01.wnl.0000183055.81056.5c. [DOI] [PubMed] [Google Scholar]
- 17.Consky E, Basinski A, Belle L, Ranawaya R, Lang AE. The Toronto Western Spasmodic Torticollis Rating Scale (TWSTRS): assessment of validity and inter-rater reliability [abstract] Neurology. 1990;40(Suppl 1):445. [Google Scholar]
- 18.Han Y, Stevens A, Dashtipour K, Hauser R, Mari Z. A mixed treatment comparison (MTC) to compare the efficacy of botulinum toxin type A treatments for cervical dystonia. Value Health. 2014;17(3):A57. doi: 10.1007/s00415-016-8050-2. [DOI] [PMC free article] [PubMed] [Google Scholar]
- 19.Han Y, Stevens A, Dashtipour K, Hauser RA, Mari Z. A mixed treatment comparison to compare the efficacy and safety of botulinum toxin treatments for cervical dystonia. J Neurol. 2016;263(4):772–780. doi: 10.1007/s00415-016-8050-2. [DOI] [PMC free article] [PubMed] [Google Scholar]
- 20.Brockmann K, Schweitzer K, Beck G, Wächter T. Comparison of different preparations of botulinumtoxin A in the treatment of cervical dystonia. Neurol Asia. 2012;17(2):115–119. [Google Scholar]
- 21.Kazerooni R, Broadhead C. Cost-utility analysis of botulinum toxin type A products for the treatment of cervical dystonia. Am J Health Syst Pharm. 2015;72(4):301–307. doi: 10.2146/ajhp140276. [DOI] [PubMed] [Google Scholar]
- 22.Sonnenberg FA, Beck JR. Markov models in medical decision making: a practical guide. Med Decis Making. 1993;13(4):322–338. doi: 10.1177/0272989X9301300409. [DOI] [PubMed] [Google Scholar]
- 23.Briggs A, Sculpher M. An introduction to Markov modelling for economic evaluation. Pharmacoeconomics. 1998;13(4):397–409. doi: 10.2165/00019053-199813040-00003. [DOI] [PubMed] [Google Scholar]
- 24.National Institute for Health and Care Excellence (NICE) Guide to the methods of technology appraisal. 2013. London: NICE; [Accessed January 2016]. NICE article [PMG9] Avaliable from: http://publication.nice.org.uk/pmg9. [PubMed] [Google Scholar]
- 25.Truong D, Brodsky M, Lew M, et al. Global dysport cervical dystonia study group Long-term efficacy and safety of botulinum toxin type A (Dysport) in cervical dystonia. Parkinsonism Relat Disord. 2010;16(5):316–323. doi: 10.1016/j.parkreldis.2010.03.002. [DOI] [PubMed] [Google Scholar]
- 26.Office for national statistics (ONS) Annual Survey of Hours and Earnings, 2013 Provisional Results. 2013. [Accessed January 2016]. Available from: http://www.ons.gov.uk/ons/dcp171778_335027.pdf.
- 27.Electronic Medicines Compendium (eMC) Bortox® 100 units, Bortox® 50 units, Summary of Product Characteristics. [Accessed January 2016]. Available from: https://www.medicines.org.uk/emc/medicine/112; https://www.medicines.org.uk/emc/medicine/22562; https://www.medicines.org.uk/emc/medicine/20564.
- 28.Electronic medicines compendium (eMC) Dysport® 300 units, Dysport® 500 units, summary of product characteristics. [Accessed January 2016]. Available from: https://www.medicines.org.uk/emc/medicine/870.
- 29.Electronic medicines compendium (eMC) Xeomin® 100 units, Xeo-min® 50 units, summary of product characteristics. [Accessed January 2016]. Available from: https://www.medicines.org.uk/emc/medicine/20666; https://www.medicines.org.uk/emc/medicine/24582.
- 30.Stacy M, Bloudek L, Schwartz M, Brin M, Papapetropoulos S. Cervical dystonia substantially impacts employment status, absenteeism, and presenteeism: Baseline results from cervical dystonia patient registry for the observation of onabotulinumtoxinA efficacy (CD PROBE) Mov Disord. 2012;(27):1106. [Google Scholar]
- 31.Tilden D, Guarnieri C. Cost-Effectiveness of incobotulinumtoxin-A with flexible treatment intervals compared to onabotulinumtoxin-A in the management of blepharospasm and cervical dystonia. Value Health. 2016;19(2):145–152. doi: 10.1016/j.jval.2015.11.009. [DOI] [PubMed] [Google Scholar]
- 32.Martikainen KK, Luukkaala TH, Marttila RJ. Working capacity and cervical dystonia. Parkinsonism Relat Disord. 2010;16(3):215–217. doi: 10.1016/j.parkreldis.2009.07.006. [DOI] [PubMed] [Google Scholar]
- 33.Burbaud P, Ducerf C, Cugy E, et al. Botulinum toxin treatment in neurological practice: how much does it really cost? A prospective cost-effectiveness study. J Neurol. 2011;258(9):1670–1675. doi: 10.1007/s00415-011-5998-9. [DOI] [PubMed] [Google Scholar]
- 34.BNF: joint formulary committee British national formulary (online) 2012. [Accessed December, 2012]. Available from: http://www.medicinescomplete.com.
- 35.PSS . Unit costs of health and social care 2011 and National Schedule of Reference Costs Year 2010–2011. Personal social services research unit (PSS); 2015. [Accessed January 2016]. Available from: http://www.pssru.ac.uk. [Google Scholar]
- 36.Kessler KR, Skutta M, Benecke R. Long-term treatment of cervical dys-tonia with botulinum toxin A: efficacy, safety, and antibody frequency. German Dystonia study group. J Neurol. 1999;246(4):265–274. doi: 10.1007/s004150050345. [DOI] [PubMed] [Google Scholar]
Associated Data
This section collects any data citations, data availability statements, or supplementary materials included in this article.
Supplementary Materials
Illustration of QALY gain in first (A) and subsequent cycle (B) when TWSTRS is assumed to have residual benefit at week 12.
Abbreviations: QALYs, quality-adjusted life-years; TWSTRS, Toronto Western Spasmodic Torticollis Rating Scale.
Tornado diagram of one-way sensitivity analysis on incremental cost.
Abbreviations: BSC, best supportive care; BoNT-A, botulinum neurotoxin type A.
Tornado diagram of one-way sensitivity analysis on incremental benefit.
Abbreviations: BSC, best supportive care; QALY, quality-adjusted life-year; TWS, Toronto Western Spasmodic.
Tornado diagram of one-way sensitivity analysis on ICER.
Abbreviations: BSC, best supportive care; ICER, incremental cost-effectiveness ratio; TWS, Toronto Western Spasmodic.
Tornado diagram of one-way sensitivity analysis on incremental net benefit with a willingness-to-pay threshold of £20,000/QALY.
Abbreviations: BSC, best supportive care; INB, incremental net benefit; QALY, quality-adjusted life-year; TWS, Toronto Western Spasmodic.
Table S1.
Model inputs
| Parameters | Base case
|
Source/assumptions | |||
|---|---|---|---|---|---|
| AbobotulinumtoxinA | OnabotulinumtoxinA | IncobotulinumtoxinA | BSC | ||
| Clinical inputs | |||||
| Change from baseline of TWSTRS at weeks 4, 8, 12 (mean (SE)) | |||||
| TWSTRS change from baseline at 4 weeks | −5.0 (2.0) | AbobotulinumtoxinA trial1 | |||
| No response | −0.6 (0.0) | −0.6 (0.0) | −0.6 (0.0) | – | AbobotulinumtoxinA trial 1 |
| Response | −20.3 (2.0) | −20.3 (2.0) | −20.3 (2.0) | – | OnabotulinumtoxinA and incobotulinumtoxinA are assumed to have same response as abobotulinumtoxinA |
| TWSTRS change from baseline at 8 weeks | −4.2(2.0) | AbobotulinumtoxinA trial1 | |||
| No response | −0.1 (0.0) | −0.1 (0.0) | −0.1 (0.0) | – | AbobotulinumtoxinA trial1 |
| Response | −18.3 (2.0) | −18.3 (2.0) | −18.3 (2.0) | – | OnabotulinumtoxinA and incobotulinumtoxinA are assumed to have same response as abobotulinumtoxinA |
| TWSTRS change from baseline at 12 weeks | −3.3 (2.0) | AbobotulinumtoxinA trial1 | |||
| No response | −0.2 (0.1) | −0.2 (0.1) | −0.2 (0.1) | – | AbobotulinumtoxinA trial1 |
| Response | −9.4 (2.0) | −9.4 (2.0) | −9.4 (2.0) | – | OnabotulinumtoxinA and incobotulinumtoxinA are assumed to have same response as abobotulinumtoxinA |
| Response rate of first injection for BoNT-A therapies (%) | |||||
| Response rate of first injection | |||||
| No response | 37.0 | 37.0 | 37.0 | AbobotulinumtoxinA trial1 | |
| Response | 63.0 | 63.0 | 63.0 | OnabotulinumtoxinA and incobotulinumtoxinA are assumed to have same response as abobotulinumtoxinA | |
| Response rate of subsequent injection for BoNT-A therapies (%) | |||||
| Annual rate of response after initial nonresponse (rate per year) | 0.0 | 0.0 | 0.0 | Patients who do not respond at the initial injection do not achieve response in subsequent injection cycles | |
| Annual rate of secondary nonresponse after initial response (rate per year) | 0.0 | 0.0 | 0.0 | Similarly, patients who achieve response at the initial injection do not develop secondary nonresponse | |
| Reinjection interval for BoNT-A therapies (weeks) | |||||
| Duration of treatment cycle (weeks) | 12.0# | 12.0## | 12.0### | Assumed to be in line with abobotulinumtoxinA SmPC2 and experts clinical opinion | |
| Annual rate of all-cause treatment discontinuation (%) | |||||
| Discontinuation rate per year | |||||
| No response | 1.1 | 1.1 | 1.1 | – | Kessler et al (1999)3 |
| Response | 1.1 | 1.1 | 1.1 | – | |
| Adverse events by BoNT-A therapies (%) | |||||
| Dysphagia rate per injection | 15 | 19 | 13 | – | Inferred from SmPCs of BoNT-A products2,4,5 |
| Utility inputs | |||||
| Baseline utility and utility gains (mean) | |||||
| BoNT-A | BSC 0.6368 | Calculated from estimated utility-TWSTRS relationship and TWSTRS data at weeks 0, 4, 8, and 12 | |||
| Baseline utility | |||||
| No response | 0.6398 | ||||
| Response | 0.6349 | ||||
| QALYs gain per person for | 0.0026 | ||||
| first cycle | |||||
| No response | 0 | 0 | 0 | ||
| Response | 0.0117 | 0.0117 | 0.0117 | ||
| QALY gain per person for subsequent cycles | 0.0035 | ||||
| No response | 0 | 0 | 0 | ||
| Response | 0.0130 | 0.0130 | 0.0130 | ||
| Resource use and cost inputs | |||||
| Drug costs | |||||
| Cost per vial | £154.00 per 500 unit vial, £92.40 per 500 unit vial | £276.40 per 200 unit vial, £138.20 per 100 unit vial | £129.90 per 100 unit vial, £72.00 per 50 unit vial | – | BNF6 |
| Average dose per cycle: first injection | |||||
| Mean dose (units) | 500 | 200 | 200 | – | SmPC of BoNT-A products2,4,5 |
| Average dose per cycle: subsequent injections | |||||
| Mean dose (units) – no response | 750 | 300 | 300 | Expert clinical input | |
| Mean dose (units) – response | 400 | 133 | 160 | ||
| Drug administration costs and frequency of use of BoNT-A therapies | |||||
| Cost per injection (per visit) for BoNT-A therapies | Frequency of use (for 1 visit per injection) for BoNT-A | Frequency of use (for 1 visit per injection)for BSC | Administration costs were derived from PSS7 Frequency of visits was collected from Ipsen US ANCHOR-CD study (Ipsen Pharma, unpublished data, 2012) and verified with clinical experts in the UK |
||
| Neurologist visit | £146.00 | 73.5% | NA | ||
| Neurophysiologist visit | £146.00 | 26.5% | NA | ||
| Nurse visit | £42.00 | 0.0% | NA | ||
| Concomitant medication costs and frequency of use | |||||
| Unit costs (per mg) | Dose per day (mg) | Unit drug costs and dosing schedule for concomitant medications were obtained from BNF6 | |||
| Anticholinergics | £0.0070 | 1 | |||
| Benzodiazepines | £0.0720 | 1 | |||
| Analgesics | £0.0003 | 1,000 | |||
| Dopamine antagonist | £0.0990 | 2.5 | |||
| Beta blockers | £0.0011 | 40 | |||
| Baclofen | £0.0020 | 60 | |||
| Antiepileptics | £0.0006 | 600 | |||
| Other muscle relaxants | £0.0094 | 7.5 | |||
| Frequency of use (for BoNT-As and BSC) | BoNT-A (%) | BSC (%) | Distribution of frequency of use among different drugs were collected from Ipsen US ANCHOR-CD study (Ipsen Pharma, unpublished data, 2012) and verified with clinical experts in UK | ||
| % of patients taking concomitant medications | 35 | 50 | |||
| Anticholinergics | 0.6 | 0.6 | |||
| Benzodiazepines | 23.5 | 26.5 | |||
| Analgesics | 33.5 | 33.5 | |||
| Dopamine antagonist | 0.6 | 0.6 | |||
| Beta blockers | 0.6 | 0.6 | |||
| Baclofen | 3.2 | 3.2 | |||
| Antiepileptics | 5.8 | 5.8 | |||
| Other muscle relaxants | 29.2 | 29.2 | |||
| Disease management costs and frequency of disease management interventions | |||||
| Unit costs | Frequency per year (for BoNT-A) | Frequency per year (for BSC) | The disease management costs were derived from “Unit Costs of Health and Social Care 2011” published by (PSS) in the UK and “National Schedule of Reference Costs Year 2010–2011” published by Department of Health in the UK7 The frequency of disease management interventions was based on consultation with clinical experts in UK |
||
| Neurologist visit (excluding BoNT-A injection per visit) | £146.00 | 0 | 2 | ||
| GP visit (per visit) | £53.00 | 2 | 2 | ||
| Hospitalization (per day) | £428.00 | 1.5% | 1.5% | ||
| Average length of stay | – | 5 | 5 | ||
| Deep brain stimulation (per surgery) | £4,384.89 | NA | 1% | ||
| Selective peripheral denervation (per surgery) | £1,867.00 | NA | 1% | ||
| Indirect costs* | |||||
| Median hourly wage in the UK (per hour) | £12.76 | Median hourly wage reported by Office for National Statistics Survey for 20138 |
|||
| LPT due to patients with CD and carers combined (number of hours per week) | |||||
| Productivity loss | 2 | 5 | The model uses LPT due to absenteeism and presenteeismfrom Stacy et al (2012)9 Indirect costs due to time to doctor office visit and caregiver time are not considered, since no data was available |
||
| Time to doctor office visit | – | – | |||
| Caregiver time | – | – | |||
| Total | 2 | 5 | |||
Notes:
Indirect costs are not included in the base case analysis.
For AbobotulinumtoxinA, it is 16 weeks as per AbobotulinumtoxinA SmPC – this is tested as part of scenario analyses,
For OnabotulinumtoxinA, it is 10 weeks as per OnabotulinumtoxinA SmPC – this is also tested as part of scenario analyses,
For IncobotulinumtoxinA, it is 10 weeks as per IncobotulinumtoxinA SmPC – this is also tested as part of scenario analyses.
Abbreviations: ANCHOR-CD, AbobotulinumtoxinA Neurotoxin: Clinical and Health Economics Outcomes Registry in Cervical Dystonia; BNF, British National Formulary; BoNT-A, botulinum neurotoxin type A; BSC, best supportive care; GP, general practitioner; LPT, lost productive time; PSS, Personal Social Services; QALYs, quality-adjusted life-years; SE, standard error; SmPC, summary of product characteristics; TWSTRS, Toronto Western Spasmodic Torticollis Rating Scale; NA, not available.
Table S2.
Estimates of statistical model linking utility and TWSTRS based on analysis of abobotulinumtoxinA trial
| Parameter | Parameter estimate | Parameter |
|---|---|---|
| Intercept | 1.255 | |
| Coefficient for TWSTRS | −0.0159 | |
| Covariance matrix Intercept | Coefficient for TWSTRS | |
| Intercept | 0.01157 | |
| Coefficient for TWSTRS | −0.000234 | 5.437E-06 |
Abbreviations: TWSTRS, Toronto Western Spasmodic Torticollis Rating Scale.
Table S3.
Parameters included in one-way sensitivity analysis
| Parameter/variable name | Description | Base-case input | Low value | High value |
|---|---|---|---|---|
| discH | Discount rate for health (%) | 0.035 | 0.028 | 0.042 |
| discC | Discount rate for cost (%) | 0.035 | 0.028 | 0.042 |
| iAge | Age (years) | 53.00 | 42.400 | 63.600 |
| pMale | Gender (% male) | 0.37 | 0.296 | 0.444 |
| TWSBline_NonResp | Mean baseline TWSTRS – nonresponders: abobotulinumtoxinA | 42.79 | 34.232 | 51.348 |
| TWSBline_Resp | Mean baseline TWSTRS – responders: abobotulinumtoxinA | 44.12 | 35.296 | 52.944 |
| TWSBline_BSC | Mean baseline TWSTRS – BSC | 43.63 | 34.902 | 52.353 |
| Coeff_TWS | Coefficient for TWSTRS | −0.02 | −0.019 | −0.013 |
| Coeff_Inter | Intercept | 1.26 | 1.004 | 1.506 |
| iReinj_PriNonResp | Number of reinjection attempts for primary nonresponders before abandoning treatment | 6.00 | 4.800 | 7.200 |
| iReinj_SecNonResp | Number of reinjection attempts for secondary nonresponders before abandoning treatment | 4.00 | 3.200 | 4.800 |
| TWSChangeAt4Wks_Abo_nonresponder | AbobotulinumtoxinA_TWSTRS change from baseline at 4 weeks – nonresponders | −0.61 | −0.643 | −0.583 |
| TWSChangeAt4Wks_Abo_fullresponder | AbobotulinumtoxinA _TWSTRS change from baseline at 4 weeks – responders | −20.29 | −22.290 | −18.290 |
| TWSChangeAt8Wks_Abo_nonresponder | AbobotulinumtoxinA _TWSTRS change from baseline at 8 weeks – nonresponders | −0.14 | −0.140 | −0.136 |
| TWSChangeAt8Wks_Abo_responder | AbobotulinumtoxinA _TWSTRS change from baseline at 8 weeks – responders | −18.30 | −20.300 | −16.300 |
| TWSChangeAt12Wks_Abo_nonresponder | AbobotulinumtoxinA _TWSTRS change from baseline at 12 weeks – nonresponders | −0.21 | −0.283 | −0.143 |
| TWSChangeAt12Wks_Abo_fullresponder | AbobotulinumtoxinA _TWSTRS change from baseline at 12 weeks – responders | −9.35 | −11.350 | −7.350 |
| TWSChangeAt4Wks_BSC | BSC_TWSTRS change from baseline at 4 weeks | −4.97 | −6.970 | −2.970 |
| TWSChangeAt8Wks_BSC | BSC_TWSTRS change from baseline at 8 weeks | −4.22 | −6.220 | −2.220 |
| TWSChangeAt12Wks_BSC | BSC_TWSTRS change from baseline at 12 weeks | −3.32 | −5.320 | −1.320 |
| distriFirstInj_Abo_nonresponder | Probability of nonresponse at first injection | 0.37 | 0.296 | 0.444 |
| distriFirstInj_Abo_responder | Probability of response at first injection | 0.63 | 0.504 | 0.756 |
| pAE_Abo | AE rate per injection: abobotulinumtoxinA (%) | 15% | 12% | 18% |
| dFirstInj_Abo | AbobotulinumtoxinA _first injection dosage: mean dose (unit) | 500.00 | 400.000 | 600.000 |
| dFirstInj_Ona | OnabotulinumtoxinA _first injection dosage: mean dose (unit) | 200.00 | 160.000 | 240.000 |
| dFirstInj_Inco | IncobotulinumtoxinA _first injection dosage: Mean dose (unit) | 200.00 | 160.000 | 240.000 |
| dReinj_Abo_nonresponder | Average abobotulinumtoxinA reinjection dosage: nonresponder (unit) | 750.00 | 600.000 | 900.000 |
| dReinj_Abo_responder | Average abobotulinumtoxinA reinjection dosage: responder (unit) | 400.00 | 320.000 | 480.000 |
| cDrugFirstInj_Abo | AbobotulinumtoxinA _first injection cost (£) | 154.00 | 123.200 | 184.800 |
| cDrugReinj_Abo_nonresponder | AbobotulinumtoxinA _reinjections cost – nonresponder (£) | 246.40 | 197.120 | 295.680 |
| cDrugReinj_Abo_fullresponder | AbobotulinumtoxinA _reinjections cost – responder (£) | 154.00 | 123.200 | 184.800 |
| cConMed_BoNTA | Concomitant Meds Cost_BoNTA (£) | 0.05 | 0.042 | 0.062 |
| cConMed_BSC | Concomitant Meds Cost _BSC (£) | 0.07 | 0.059 | 0.089 |
| cDrugAdmin | Cost Drug Admin (£) | 146.00 | 116.800 | 175.200 |
| cDisMgt_Abo | Cost Disease Management_AbobotulinumtoxinA (£) | 31.77 | 25.419 | 38.129 |
| cDisMgt_BSC | Cost Disease Management _BSC (£) | 113.31 | 90.645 | 135.967 |
| cAE | Cost AEs_BoNTA (£) | – | – | – |
| cIndirect_BoNTA | Cost Indirect_Abo (£) | 306.24 | 244.992 | 367.488 |
| cIndirect_BSC | Cost Indirect_BSC (£) | 765.60 | 612.480 | 918.720 |
| timeYearsInCycle_Abo | Reinjection Interval (years) | 0.23 | 0.184 | 0.276 |
Abbreviations: AE, adverse event; BoNTA, botulinum neurotoxin type A; BSC, best supportive care; TWSTRS, Toronto Western Spasmodic Torticollis Rating Scale.
Table S4.
Parameters included in probabilistic sensitivity analysis
| Parameter | Distribution |
|---|---|
| Utility at each TWSTRS score (based on mapping) | Multivariate normal (Cholesky) |
| Mean baseline TWSTRS distribution, nonresponders and responders at 0, 4, 8, 12 weeks | Gamma |
| Transition probability: response to secondary nonresponse | Beta |
| Duration of treatment cycle: abobotulinumtoxinA | Gamma |
| Treatment discontinuation rate per year | Gamma |
| AbobotulinumtoxinA_first injection dosage | Gamma |
| AbobotulinumtoxinA_reinjection dosage: nonresponder | Gamma |
| AbobotulinumtoxinA_reinjection dosage: responder | Gamma |
| Setting where drug is administered (distribution) | |
| Neurologist visit | Beta |
| Physiotherapist visit | Beta |
| Nurse visit | Beta |
| Disease management | |
| Neurologist visit (excluding BoNT-A injection) per year | Gamma |
| GP visit per year | Gamma |
| Hospitalization rate per year: BoNT-A | Beta |
| Hospitalization rate per year: BSC | Beta |
| Length of stay for hospitalization: BoNT-A | Gamma |
| Length of stay for hospitalization: BSC | Gamma |
Abbreviations: BSC, best supportive care; BoNT-A, botulinum neurotoxin type A; GP, general practitioner; TWSTRS, Toronto Western Spasmodic Torticollis Rating Scale.
Table S5.
Alternative scenario results: other comparisons
| Scenario | OnabotulinumtoxinA
|
BSC
|
Incremental (onabotulinumtoxinA vs BSC)
|
||||
|---|---|---|---|---|---|---|---|
| Total costs (discounted) | QALYs | Total costs (discounted) | QALYs | Total costs (discounted) | QALYs | ICERs | |
| Base case | £20,573 | 11.964 | £9,357 | 11.735 | £11,216 | 0.229 | £48,978 |
| Considering 10 weeks reinjection interval for onabotulinumtoxinA* | £21,968 | 11.954 | £9,277 | 11.693 | £12,691 | 0.261 | £48,625 |
|
| |||||||
| Scenario |
IncobotulinumtoxinA
|
BSC
|
Incremental (IncobotulinumtoxinA vs BSC)
|
||||
| Total costs (discounted) | QALYs | Total costs (discounted) | QALYs | Total costs (discounted) | QALYs | ICERs | |
|
| |||||||
| Base case | £22,473 | 11.959 | £9,357 | 11.735 | £13,116 | 0.224 | £58,554 |
| Considering 10 weeks reinjection interval for incobotulinumtoxinA* | £21,364 | 11.962 | £9,277 | 11.693 | £12,087 | 0.269 | £44,933 |
Note:
Same reinjection interval (10 weeks) was assumed for BSC.
Abbreviations: BSC, best supportive care; ICERs, incremental cost-effectiveness ratios; QALYs, quality-adjusted life-years.