

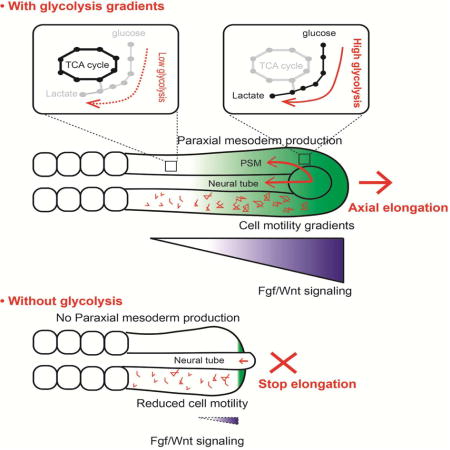
SUMMARY
Mammalian embryos transiently exhibit aerobic glycolysis (Warburg effect), a metabolic adaptation also observed in cancer cells. The role of this particular type of metabolism during vertebrate organogenesis is currently unknown. Here, we provide evidence for spatiotemporal regulation of glycolysis in the posterior region of mouse and chicken embryos. We show that a posterior glycolytic gradient is established in response to graded transcription of glycolytic enzymes downstream of FGF signaling. We demonstrate that glycolysis controls posterior elongation of the embryonic axis by regulating cell motility in the presomitic mesoderm and by controlling specification of the paraxial mesoderm fate in the tail bud. Our results suggest that glycolysis in the tail bud coordinates Wnt and FGF signaling to promote elongation of the embryonic axis.
Keywords: Somitogenesis, axial elongation, glycolysis, metabolism, FGF, lactate, paraxial mesoderm, embryo
In-Brief/Etoc paragraph
Mammalian embryos transiently exhibit aerobic glycolysis (Warburg effect). Oginuma and colleagues identify a glycolysis gradient in mouse and chick downstream of FGF in the amniote tail bud that controls posterior embryonic axis elongation. Glycolysis regulates presomitic mesoderm cell motility and Wnt signaling for specification of tail bud paraxial mesoderm fate.
Introduction
Early studies in chicken and mouse embryos have established that energy metabolism is tightly regulated during development (Johnson et al., 2003; Spratt Jr., 1948). The early mouse preimplantation embryo does not rely on glucose as its main source of energy but rather uses pyruvate and lactate to feed the Tricarboxylic Acid (TCA) cycle and produce ATP (Brinster, 1965). Around the time of implantation, a major metabolic transition occurs, leading the embryo to increase glucose uptake and glycolytic activity (Clough and Whittingham, 1983; Shepard et al., 1997). Most of this glycolytic activity coexists with an active TCA cycle and oxydative phosphorylation and results in lactate production (Johnson et al., 2003) thus resembling the Warburg metabolism or aerobic glycolysis of cancer cells (Vander Heiden et al., 2009). Subsequently, this intense glycolytic activity of the embryo decreases during organogenesis while respiration becomes the major mode of energy production (Wales et al., 1995). Aerobic glycolysis has been proposed to play a role in sustaining the intense proliferative activity of cancer and embryonic cells (Papaconstantinou, 1967; Vander Heiden et al., 2009). In the mammalian embryo, however, down-regulation of the glycolytic activity occurs during early organogenesis, when very high levels of proliferation are observed, thus questioning the role of this metabolic adaptation. To date, most studies of the metabolic status of vertebrate embryonic cells in vivo are based on metabolic tracing which can only provide crude spatial resolution. Recent studies have however shown that aerobic glycolysis can be regulated in a cell type and stage-specific manner as for instance in the developing retina, in osteoblasts or in endothelial cells (Agathocleous et al., 2012; Esen et al., 2013; Moussaieff et al., 2015). This raises the possibility of an instructive role for this particular type of metabolism in development (Shyh-Chang et al., 2013).
Here we investigated the role and regulation of metabolism in patterning and morphogenesis using musculo-skeletal development as a paradigm. Skeletal muscles and vertebrae derive from the paraxial mesoderm, which is continuously produced by gastrulation first in the primitive streak and then in the tail bud. Newly generated paraxial mesoderm appears as bilateral strips of mesenchyme called presomitic mesoderm (PSM) which periodically segment to generate the embryonic somites (Hubaud and Pourquie, 2014). Somites provide the blueprint for the metameric arrangement of vertebrae and associated muscles. Periodic somite formation is driven by a molecular oscillator, termed Segmentation Clock, which drives rhythmic activation of the Wnt, FGF and Notch pathways in the PSM (Hubaud and Pourquie, 2014). The segmental response to the oscillator is gated to a specific level of PSM called determination front by a system of traveling posterior to anterior gradients of Wnt and FGF signaling. Cells of the PSM exhibit a gradient of random motility (cell diffusion) controlled by FGF, which has been proposed to control the posterior elongation movements involved in body axis formation (Benazeraf et al., 2010). In the paraxial mesoderm, the differentiation process is associated with a striking modular compartmentalization of the transcription of essential components of translation and oxidative metabolism which become upregulated as cells differentiate (Ozbudak et al., 2010). Furthermore, hypoxia can downregulate FGF signaling in the paraxial mesoderm leading to an arrest of the segmentation clock and ultimately to vertebral defects (Sparrow et al., 2012). These observations support a cross-talk between signaling and metabolism and argue for a dynamic regulation of metabolism during paraxial mesoderm development.
In this report, combining metabolomic and transcriptomic approaches, we identify a posterior to anterior gradient of glucose uptake and of glycolysis in the tail bud region of the mouse and chicken embryos. We show that the tail bud glycolytic gradient is established in response to graded transcription of rate-limiting glycolytic enzymes downstream of FGF signaling. Inhibiting glycolysis in the chicken embryo leads to an arrest of axis elongation associated to an increased extracellular pH and decreased cell motility in the posterior PSM. The elongation arrest is also accompanied by premature differentiation of the SOX2-BRACHYURY neuro-mesodermal precursors (NMPs) toward a neural fate, resulting from inhibition of Wnt signaling in the tail bud. Thus our work identifies a striking role for glycolysis in integrating cell signaling during body axis formation.
Results and discussion
Identification of a posterior gradient of glycolysis in the mouse tail bud
To explore the regulation of metabolism during paraxial mesoderm differentiation, we performed a comprehensive metabolomic analysis of the developing posterior body axis in mouse embryos. To that end, we dissected the posterior part of 300 day 9.5 mouse embryos into 3 adjacent domains corresponding to the progressively more differentiated levels of the posterior PSM (P-PSM) including the tailbud, anterior PSM (A-PSM) and newly formed somites (Figure 1A). The relative abundance of a set of 2400 metabolites was analyzed for each sample by tandem mass spectrometry (LC-MS/MS and GC-MS). This strategy identified a total of 129 metabolites which were reliably detected in the embryo samples (Figure S1A and Table S1). Thirty nine of these metabolites showed statistically significant variation during differentiation (Figure 1B, Table S1). Several metabolites involved in glycolysis, such as lactate or Glucose-6-phosphate (G6P) were detected at significantly higher levels (1.35 and 1.49 fold respectively, p<0.05) in P-PSM compared to A-PSM (Figure 1B–D, Figure S1B and Table S1). Other glycolytic metabolites including Glucose, Fructose-1,6-diphosphate (FBP), and 3-Phosphoglycerate (3-PG) also exhibited trends suggesting enrichment in the P-PSM (Figure 1 C–D, Figure S1B and Table S1). Other important nutrients such as Glutamine also showed a similar posterior gradient (Figure 1B and Figure S1B). Using an enzymatic assay, we found significantly higher lactate levels in the P-PSM and tail bud, compared to A-PSM and somites (Figure 1E), consistent with more active glycolysis in more posterior regions. We also found that Cytochrome C oxidase activity was increased in A-PSM and somite, but still detected in the posterior region experiencing high glycolytic activity (Figure 1F). Cytochrome C oxidase activity forms a gradient opposite to glycolysis, consistent with the increased regulation of translation and oxidative metabolism reported in the zebrafish anterior PSM (Ozbudak et al., 2010). This supports the notion that glycolysis plays a more important role than respiration in the posterior part of the embryo. We did not detect any significant difference in ATP concentration along the PSM (Figure 1G). We next analyzed the expression of key glycolytic enzymes in a previously generated PSM microarray series of consecutive micro-dissected fragments spanning the entire PSM in day 9.5 mouse embryos (Chal et al., 2015). Transcripts coding for (Phosphoglucomutase (Pgm1/2), Hexokinase (HK1), Aldolase (AldoA), Triose phosphate isomerase (Tpi1),2,3 Phosphoglycerate mutase (Bpgm), Enolase (Eno3), Lactate dehydrogenase (Ldhb) are enriched at the level of the tail bud/posterior-most PSM and show a posterior expression gradient (Figure 1H, Table S2). Glucose transporter 3 (Glut3 or Slc2a3), which controls entry of glucose in the cell, also shows graded expression in the PSM and the tail bud at the mRNA and at the protein level (Figure 1H–I, Table S2). Together, these observations identify a gradient of glycolytic activity associated to graded transcription of glycolytic enzymes in the posterior PSM and tail bud of mouse embryos.
Figure 1. A posterior glycolytic gradient in the mouse tail bud.
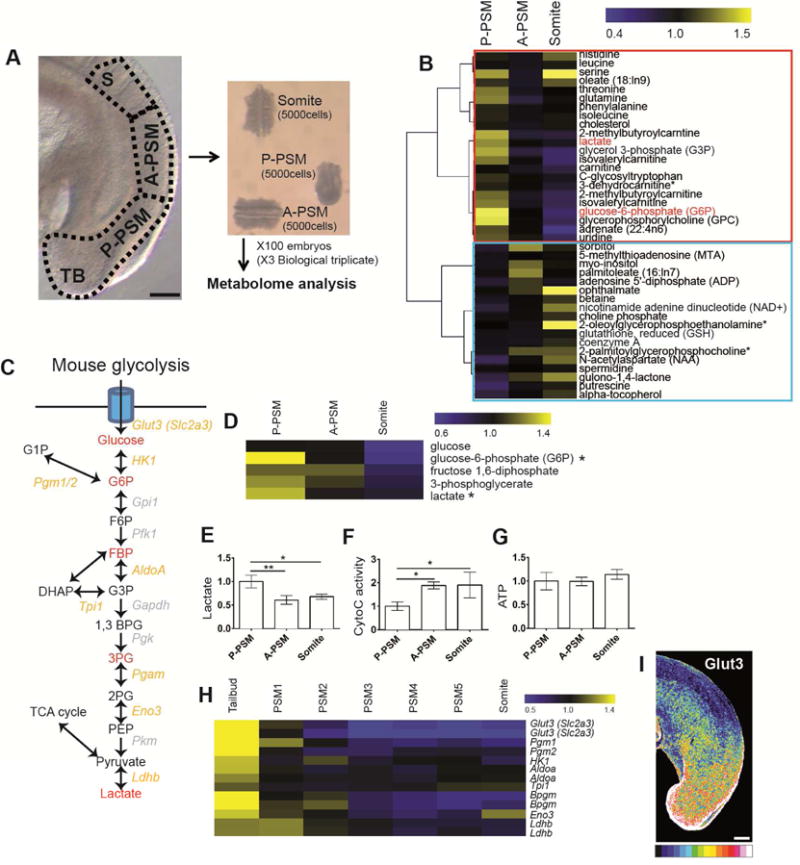
(A) Lateral view of the posterior region of E 9.5 day mouse embryo showing the 3 domains used for metabolomics analysis. TB: Tail bud, S: somite, A-PSM and P-PSM: Anterior and Posterior Presomitic Mesoderm respectively. Each domain contains approximately 5000 cells. Scale bar :100 μm.
(B) Clustering analysis of the 39 metabolites showing the most significant differential expression along the posterior region of the embryo. Color bar shows fold change from mean. Red box highlights metabolites downregulated and blue box metabolites upregulated during differentiation.
(C) Schematic representation of the mouse glycolytic cascade. Red labeling indicates metabolites detected in the metabolomics analysis. Yellow labeling indicates the glycolytic enzymes transcripts downregulated in the mouse embryo tail bud and PSMs.
(D) Expression profiles of the metabolites associated to glycolysis detected in the metabolomics analysis (* Significant at p<0.05 with t-test). The color bar shows fold change from mean of all triplicate samples.
(E–G) Enzymatic detection of relative lactate levels, Cytochrome C oxidase activity, and relative ATP concentrations during tail bud differentiation. Graphs show triplicate experiments. Values were normalized by P-PSM, Error bars are ±SD. Statistical significance was assessed with one way ANOVA followed by Tukey’s test, * p<0.05, ** p<0.01. (H) Expression profiles of transcripts coding for glycolytic enzymes downregulated in the mouse PSM during differentiation. Each value is normalized to the mean of MAS values of all triplicate mouse microarray series. The color bar shows fold change from mean.
(I) Lateral view of the tail bud region of 9.5-day mouse embryo stained with an antibody against Glut3 (n=5). Maximum projection of confocal sections. Fluorescence intensity is shown by pseudo-color image (16 color) using image J. Higher levels of Glut3 proteins are indicated in red-yellow. Scale bar : 100 μm.
Conservation of the posterior glycolytic gradient in developing chicken embryos
We next investigated whether this graded glycolytic activity is conserved between mouse and chicken embryos. We generated a microarray series from consecutive fragments of the developing chicken PSM similar to that performed in mouse (Chal et al., 2015)(Figure 2A, Figure S2). Most genes coding for glycolytic enzymes showed a posterior expression gradient in the chicken microarray series (Figure 2A–C, Table S3). Graded expression of several glycolytic enzymes was confirmed by in situ hybridization (Figure 2D). The glucose transporter GLUT3 was not detected in the chicken PSM but GLUT1 (SLC2A1) shows a posterior expression gradient (Figure 2B–D, Table S3). Furthermore, glucose uptake analysis with fluorescent glucose, (2NDBG) (Itoh et al., 2004; Yoshioka et al., 1996) demonstrates a clear posterior gradient peaking in the tail bud (Figure 2D). While this is not a direct measure of glucose uptake, because the fluorophore on this molecule is much larger than glucose, it is expected to show some correlation with glucose uptake. 2NDBG most likely interacts with glucose transporters and is a surrogate for glucose transporter expression. In the chicken embryo, analysis of lactate production using an enzymatic assay also shows a posterior gradient (Figure 2E). As observed in mouse, cytochrome C oxidase activity is also detected in the posterior glycolytic regions, and increased in A-PSM and somite (Figure 2F). No significant difference in ATP concentration was observed along the antero-posterior axis (Figure 2G). Thus, the posterior to anterior gradient of glycolytic activity in the tail bud is conserved between mouse and chicken embryos.
Figure 2. Conservation of the posterior glycolytic gradient in the chicken embryo.
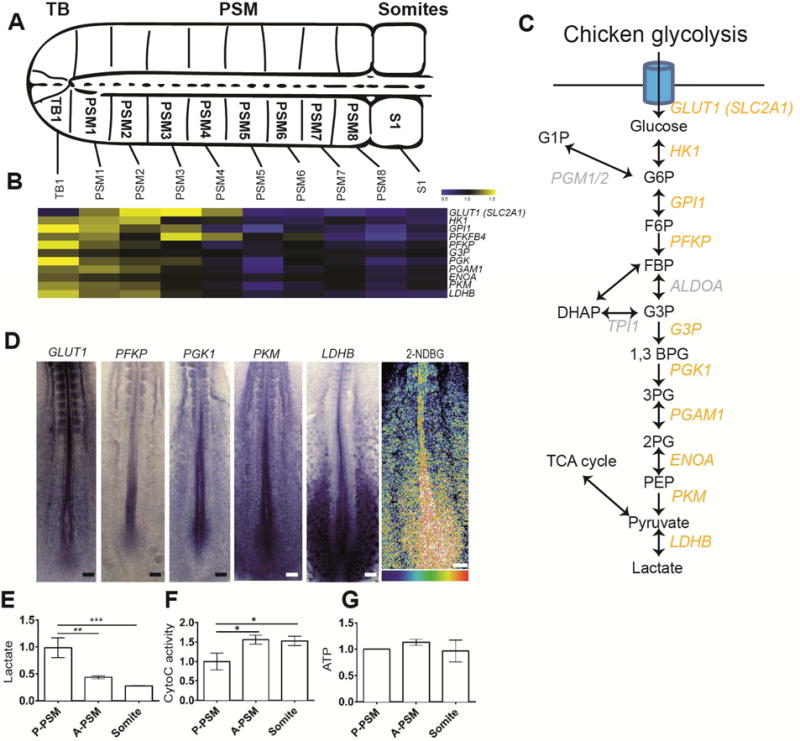
(A). Schematic representation of the posterior portion of a two-day old chicken embryo. The fragments micro-dissected to generate the microarray series are indicated. Dorsal view, anterior to the right. TB: Tail bud, PSM: Presomitic Mesoderm.
(B) Expression profiles of transcripts coding for glycolytic enzymes down-regulated in chicken PSM during differentiation as detected in the microarray series. Each value is normalized to the mean of MAS values of all duplicate chicken microarray series. Color bar shows fold change from mean.
(C) Schematic representation of the chicken glycolytic cascade. Yellow labeling indicates the glycolytic enzymes whose transcripts are downregulated in the chicken embryo tail bud and PSM.
(D) Left, posterior region of 2-day chicken embryos hybridized with probes for the glucose transporter GLUT1, and for the glycolytic enzymes PFKP, PGK1, PKM and LDHB. Right, fluorescent glucose (2-NDBG) uptake in the posterior region of a 2-day chicken embryo (n=11). Maximum projection of confocal sections. Fluorescence intensity is shown by pseudocolor image (16 color) using image J. Higher levels of fluorescent 2-NDBG are indicated in red-yellow. Ventral view, anterior to the top. Scale bar :100 μm.
(E–G) Enzymatic detection of relative lactate level, Cytochrome C oxidase activity, and relative ATP concentration during tail bud differentiation. Graphs represent triplicate experiments. Values were normalized by the P-PSM, Error bars ±SD. Statistical significance was assessed with one way ANOVA followed by Tukey’s test, * p<0.05, ** p<0.01, *** p<0.001).
FGF signaling regulates the transcription of rate limiting glycolytic enzymes
High levels of glycolysis have often been associated with the need to produce important quantities of substrates for anabolic reactions required to sustain the rapid proliferation of cancer or embryonic cells (Vander Heiden et al., 2009). The proliferation rate and cell cycle length in the tail bud and in the somitic region have been measured using a variety of approaches and they were found to remain relatively stable in the 2-day chicken embryo with a duration of around 9–11 hours (Gomez et al., 2008; Primmett et al., 1989; Venters et al., 2008). Therefore, the spatio-temporal regulation of glycolysis in the trunk is unlikely to reflect changes in the proliferation regime of embryonic cells. In the 2-day old chicken embryo, fluorescent glucose uptake is strikingly regionalized, peaking in the tail bud, posterior PSM and neural tube, the forming limb buds, the rhombomere 4 region and the anterior neural ridge which are regions which largely overlap with regions where FGF8 and its target SPRY2 are expressed (Figure 3A–C). In the posterior region of the embryo, the gradient of glucose uptake and of glycolytic activity is parallel to the gradient of FGF signaling which controls segmentation and elongation of the body axis (Benazeraf and Pourquie, 2013). To investigate the interactions between FGF signaling and the regulation of glycolysis, we examined the metabolic activity following treatment with FGF/MAPK inhibitors (Figure 3D–F). Lactate production was inhibited following treatment with SU5402 (an FGFR1 inhibitor) and PD0325901 (a MAPK inhibitor) (Figure 3D). In contrast, these inhibitors had no effect on mitochondrial Cytochrome C oxidase activity or ATP concentration (Figure 3E–F). Inhibitors of other signaling pathways important for PSM patterning including Notch (DAPT) and Retinoic Acid (BMS204493) did not affect lactate, ATP concentration or cytochrome C oxidase function (Figure 3D–F). Significant down-regulation of the expression of genes coding for the rate-limiting glycolytic enzymes PFKP, PGK1, PKM and LDHB (0.83, 0.77, 0.73 and 0.52 fold respectively, p<0.01) was observed by qPCR after PD0325901 treatment compared to control untreated embryos (Figure 3G). Down-regulation of this subset of glycolytic enzymes after PD0325901 treatment was subsequently confirmed by in situ hybridization (Figure 3H–K, and not shown). These results suggest that the posterior gradient of FGF/MAPK signaling controls the high glycolytic activity in the posterior PSM/tail bud by regulating the transcription of rate-limiting glycolytic enzymes.
Figure 3. FGF signaling regulates glycolysis in the posterior part of the embryo.
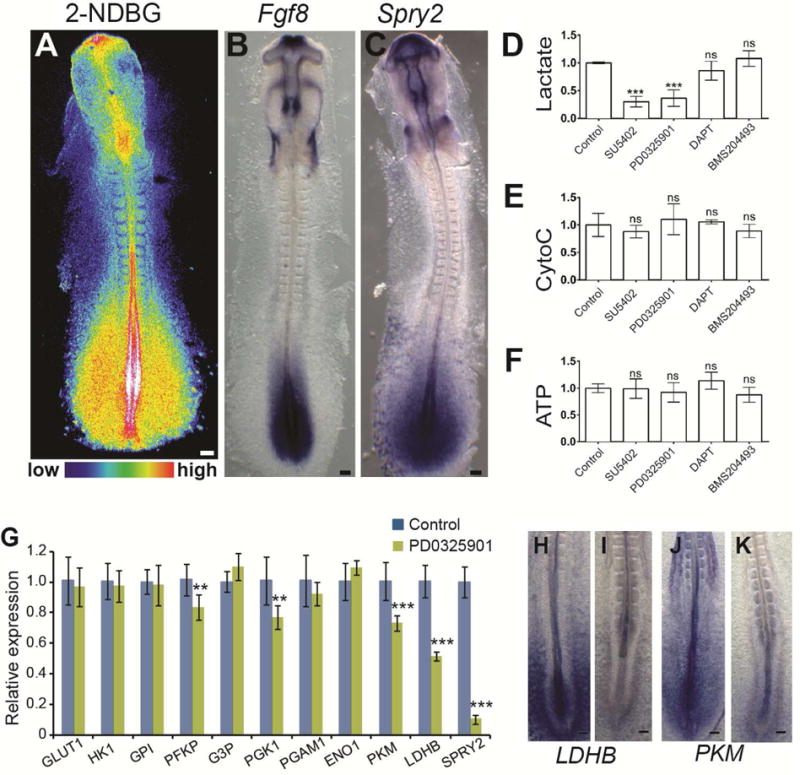
(A)Fluorescent glucose (2NDBG) uptake in a 2-day old chicken embryo. Maximum projection of confocal sections. Fluorescence intensity is shown by pseudo-color image (16 color) using image J. Higher levels of uptake indicated in red-yellow. Dorsal view, anterior to the top. Scale bar :100 μm.
(B–C) Whole mount in situ hybridization of 2-day chicken embryos with FGF8 (B) and SPRY2(C) probes. Dorsal view, anterior to the top. Scale bar :100 μm.
(D–F) Enzymatic detection of relative lactate level (D), of Cytochrome C oxidase activity (E), and of relative ATP concentration (F) in the posterior part of 2-day chicken embryos treated with inhibitors of FGF (SU5402), MAPK (PD0325901), Notch (DAPT) and Retinoic Acid (BMS204493) (n=6 for each condition). Graphs represent triplicate experiments. Values are normalized by untreated control embryos. Error bars ±SD. Statistical significance was assessed with one way ANOVA followed by Tukey’s test, ***p<0.001, ns p>0.05) (G) qPCR analysis of glycolytic enzymes expression levels in control (blue) and in embryos treated with the MAPK-inhibitor PD0325901 (green). Graphs represent triplicate experiments. Values are normalized by untreated control embryos, Error bars are ±SD. Statistical significance was assessed with unpaired two-tailed student t-test., **p<0.01, ***p<0.001
(H–I) Whole mount in situ hybridization with probes for the rate limiting glycolytic enzymes LDHB (H: n=8, I: n=7) and PKM (N: n=8, O: n=8), in control (H, J) and PD0325901-treated (I, K) 2-day old chicken embryos. Ventral view, anterior to the top.
Glycolysis regulates body axis elongation, extracellular pH and cell motility
To explore the role of glycolysis in tail bud development, we analyzed the effect of 2-Deoxy-D-glucose (2DG), a competitive inhibitor of Hexokinase, on stage 9–10 Hamburger and Hamilton (HH) (Hamburger and Hamilton, 1992) chicken embryos cultured in vitro using the EC culture system (Chapman et al., 2001). 2DG treatment led to strong down-regulation of lactate production (Figure 4A), but not of cytochrome C oxidase activity in the embryo (Figure 4B). ATP concentration was not significantly changed upon 2DG treatment suggesting that glycolysis in the posterior PSM/tail bud plays a limited role in energy production (Figure 4C). In contrast, treating chicken embryos with the respiration inhibitor Sodium Azide (NaN3) increased lactate production while it effectively (albeit incompletely) decreased Cytochrome C oxidase activity and ATP concentration in the tail bud region of the embryo (Figure 4A–C). 2DG treatment severely affected axis elongation, generating truncated embryos whereas somite formation continued at a normal pace leading to a progressive shortening of PSM length (Figure 4 D–F, Movie S1). In contrast, axis elongation was not affected by Sodium Azide treatment, while somite segmentation was blocked (Figure 4D, G, Movie S1) indicating a specific requirement of glycolysis for axial elongation. We next established a chemically defined culture system for chicken embryos in which we can control the level of energy substrates. When embryos are cultured in medium containing 0.15% glucose, elongation proceeds normally albeit at a slower pace compared to control EC cultures (Figure 4 H, J). In embryos cultured for 3 to 6 hours in the same medium but devoid of glucose, elongation is around four times slower when compared to embryos cultured in glucose-containing medium (Figure 4-I, J). In embryos cultured in glucose-free medium, a strong down-regulation of lactate production accompanied by a slight but significant decrease of ATP concentration is observed in the posterior region (Figure 4 K, L). No significant effect on cell proliferation or cell death was observed in embryos cultured in glucose-free medium after 3 hours (Figure S3). To explore the role of glutamine, which exhibits a gradient parallel to the glycolytic metabolites, we cultured embryos in glutamine-free defined medium. In these conditions, elongation proceeded similarly to glutamine-containing controls (data not shown). Thus, glutamine cannot substitute to glucose to promote elongation of the posterior body axis.
Figure 4. Glycolysis controls posterior elongation of the embryonic axis.
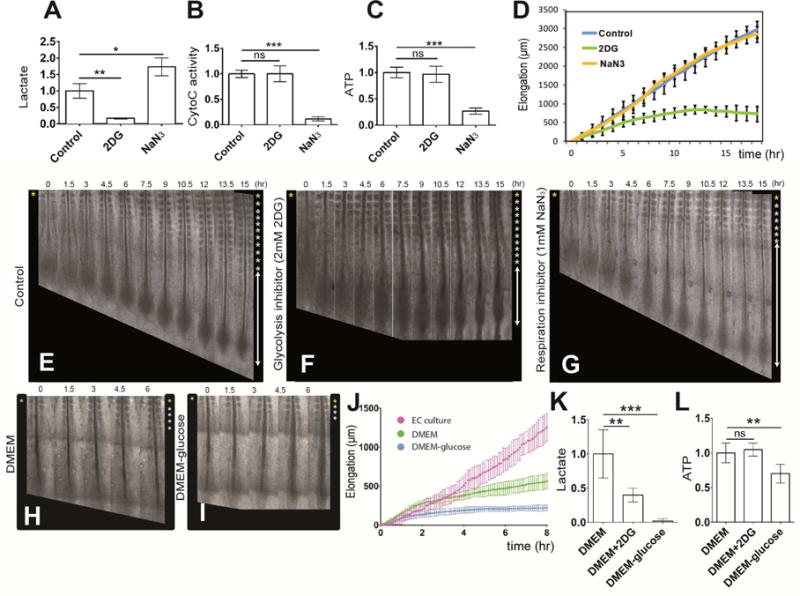
(A–C) Enzymatic detection of relative lactate level (A), of cytochrome C oxidase activity (B) and of relative ATP concentration (C) in the posterior region of control 2-day old chicken embryos and in embryos treated with 2DG or NaN3 (n=6 embryos for each condition). Graphs represent triplicate experiments. Values are normalized by untreated control embryos. Error bars are ±SD. Statistical significance was assessed with one way ANOVA followed by Tukey’s test, **p<0.01, ***p<0.001, ns p>0.5)
(D) Increase in axis length (elongation) measured over time using time lapse microscopy (mean ±SD). Blue, control embryos (n=8); green, 2DG-treated embryos (n=7); yellow, NaN3-treated embryos (n= 5).
(E–G) Elongation time course in a control (E), in a 2DG-treated (F) and in a NaN3-treated (G) 2-day chicken embryo. Bright field micrographs of the posterior region of a chicken embryos taken at 1.5 hour intervals. Somites formed at the last time point are indicated by asterisks on the right. Ventral views, anterior to the top. See also Movie S1 (H–I) Elongation time course in chemically defined DMEM-based culture with 0.15% glucose (H), and without glucose (I). Bright field micrographs of the posterior region of 2-day chicken embryos taken at 1.5 hour intervals. Somites formed at the last time point are indicated by asterisks on the right. Ventral views, anterior to the top.
(J) Increase in axis length (elongation) measured over time using time lapse microscopy (mean ±SD). Magenta, embryos in EC culture (n=5); green, embryos in defined 0.15% glucose DMEM-based cultures (n=4); blue, embryos in defined DMEM-based culture without glucose (n= 5).
(K,L) Enzymatic detection of relative lactate level (K) and of relative ATP concentration (L) in the posterior region of control 2-day old chicken embryos and in embryos cultured in defined DMEM-based medium with or without 0.15% glucose and in 2DG treated embryos (n=4 embryos for each condition). Graphs represent quadruple experiments. Values are normalized to 0.15% glucose embryos. Error bars are ±SD. Statistical significance was assessed with one way ANOVA followed by Tukey’s test, **p<0.01, ***p<0.001, ns p>0.5)
See also Figure S3
A gradient of random cell motility (diffusion) controlled by FGF/MAPK signaling in the PSM has been proposed to drive posterior elongation movements in the chicken embryo (Benazeraf et al., 2010). To test whether glycolysis controls motility in the posterior PSM, we measured the diffusion and analyzed cell trajectories of posterior PSM cells labeled by electroporation with H2B-Venus in embryos treated or not with 2DG (Figure 5 A–C, and Movie S2). We show that inhibition of glycolysis leads to a progressive down-regulation of cell diffusion which correlates with the slowing down of elongation (Figure 5 D–F). We observed a similar reduction of cell diffusion in embryos electroporated with H2B-Venus cultured in the chemically defined glucose-free medium when compared to control embryos (Figure 5 G–K and Movie S3).
Figure 5. Glycolysis inhibition decreases cell motility and increases pH in the posterior PSM.
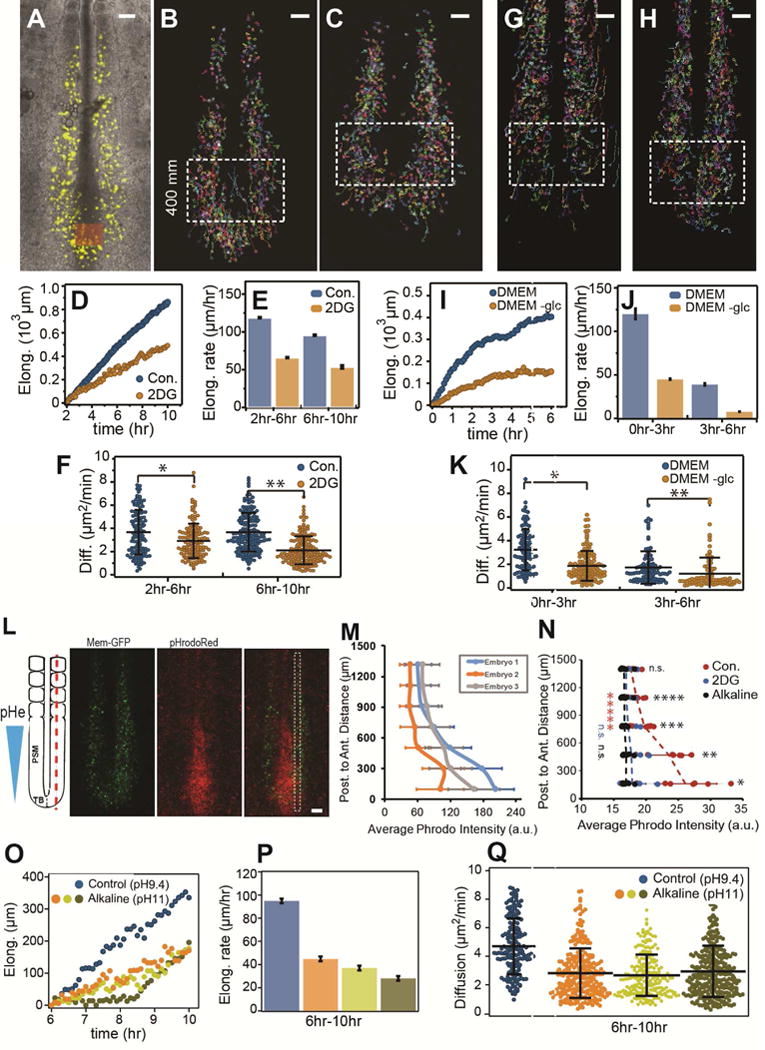
(A–F) Effect of 2DG treatment on cell motility (diffusion) and PSM elongation in 2-day chicken embryos. (A) Electroporated PSM cells expressing H2B-Venus are shown in yellow. (B) and (C) PSM cell trajectories for control and 2DG treated embryos respectively. Only tracks of cells located in the posterior PSM inside the box are used in the analysis. Scale bars: 100 μm. (D) Elongation curves showing the posterior displacement of the tail bud (orange box) as a function of time in the wild-type and 2DG-treated embryos. (E) Elongation rates of the embryos shown in (D), error bars are ±SD of the linear adjustments to data in (D). (F) Cell diffusion for control and 2DG- treated embryos shown from 2h–6h and from 6h–10h (mean ±SD, *p=0.0004, **p< .0001, t-test). See also Movie S2
(G–K) Cell motility (diffusion) and PSM elongation in chemically controlled conditions. (G) and (H) PSM cell trajectories for 2-day chicken embryos cultured in DMEM and DMEM without glucose respectively. Only tracks of cells located in the posterior PSM inside the box are used in the analysis. Scale bars: 100 μm. (I) Elongation curves showing the posterior displacement of the tail bud as a function of time in the DMEM and DMEM without glucose conditions. (J) Elongation rates of the embryos shown in (I), error bars are ±SD of the linear adjustments to data in (I). (K) Cell diffusion for DMEM and DMEM without glucose conditions shown from 0h–3h and from 3h–6h (mean ±SD, *p < .00001, **p=.0069, t-test). See also Movie S3
(L) Extracellular pH in the posterior part of a 2-day old chicken embryo labeled with pHrodo Red showing the gradient of extracellular pH (pHe). Red fluorescence labels regions of lower pH. Electroporated PSM cells expressing Gap-GFP are shown in green (Okada et al., 1999). Maximum projection of confocal sections of a 2-day chicken embryo. Ventral views, anterior to the top. pHrodo intensity was measured specifically in the PSM in the region highlighted by a white dashed box. Scale bar: 100μm.
(M) Quantification of intensity of pHrodo Red. Phrodo Intensity measured in 3 different embryos along the posterior-anterior axis using stripes in PSM as described in (L). Measurements were binned every 200μm and the average intensity (±SD) is shown. Absolute Phrodo intensity values may vary as a result of different embryo/imaging conditions. Embryo 1 is (L).
(N) Effect of culturing embryos on 2DG-containing and on alkaline plates on the pHe gradient. Each dot represents average fluorescence intensity measured in a ~0.26mm2 area of each embryo along the posterior to anterior axis. Lines represent average intensity (±SD) (Control: n=7, alkaline: n=8, 2DG; n=7). (*p=0.001, **p=0.001, ***p=0.003, ****p=0.006, (n.s.) p=0.15, t-tests).
******(red, Control) p=0.002, n.s.(blue, 2DG) p=0.14, n.s.(black, NaOH) p=0.35. Paired t-tests to compare the A–P ends of the pHe gradient.
(O–Q) Effect of culture on alkaline plates on cell motility and PSM elongation in 2-day chicken embryos. (O) Elongation curves for control and embryos cultured on alkaline plates. (P) Elongation rate corresponding to the curves in (O). (Q) Cell diffusion for control and embryos cultured on alkaline plates (mean ±SD, p<.01 between control and NaOH cases and n.s. among NaOH using one way ANOVA followed by Tukey’s test). See also Movie S4, Figure S4
In tumors or in blastocysts embryos, cell motility is promoted by aerobic glycolysis which leads to acidification of the extracellular environment as a result of lactic acid excretion (Gardner, 2015; Parks et al., 2013). This in turn triggers activation of matrix metalloproteinases (MMP) involved in remodelling extracellular matrix. In the PSM, the pH sensitive enzyme MMP2 is expressed in a posterior gradient (Figure S4 A–B). We observed that 2-day chicken embryos labeled with the pH sensor pHrodo Red (Ogawa et al., 2010) exhibit a posterior to anterior gradient of extracellular pH, with the lowest pH found in the tail bud where glycolysis is most active (Figure 5 L–M). This pH gradient can be abolished by incubating embryos on alkaline plates (pH 11) (Figure 5N). Treatment of the embryos with 2DG prior to labeling also results in a uniform higher pH (Figure 5N) suggesting that glycolysis is involved in the acidification of the extracellular environment at the posterior end of the embryo. Embryos cultured on alkaline plates also exhibit much slower axis elongation (Figure 5O) while somite formation continues to proceed at a normal pace (Figure S4 C–D and Movie S4). Paraxial mesoderm markers such as CMESO1 or T were still expressed in embryos cultured on alkaline plates (Figure S4 E–H). Analysis of embryos in which paraxial mesoderm precursors were electroporated with an H2B-Venus construct cultured on alkaline plates revealed a decrease in cell diffusion paralleling the decrease in the speed of axis elongation (Figure 5O–Q, Movie S4). Together, these experiments suggest that glycolysis acts downstream of FGF signaling to promote acidification of the extracellular environment and cell motility.
Glycolysis regulates Wnt signaling and maintenance of the NMPs in the tail bud
Rhythmic somite formation is driven by a molecular oscillator, termed segmentation clock, which drives cyclic activation of the Wnt, FGF and Notch pathways (Hubaud and Pourquie, 2014). Dynamic patterns of Lunatic Fringe, a cyclic gene controlled by the segmentation clock were observed in 2DG-treated embryos suggesting that periodic signaling driven by the clock remains functional (Figure 6 A, B). This contrasts with data obtained on PSM explants from mouse embryos cultured in absence of glucose, where Lunatic Fringe periodic expression are blocked (Bulusu et al, this issue). The two sets of experiments however differ in that 2DG inhibition of glycolysis is incomplete (Figure 4A). In the chicken embryo, the presumptive segment is first visible as a stripe of expression of the gene CMESO1 (a chicken homologue of the mouse Mesp2 gene). Upon 2DG treatment, CMESO1 mRNA expression was normally expressed as a bilateral stripe in the anterior PSM (Figure 6 H, M). In contrast, expression of Lunatic Fringe was down-regulated in presence of NaN3, consistent with the segmentation defects observed (Figure 6C). Accordingly, exposing developing mouse embryos to hypoxic conditions disrupts FGF signaling and segmentation (Sparrow et al., 2012). Thus 2DG treatment impairs body elongation but not segmentation.
Figure 6. Inhibition of glycolysis phenocopies Wnt signaling inhibition in the tail bud.
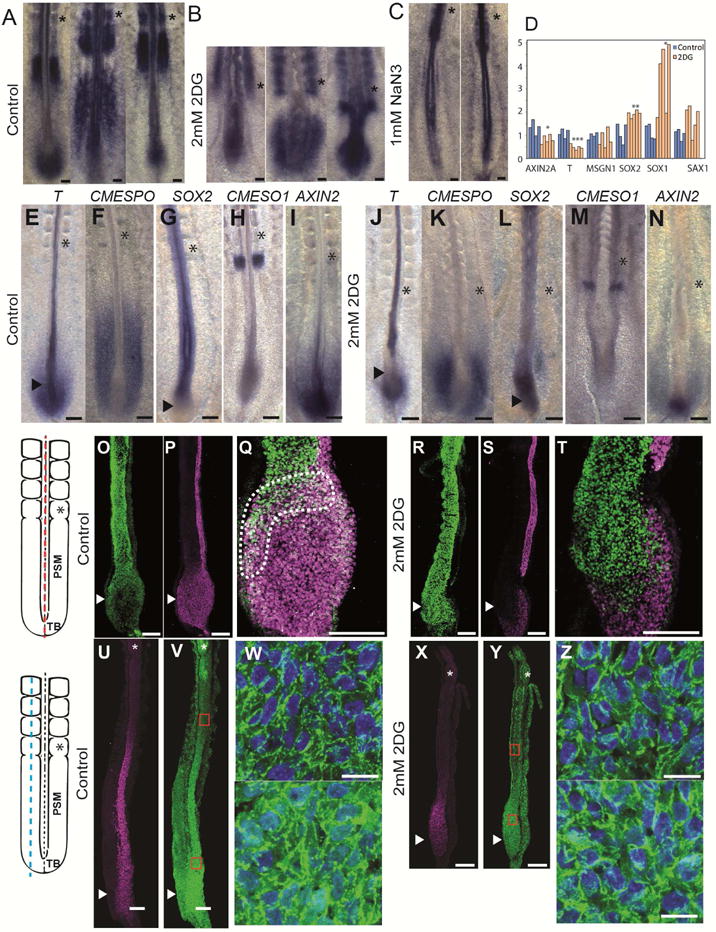
(A–C) Whole mount in situ hybridizations showing the posterior region of 2-day old control (A, n=24), 2DG-treated (B, n=16) and NaN3-treated (C, n=13) chicken embryos hybridized with LFNG probe. Scale bar :100 μm. Asterisk indicate newly formed somites.
(D) qPCR analysis of the posterior region of 2-day old chicken embryos treated or not with 2DG and incubated for 10 h. Statistical significance was assessed with unpaired two-tailed student t-test. * p<0.05, **p<0.01, ***p<0.001.
(E–N) Whole mount in situ hybridizations showing the posterior region of 2-day old control (E–I) or 2DG-treated (J–N) chicken embryos hybridized with the following probes: T (BRACHYURY)(E: n=4, J: n=6); CMESPO (F: n=5, K: n=5); SOX2 (G: n=7, L: n=4); CMESO1 (H: n=5, M: n=4); Axin2 (I: n=5, N: n=4). Asterisks indicate the last formed somite, and arrowheads indicate tail bud region. Ventral view, anterior to the top. Scale bar: 100 μm.
(O–T) SOX2 (O, R) and T /BRACHYURY (P, S) protein expression in control (O–Q) and 2DG-treated (R–T) 2-day chicken embryos (n=4 for each condition). (Q, T) Higher magnification of the tail bud stained with SOX2 and T/BRACHYURY. Stippled line delineates the double positive cells in the chordo-neural hinge region. Left panel shows schematic representation of the posterior part of a 2-day chicken embryo indicating the position of the sections shown in O–T (axial red dotted line).
(U–Z) Expression of CMESPO (U, X) and CTNNB1 (Beta-Catenin) (V–W, Y–Z) proteins in sagittal sections of a 2-day old control (U–Z, n=5), and a 2DG-treated (X–Z, n=4) chicken embryo.
(W–Z) Higher magnification of the regions boxed in red in (V, Y) showing the nuclear localization of B-CATENIN. Top panel shows anterior PSM. Nuclei labeled with DAPI are shown in blue.
Left panel shows a schematic representation of the posterior part of a 2-day chicken embryo indicating the position of the sections shown in U–Z (Paraxial blue dotted line).
Scale bar : 100 μm (A–C, E–T, U–V, X–Y), 10 μm (W, Z) Asterisk indicates newly formed somites, and arrowheads indicate tail bud region.
Maintenance of the posterior elongation movements requires a constant supply of motile cells in the forming posterior PSM (Benazeraf and Pourquie, 2013). In 2DG-treated embryos, the size of the expression domains of the posterior PSM markers, T/BRACHYURY (Figure 6 E, J), and CMESPO (the chicken homologue of Mesogenin1) (Figure 6 F, K) strongly decreased, suggesting an arrest of PSM cells production. In contrast, expression of the neural marker SOX2 was expanded posteriorly in the tail bud of treated embryos (Figure 6 G, L). No significant effect of 2DG treatment on proliferation and apoptosis in the paraxial mesoderm could be detected (Figure S5). The posterior paraxial mesoderm and neural tube derive from a group of neuro-mesodermal precursors (NMPs) found in the tail bud region which co-express SOX2 and BRACHYURY (Henrique et al., 2015; Kimelman, 2016; Tzouanacou et al., 2009)(Figure 4O–Q). In chicken embryos treated with 2DG, the SOX2-BRACHYURY double positive expression domain was replaced by cells only expressing SOX2 (compare Figure 6 O–Q with R–T). This suggests that NMPs differentiated into neural cells, leading to the termination of paraxial mesoderm production. We electroporated the NMP region in the anterior primitive streak with an H2B-RFP construct in transgenic chicken embryos expressing GFP ubiquitously and monitored the fate of the descendants of the electroporated NMPs. In control embryos, NMPs contribute to both neural and paraxial mesoderm lineages whereas in embryos treated with 2DG, NMPs stop producing paraxial mesoderm cells while continuing to populate the forming neural tube (Movie S5). Since axis elongation is largely driven by the posterior paraxial mesoderm (Benazeraf et al., 2010), arrest of its production can contribute to explain the arrest of elongation. Therefore, the high glycolytic state in the tail bud is also required for the maintenance of the NMPs cells and for the regulation of the balance of the differentiation rate between paraxial mesoderm and neural lineages. This phenotype resembles that observed when either Wnt3a or its targets Brachyury and Tbx6 are mutated in mouse where ectopic neural tissue forms instead of paraxial mesoderm (Chapman and Papaioannou, 1998; Greco et al., 1996; Nowotschin et al., 2012; Takemoto et al., 2011; Yamaguchi et al., 1999). In the chicken embryo, the termination of axis elongation is also associated with a decrease in Wnt signaling and with the differentiation of the SOX2+/BRACHYURY+ cells into SOX2+/BRACHYURY- cells (Olivera-Martinez et al., 2012). Thus, the phenotype elicited by 2DG treatment phenocopies Wnt loss of function in the tail bud of mouse and chicken embryos. This led us to examine whether glycolysis inhibition down-regulates Wnt signaling. In control chicken embryos, nuclear β-catenin (CTNNB1) shows a posterior gradient in the PSM as reported for mouse embryos (Figure 6U–W) (Aulehla et al., 2008). This high nuclear β-catenin domain coincides with the expression domain of CMESPO (Figure 6U), a direct target of Wnt signaling in the PSM (Buchberger et al., 2000; Wittler et al., 2007). 2DG treatment strongly reduced nuclear β-catenin localization in the posterior PSM region (Figure 6X–Z). By qPCR on 2DG treated embryos’ posterior domain, we detect a significant down-regulation of the Wnt targets AXIN2 and BRACHYURY whereas the neural markers SOX2 and SOX1 were significantly up-regulated (Figure 6D). Together, these data argue that glycolysis regulates Wnt signaling in the posterior PSM/tail bud of the chicken embryo.
Wnt and FGF signaling are known to mutually regulate each other in the PSM (Aulehla and Pourquie, 2010; Naiche et al., 2011). Accordingly, embryos treated with the FGF/MAPK inhibitor PD0325901 also stopped elongating and showed reduced phosphorylated MAPK and Wnt activity (Figure 7 A–I, O–Q). Glycolysis inhibition also strongly reduced expression of markers of Wnt activation such as AXIN2 (Figure 7M) as well as targets of FGF signaling such as phosphorylated MAPK and SPROUTY2 (Figure 7F–G, M–N). Since Wnt3a in the PSM controls Fgf8 expression in the mouse embryo (Aulehla et al., 2003), our data supports the existence of a closed regulatory loop linking FGF and Wnt signaling via glycolysis in the PSM. From these results we conclude that glycolysis downstream of FGF signaling is required to maintain the Wnt gradient in the posterior PSM. In turn, the Wnt gradient is required to maintain FGF activation.
Figure 7. Phenotypic correlation between FGF and glycolysis inhibition.
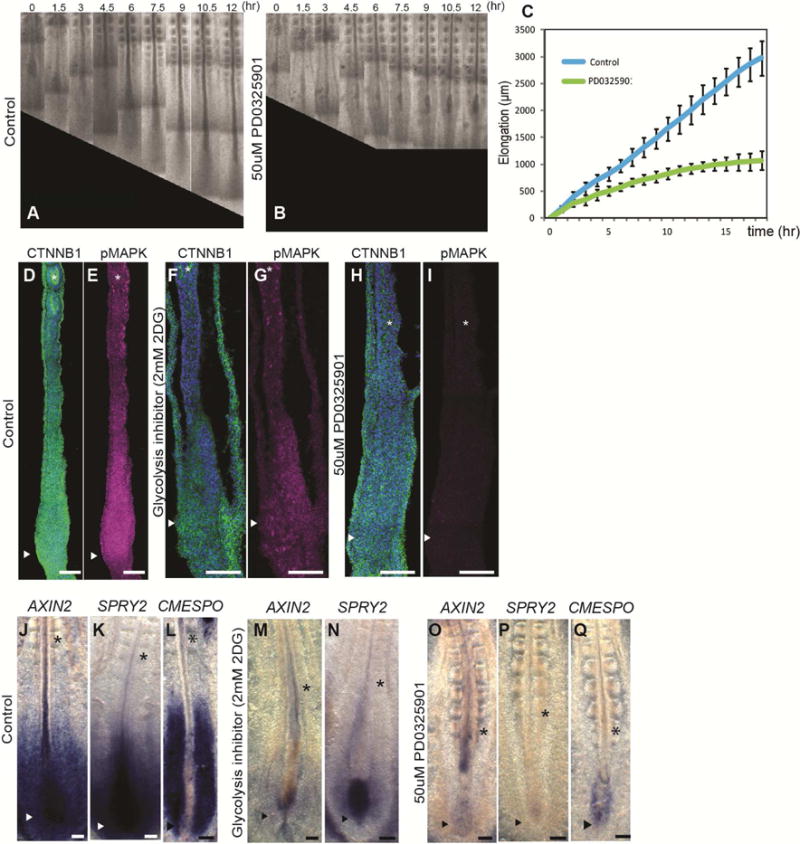
(A–B) Micrographs taken at 1.5 hour intervals of the posterior region of 2-day old chicken embryo control (A) and treated with PD0325901 (B).
(C) Graph showing the increase in axis length (elongation) measured using time lapse microscopy. in 2-day chicken control embryos (blue) and PD0325901-treated embryos (green). Data represent the average of 5 embryos per conditions, error bars are mean ±SD. (D–I) Expression of CTNNB1 (Beta-Catenin) (green, D, F, H) and phosphorylated MAPK (magenta, E, G, I) in longitudinal sections of control (D, E: n=5), 2DG-treated (F, G: n=4) and PD0325901-treated (H, I: n=4) 2-day chicken embryos. Sections shown in (D, F, H) are counterstained with DAPI (in blue) to visualize the nuclei.
(J–Q) Expression of AXIN2 (J, M, O), SPRY2 (K, N, P), CMESPO (L, Q) detected by whole mount in situ hybridization in the posterior part of 2-day old chicken control embryos (J: n=5, K: n=5, L: n=4), 2DG-treated embryos (M: n=4, N: n=3) and PD0325901-treated embryos (O: n=4, P: n=3, Q: n=4).
Scale bar : 100 μm (D–Q). Ventral view, anterior to the top. Asterisk indicate newly formed somites, and arrowheads indicate tail bud region.
Conclusion
Our study shows that glycolysis acts independently of energy production in specific developmental processes necessary to sustain posterior elongation of the embryonic axis: the Wnt-dependent production of paraxial mesoderm cells from tail bud NMPs and the control of their motility. How glycolysis regulates Wnt signaling remains to be established. In yeast and cancer cells, glycolysis regulates intracellular pH which in turn controls V-ATPase assembly (Dechant et al., 2010). The recent implication of V-ATPase in Wnt signaling might provide a link between glycolysis and Wnt in the embryo (Cruciat et al., 2010). The effect on cell motility might be linked to the role of localized glycolytic activity ensuring rapid delivery of ATP for actin polymerization to the forming protrusions which was hypothesized in cancer or in endothelial cells (De Bock et al., 2013; Nguyen et al., 2000).
Our data are corroborated by a companion study which used a different set of approaches to identify a similar gradient of glycolytic activity in the posterior PSM of mouse embryos (Bulusu et al, this issue). Using metabolic labeling, this study demonstrated an increase in the glycolytic flux in the posterior PSM of mouse embryos. The striking similarities between the embryonic metabolic state described in these two reports and the Warburg metabolism suggest that cancer cells could redeploy a specific embryonic metabolic program with significant consequences on cell signaling and proliferation. Strikingly however, the increased aerobic glycolysis observed in the tail bud and posterior PSM does not appear to correlate with an increased proliferation rate, supporting different roles for this type of metabolism such as coordinating cell signaling.
STAR METHODS
CONTACT FOR REAGENT AND RESOURCE SHARING
Further information and requests for resources and reagents should be directed to and will be fulfilled by the Lead Contact, Olivier Pourquie (pourquie@genetics.med.harvard.edu).
EXPERIMENTAL MODEL AND SUBJECT DETAILS
Animals
E9.5 mice embryos were obtained from breeding pairs of CD1 female and male by Institut Clinique de la Souris (Strasbourg, France). Fertilized chicken eggs were obtained from commercial sources. GFP-chicken eggs were obtained from Clemson University (McGrew et al., 2004). Eggs were incubated at 38°C in a humidified incubator and embryos were staged following the Hamburger and Hamilton (HH) table (Hamburger and Hamilton, 1992). All animal experiments were performed according to the institutions guidelines (IGBMC).
Chicken embryo culture EC culture
In this study, we started to culture chicken embryos mainly from stage 9HH at 37°C using the Early Chick (EC) culture system (Chapman et al., 2001). For drug treatments, 2mM 2DG (2-Deoxy-D-glucose; Sigma) and 1mM NaN3 (sodium azide; Sigma) albumin plates were prepared. For signaling inhibitors, 500μM SU5402 (Sigma), 50μM PD0325901 (AXON MEDCHEM BV), 100μM DAPT (Sigma) or 50μM BMS204493 (synthesized by Novalix) were diluted in PBS, and 100 μl of the inhibitor solution was added under and on top of the embryos. For alkaline plates, 23mM NaOH albumin plates (2 ml) were prepared, so that they reached pH11.0-11.3 (the pH of control albumin plates is 9.4–9.6).
Chemically defined culture system
Embryos were prepared and cultured as described above on culture plates which include DMEM/F12 w/o glucose medium (USBiological, D9807-02), 0.12% Sodium bicarbonate (Sigma), 1% chicken ovalbumin (Sigma) and 0.3% BactoAgar (BD Bioscience) adding 0.15% glucose in DMEM-plate.
METHOD DETAILS
Mouse embryos dissection and metabolome analysis
The posterior end of three hundred day 9.5 CD1 mouse embryos was dissected into three consecutive fragments of roughly equivalent size along the antero-posterior axis as shown in Figure 1A. The most posterior fragment includes the tail bud and the level of the posterior PSM, the next level correspond to the level of the anterior PSM and the most anterior level corresponds to the most posterior somitic region. Embryos were dissected in cold PBS on silicone-covered Petri dishes and frozen by batches of five in liquid nitrogen. Triplicate pools of fragments of each level were created. Samples were then shipped to Metabolon Inc. (Durham, NC, USA) for metabolomics analysis and Metabolomic profiling analysis was performed by Metabolon as described below and in (Evans et al., 2009; Reitman et al., 2011).
Sample Accessioning
Each sample received was accessioned into the Metabolon LIMS system and was assigned by the LIMS a unique identifier that was associated with the original source identifier only. This identifier was used to track all sample handling, tasks, results etc. The samples (and all derived aliquots) were tracked by the LIMS system. All portions of any sample were automatically assigned their own unique identifiers by the LIMS when a new task is created; the relationship of these samples is also tracked. All samples were maintained at −80 °C until processed.
Sample Preparation
Samples were prepared using the automated MicroLab STAR® system from Hamilton Company. A recovery standard was added prior to the first step in the extraction process for QC purposes. Sample preparation was conducted using aqueous methanol extraction process to remove the protein fraction while allowing maximum recovery of small molecules. The resulting extract was divided into four fractions: one for analysis by UPLC/MS/MS (positive mode), one for UPLC/MS/MS (negative mode), one for GC/MS, and one for backup. Samples were placed briefly on a TurboVap® (Zymark) to remove the organic solvent. Each sample was then frozen and dried under vacuum. Samples were then prepared for the appropriate instrument, either UPLC/MS/MS or GC/MS.
Ultrahigh performance liquid chromatography/Mass Spectroscopy (UPLC/MS/MS)
The LC/MS portion of the platform was based on a Waters ACQUITY ultra-performance liquid chromatography (UPLC) and a Thermo-Finnigan linear trap quadrupole (LTQ) mass spectrometer, which consisted of an electrospray ionization (ESI) source and linear ion-trap (LIT) mass analyzer. The sample extract was dried then reconstituted in acidic or basic LC-compatible solvents, each of which contained 8 or more injection standards at fixed concentrations to ensure injection and chromatographic consistency. One aliquot was analyzed using acidic positive ion optimized conditions and the other using basic negative ion optimized conditions in two independent injections using separate dedicated columns. Extracts reconstituted in acidic conditions were gradient eluted using water and methanol containing 0.1% formic acid, while the basic extracts, which also used water/methanol, contained 6.5mM Ammonium Bicarbonate. The MS analysis alternated between MS and data-dependent MS2 scans using dynamic exclusion. Raw data files are archived and extracted as described below.
Gas chromatography/Mass Spectroscopy (GC/MS)
The samples destined for GC/MS analysis were re-dried under vacuum desiccation for a minimum of 24 hours prior to being derivatized under dried nitrogen using bistrimethyl-silyl-triflouroacetamide (BSTFA). The GC column was 5% phenyl and the temperature ramp was from 40° to 300° C in a 16 minute period. Samples were analyzed on a Thermo-Finnigan Trace DSQ fast-scanning single-quadrupole mass spectrometer using electron impact ionization. The instrument was tuned and calibrated for mass resolution and mass accuracy on a daily basis. The information output from the raw data files was automatically extracted as discussed below.
Quality assurance/QC
For QA/QC purposes, additional samples were included with each day’s analysis. These samples included extracts of a pool of well-characterized human plasma, extracts of a pool created from a small aliquot of the experimental samples, and process blanks. QC samples were spaced evenly among the injections and all experimental samples were randomly distributed throughout the run. A selection of QC compounds was added to every sample for chromatographic alignment, including those under test. These compounds were carefully chosen so as not to interfere with the measurement of the endogenous compounds.
Data extraction and compound identification
Raw data was extracted, peak-identified and QC processed using Metabolon’s hardware and software. These systems are built on a web-service platform utilizing Microsoft’s. NET technologies, which run on high-performance application servers and fiber-channel storage arrays in clusters to provide active failover and load-balancing(Dehaven et al., 2010). Compounds were identified by comparison to library entries of purified standards or recurrent unknown entities. Metabolon maintains a library based on authenticated standards that contains the retention time/index (RI), mass to charge ratio (m/z), and chromatographic data (including MS/MS spectral data) on all molecules present in the library. Furthermore, biochemical identifications are based on three criteria: retention index within a narrow RI window of the proposed identification, nominal mass match to the library +/− 0.2 amu, and the MS/MS forward and reverse scores between the experimental data and authentic standards. The MS/MS scores are based on a comparison of the ions present in the experimental spectrum to the ions present in the library spectrum. While there may be similarities between these molecules based on one of these factors, the use of all three data points can be utilized to distinguish and differentiate biochemicals. More than 2400 commercially available purified standard compounds have been acquired and registered into LIMS for distribution to both the LC and GC platforms for determination of their analytical characteristics.
Chicken embryo PSM microdissection and Microarray
PSM microdissection was performed as described (Chal et al., 2015). Stage 12HH chicken embryos were pinned on a silicon-coated petri dish in PBS. After removing the endoderm and the ectoderm, both the left and right posterior paraxial mesoderm from the same embryo were dissected into 10 pieces each. All the fragments were stored in Trizol (Invitrogen) at −80°C for subsequent RNA extraction. Biotinylated cRNA targets were prepared from total RNA using a double amplification protocol according to the GeneChip® Expression Analysis Technical Manual: Two-Cycle Target Labeling Assay (P/N 701021 Rev.5, Affymetrix, Santa Clara, USA). Following fragmentation, cRNAs were hybridized on GeneChip® chicken Genome arrays. Each microarray was then washed and stained on a GeneChip fluidics station 450 and scanned with a GeneChip Scanner 3000 7G. Finally, raw data (.CEL Intensity files) were extracted from the scanned images using the Affymetrix GeneChip Command Console (AGCC) version 3.1. CEL files were further processed with MAS5 and RMA algorithms using the Bioconductor package (version 2.8) available through R (version 2.12.1). Probe sets were filtered based on their expression intensity value (MAS5 value). Fold changes were compared between average of MAS values of each fragment for mouse triplicate microarray series (Chal et al., 2015) or chicken duplicate microarray series. Statistical comparisons were performed with unpaired two-tailed student t-test. Microarray data were deposited in GEO database under the accession number of GSE39613 for Mouse and GSE75798 for chicken samples.
Measurement of metabolic activity
The posterior end of day 9.5 CD1 mouse embryos and stage 11 HH chicken embryos were dissected into 3 parts corresponding to the levels of the posterior PSM (P-PSM), the anterior PSM (A-PSM) and the newly formed somites in cold PBS using tungsten needles (Figure 1A). For each analysis, fragments of the same level from 3 embryos were immediately frozen in liquid nitrogen and pooled. Whole cell lysates were prepared by pipetting and vortexing in PBS containing 0.5% Tween 20 and protease inhibitor cocktails (Roche). Each sample was normalized by measuring total protein levels using Bio-Rad protein assay kit (Bio-Rad). To analyze the effect of drugs on metabolic activity, stage 9 HH chicken embryos were incubated at 37°C with inhibitors in EC culture as described above. After 10 h of incubation, the posterior end of treated embryos was dissected and samples were prepared as described above. For chemically defined culture system, after 6h of incubation on culture plates which include DMEM/F12 w/o glucose medium, the posterior end of embryos was dissected and samples were prepared as described above. Cellular lactate levels were measured using a Lactate assay kit (biovision) in accordance with the manufacturer’s instructions. Cellular ATP levels were measured using ATPlite Luminescence ATP Detection Assay System (Perkin-Elmer) in accordance with the manufacturer’s instructions. Cytochrome-C oxidase activity was measured using CytoCHROME C oxidase assay kit (Sigma) in accordance with the manufacturer’s instructions. Biological triplicates of the experiments were performed, and experiments were reproduced at least twice for each measurement of metabolic activity. Values obtained for these assays were normalized by P-PSM or by control values to compare the different AP levels.
Time-lapse imaging and axis elongation measurement
Stage 9HH chicken embryos were cultured ventral side up on a microscope stage using a custom built time-lapse station (Benazeraf et al., 2010). We used a computer controlled, wide-field (10× objective) epifluorescent microscope (Leica DMR) workstation, equipped with a motorized stage and cooled digital camera (QImaging Retiga 1300i), to acquire 12-bit grayscale intensity images (492 × 652 pixels). For each embryo, several images corresponding to different focal planes and different fields were captured at each single time-point (frame). The acquisition rate used was 10 frames per hour (6 min between frames). To quantify axis elongation length, the image sequence was first registered to the last formed somite at the beginning of the time-lapse experiment (yellow asterisk in Fig 3), and the advancement of the Hensen’s Node was tracked as a function of time using the manual tracking plug-in in Image J (Denans et al., 2015).
Whole mount in-situ hybridization
Stage 9HH embryos were cultured with and without drugs at 38 °C in EC culture. After 16 h of incubation with 2DG, 10hr incubation with PD035901 embryos or 6h culture on alkaline plate (pH11) were fixed in 4% paraformaldehyde (PFA). Whole mount in situ hybridization was carried out as described (Henrique et al., 1995). Briefly, formaldehyde-fixed embryos were treated with protease and refixed with 4% formaldehyde/0.1% glutaraldehyde. Hybridization with DIG-labelled RNA probes was performed under stringent conditions (1.3 X SSC, 50% formamide at 65°C, pH5) in a buffer containing 0.2% Tween-20 and 0.5% CHAPS. Washed embryos were treated with Boehringer blocking reagent and incubated overnight in alkaline phosphatase-coupled anti-DIG antibody. After extensive washes, embryos were stained from 30 minutes to 16 hours. Probes for FGF8 (Crossley and Martin, 1995), AXIN2 (Krol et al., 2011), CMESO1 (Buchberger et al., 1998), CMESPO (Buchberger et al., 2000), SPRY2 (Minowada et al., 1999), L-fng (McGrew et al., 1998) and BRACHYURY (Knezevic et al., 1997) have been described. Probes for GLUT1, PFKP, PGK1, PKM, LDHB were generated from chicken embryo cDNA by PCR using published sequences (NCBI).
CMESPO Antibody generation
cDNA coding for the full length chicken CMESPO was cloned in pET vector expression system (Novagen), expressed in E.coli. The recombinant protein was purified with His-Bind Kit (Novagen) and used to immunize rabbits (Cocalico Biologicals, Inc.). Sera were collected, assayed and validated by immunohistochemistry and used as anti-CMESPO/MESOGENIN1 polyclonal antibody.
Immunohistochemistry
For whole mount immuno-histochemistry, 9.5 day CD1 mouse embryos and stage 12HH chicken embryos were fixed in 4% paraformaldehyde (PFA) at 4 °C overnight. Embryos were incubated with an antibody against Glut3 (1/300, Abcam) at 4 °C overnight, and next with secondary antibodies conjugated with AlexaFluor (Molecular probes) at 4 °C overnight. Images were captured using a laser scanning confocal microscope (TCS LSI; Leica) for Glut3 staining.
For histological analysis, stage 9HH chicken embryos cultured with or without 2DG for 16h were fixed in 4% PFA. Embryos were then embedded in OCT compound and frozen in liquid nitrogen. Frozen sections (20μm) were incubated overnight at 4 °C with the primary antibody, and after washing they were incubated overnight at 4 °C with the secondary antibody conjugated with AlexaFluor (Molecular probes). We used antibodies against T/BRACHYURY (1/1000, R&D Systems: AF2085), SOX2 (1/1000, Millipore: ab5603), CTNNB1/β-Catenin (1/500, BD transduction laboratories: #610153): For CTNNB1 staining, antigen retrieval (Incubation with Target Retrieval Solution Citrate pH6 (DAKO) at 105 °C for 10min) was needed before first antibody incubation. The BRACHYURY and SOX2 staining images were captured using a laser scanning confocal microscope with a 40X objective (TCS SP5; Leica). To image the whole PSM, we used the tiling and stitching function of the microscope (3 by 2 matrix). For CMESPO and CTNNB1 stainings, images were captured using a laser scanning confocal microscope with a 20X objective (TCS SP5; Leica). Whole images were created by tiling the scans of 8 images. High magnification images were captured with a 63X objective.
Plasmid preparation and electroporation
pCAGG-H2B-Venus and pCAGG-H2B-RFP have been described (Denans et al., 2015). Chicken embryos ranging from stage 6HH to stage 7HH were prepared for EC culture. A DNA solution (1.0–5.0 μg/μl) was microinjected in the space between the vitelline membrane and the epiblast surrounding the anterior primitive streak level, which contains the precursors of the paraxial mesoderm. In vitro electroporations were carried out with five successive square pulses of 8V for 50ms, keeping 4mm distance between anode and cathode using Petri dish type electrodes (CUY701P2, Nepa Gene, Japan) and a CUY21 electroporator (Nepa Gene, Japan). This procedure only labels the superficial epiblast layer. For time-lapse analysis, after electroporation, embryos were re-incubated in a humidified incubator until they reached stage 9HH at 38 °C, then embryos were transferred to the microscope stage for time-lapse imaging.
Cell proliferation and apoptosis analysis
Stage 9 HH chicken embryos were cultured on agar plates containing 2DG or NaN3 at 38 °C for 12 h. Embryos were fixed in 1% PFA at 4 °C for 20min. Whole mount TUNEL staining was performed using the ApopTag Red In Situ kit (#S7165; Millipore), and proliferating cells were stained using anti-Phospho-histone H3 (pH3) antibody (1/1000, Millipore). For the chemically defined culture system (in figure S3), stage 11HH chicken embryos were cultured on culture plates which include DMEM/F12 w/o glucose medium (with LysoTracker Red DND-99 (1/500, Fischer scientific) diluted in PBS for detecting apoptotic cells), after 3hr culture embryos were fixed in 4% PFA 4 °C for 20min. Apoptotic cells were stained by LysoTracker Red and proliferating cells were stained as described above. Images were captured using a laser scanning confocal microscope (TCS SP5; Leica). Ratios of proliferating and apoptotic cells were calculated by manual counting for DAPI, pH3 and TUNEL positive cells.
Quantitative RT-PCR
Stage 9 HH embryos were cultured with or without 2mM 2DG and PD035901 at 38 °C for 10 h. Then total RNA was extracted from dissected tailbud regions. 500ng~1μg total RNA was used as template for cDNA synthesis using the QuantiTect kit (Qiagen) or Super script III (Thermo Fisher Scientific). RT-PCR was performed using QuantiFast SYBR Green RT-PCR Kit (Qiagen) primers or iTaq Universal SYBR Green Supermix (Bio-Rad) and run on a LightCycler 480II (Roche) or CFX384 Touch qPCR System (Bio-Rad). Beta-Actin was used as an internal control. Data were normalized by control samples.
Glucose uptake
100μl 1mM 2-NDBG (Life technologies) was added both on top and below stage 11 to 12 HH chicken embryos and incubated at 38 °C for 2 h in EC culture. After culture, embryos were fixed in 4% PFA for 20 min, and then washed with PBS for 5 min at least 3 times. Images were captured using a laser scanning confocal microscope (TCS SP5; Leica) or macroscope (TCS LSI; Leica).
Image acquisition and processing
All fluorescent images were acquired on Leica SP5 or LSI systems. Images were processed with Imagej Fiji and Adobe Photoshop, and MAX projection images are shown in Figures. Whole mount in situ images were captured on Leica Z16 APOA systems and DFC 420C camera, and Images were processed with Adobe Photoshop. Scale bars were measured using Imagej Fiji for confocal images, and by referencing somite size of control embryos for in situ images.
Extracellular pH measurement
Stage 9HH embryos were incubated with and without 2DG in EC culture at 38 °C for 7 h. Next, embryos were transferred either to control plates (pH 9.6), 2DG-containing plates or alkaline plates (pH 11). Then 100μl 25μM pH sensitive dye (pHrodo Red intracellular pH Indicator: Lifetechnologies) was added both on top and below embryos, which were then incubated at 38 °C for 3 h. Embryos were then washed once in PBS, and mounted on MatTek glass-bottom dishes dorsal side up on a thin albumin agar layer (control, 2DG or Alkaline). Images were captured with a laser scanning confocal microscope (TCS SP5; Leica) at 37 °C in a humidified atmosphere. In this protocol, pH indicator was mainly trapped on extracellular matrix or cellular membrane regions, indicating that it measures the extracellular pH. After image capture, z-stacks (.lif) of individual embryos were rendered in FluoRender (Wan et al., 2012) to create maximum projection images centered on the midline of each embryo (cropped to leave ~400μm on each side of the midline). Intensities were measured on these images using the region of interest (ROI) and plot z-profile functionalities in ImageJ. Unpaired t-tests were applied when comparing average intensities between different experimental conditions. Paired t-tests were applied when comparing between regions the embryo.
QUANTIFICATION AND STATISTICAL ANALYSIS
Cell trajectory analysis
To study the motility of cells in the presomitic mesoderm, we analyzed cell trajectories in the posterior region of the PSM in an area of about 400 μm representing 1/3 of the PSM length, as shown schematically with a box in Figure 3 (G–I). Because of the small depth of the PSM with respect to its area, the motion of the cells can be considered two dimensional. From the trajectories of cells we obtain their time-averaged displacement, or the mean square displacement, given by: MSD = 〈Δr2 t〉, where defines the distance that the cell travels in a time t, known as the lag time. When the diffusive motion in coupled with a drifting flow, the MSD is given by
| (0) |
where D is the diffusion coefficient and v is the drift, related to the overall movement of the tissue (Qian et al., 1991). For each cell trajectory, the MSD is calculated and adjusted with Eq. (0) to obtain D. Cell tracking was performed on fluorescent images using the Mosaic plugin (MOSAIC Group, MPI-CBG, Dresden) for ImageJ (Sbalzarini and Koumoutsakos, 2005). Further analyses to extract D were done using custom made Matlab (MathWorks) routines.
Metabolome Statistical Analysis
Missing values (if any) are assumed to be below the level of detection. However, biochemicals that were detected in all samples from one or more groups but not in samples from other groups were assumed to be near the lower limit of detection in the groups in which they were not detected. In this case, the lowest detected level of these biochemicals was imputed for samples in which that biochemical was not detected. Following log transformation and imputation with minimum observed values for each compound, Welch’s two-sample t-test was used to identify biochemicals that differed significantly between experimental groups. Pathways were assigned for each metabolite, allowing examination of overrepresented pathways. Hierarchical clustering analysis was performed using Pearson correlation coefficient with the MeV 4.9 (TM4) software.
Other Statistical Analyses
Statistical significance for the comparisons between two groups of data (Table S1, 2, Figure 3G, 6D), were assessed with unpaired two-tailed student t-test. Statistical significance for multiple groups comparison, (Figure 1 E–G, 2E–G, 3 D–F, 4 A–C, K–L, Figure S6), were performed with one-way ANOVA and Tukey multiple comparison tests using GraphPad 6 (Prism).
DATA AND SOFTWARE AVAILABILITY
Chicken embryos microarray data described in this paper have been deposited in GEOMNIBUS under accession code GSE75798.
Supplementary Material
HIGHLIGHTS.
Identification of a glycolysis gradient in the embryo tail bud
FGF signaling controls the transcription of glycolytic enzymes in the tail bud
Glycolysis inhibition reduces cell motility and slows down axis elongation
Glycolysis is required to maintain Wnt signaling and neuro-mesodermal fate
Acknowledgments
We thank members of the Pourquié laboratory and Michel Labouesse, Norbert Perrimon, Alexander Aulehla and Cliff Tabin for discussions and comments on the manuscript. We are grateful to Bertrand Bénazéraf, Alexis Hubaud, Nicolas Denans, and Aurélie Krol for assistance with some chicken embryo experiments. We thank members of IGBMC imaging and microarray facility, and Jean Marie Garnier for plasmid construction. This work was supported by an advanced grant of the European Research Council, an NIH RO1 grant 11955884 to OP and a grant of the Fondation pour la Recherche Médicale (SPF20120523860) to MO. F.X. was supported by a HHMI-HHWF fellowship. Microarrays data were deposited in GEO database under the accession number of GSE39613 for Mouse and GSE75798 for chicken. EDK is an employee of Metabolon Inc., a fee-for-service metabolomics provider.
Footnotes
Publisher's Disclaimer: This is a PDF file of an unedited manuscript that has been accepted for publication. As a service to our customers we are providing this early version of the manuscript. The manuscript will undergo copyediting, typesetting, and review of the resulting proof before it is published in its final citable form. Please note that during the production process errors may be discovered which could affect the content, and all legal disclaimers that apply to the journal pertain.
Authors’ contributions: M.O. designed, performed and analyzed the experiments with O.P.. E.K. supervised the metabolomic analysis. P. M. analyzed the microarray data. J.C. generated the anti-CMESPO antibody. K.G. and F. X. analyzed the imaging data. M.O. and O.P. wrote the manuscript and O.P. supervised the project. All authors discussed and agreed on the results and commented on the manuscript.
References
- Agathocleous M, Love NK, Randlett O, Harris JJ, Liu J, Murray AJ, Harris WA. Metabolic differentiation in the embryonic retina. Nat Cell Biol. 2012;14:859–864. doi: 10.1038/ncb2531. [DOI] [PMC free article] [PubMed] [Google Scholar]
- Aulehla A, Pourquie O. Signaling gradients during paraxial mesoderm development. Cold Spring Harb Perspect Biol. 2010;2:a000869. doi: 10.1101/cshperspect.a000869. [DOI] [PMC free article] [PubMed] [Google Scholar]
- Aulehla A, Wehrle C, Brand-Saberi B, Kemler R, Gossler A, Kanzler B, Herrmann BG. Wnt3a plays a major role in the segmentation clock controlling somitogenesis. Dev Cell. 2003;4:395–406. doi: 10.1016/s1534-5807(03)00055-8. [DOI] [PubMed] [Google Scholar]
- Aulehla A, Wiegraebe W, Baubet V, Wahl MB, Deng C, Taketo M, Lewandoski M, Pourquie O. A beta-catenin gradient links the clock and wavefront systems in mouse embryo segmentation. Nat Cell Biol. 2008;10:186–193. doi: 10.1038/ncb1679. [DOI] [PMC free article] [PubMed] [Google Scholar]
- Benazeraf B, Francois P, Baker RE, Denans N, Little CD, Pourquie O. A random cell motility gradient downstream of FGF controls elongation of an amniote embryo. Nature. 2010;466:248–252. doi: 10.1038/nature09151. [DOI] [PMC free article] [PubMed] [Google Scholar]
- Benazeraf B, Pourquie O. Formation and segmentation of the vertebrate body axis. Annu Rev Cell Dev Biol. 2013;29:1–26. doi: 10.1146/annurev-cellbio-101011-155703. [DOI] [PubMed] [Google Scholar]
- Brinster RL. Studies on the Development of Mouse Embryos in Vitro. Ii. The Effect of Energy Source. J Exp Zool. 1965;158:59–68. doi: 10.1002/jez.1401580106. [DOI] [PMC free article] [PubMed] [Google Scholar]
- Buchberger A, Bonneick S, Arnold H. Expression of the novel basic-helix-loop-helix transcription factor cMespo in presomitic mesoderm of chicken embryos. Mech Dev. 2000;97:223–226. doi: 10.1016/s0925-4773(00)00424-x. [DOI] [PubMed] [Google Scholar]
- Buchberger A, Seidl K, Klein C, Eberhardt H, Arnold HH. cMeso-1, a novel bHLH transcription factor, is involved in somite formation in chicken embryos. Dev Biol. 1998;199:201–215. doi: 10.1006/dbio.1998.8919. [DOI] [PubMed] [Google Scholar]
- Chal J, Oginuma M, Al Tanoury Z, Gobert B, Sumara O, Hick A, Bousson F, Zidouni Y, Mursch C, Moncuquet P, et al. Differentiation of pluripotent stem cells to muscle fiber to model Duchenne muscular dystrophy. Nat Biotechnol. 2015;33:962–969. doi: 10.1038/nbt.3297. [DOI] [PubMed] [Google Scholar]
- Chapman DL, Papaioannou VE. Three neural tubes in mouse embryos with mutations in the T-box gene Tbx6. Nature. 1998;391:695–697. doi: 10.1038/35624. [DOI] [PubMed] [Google Scholar]
- Chapman SC, Collignon J, Schoenwolf GC, Lumsden A. Improved method for chick whole-embryo culture using a filter paper carrier. Dev Dyn. 2001;220:284–289. doi: 10.1002/1097-0177(20010301)220:3<284::AID-DVDY1102>3.0.CO;2-5. [DOI] [PubMed] [Google Scholar]
- Clough JR, Whittingham DG. Metabolism of [14C]glucose by postimplantation mouse embryos in vitro. J Embryol Exp Morphol. 1983;74:133–142. [PubMed] [Google Scholar]
- Crossley PH, Martin GR. The mouse Fgf8 gene encodes a family of polypeptides and is expressed in regions that direct outgrowth and patterning in the developing embryo. Development. 1995;121:439–451. doi: 10.1242/dev.121.2.439. [DOI] [PubMed] [Google Scholar]
- Cruciat CM, Ohkawara B, Acebron SP, Karaulanov E, Reinhard C, Ingelfinger D, Boutros M, Niehrs C. Requirement of prorenin receptor and vacuolar H+-ATPase-mediated acidification for Wnt signaling. Science. 2010;327:459–463. doi: 10.1126/science.1179802. [DOI] [PubMed] [Google Scholar]
- De Bock K, Georgiadou M, Schoors S, Kuchnio A, Wong BW, Cantelmo AR, Quaegebeur A, Ghesquiere B, Cauwenberghs S, Eelen G, et al. Role of PFKFB3-driven glycolysis in vessel sprouting. Cell. 2013;154:651–663. doi: 10.1016/j.cell.2013.06.037. [DOI] [PubMed] [Google Scholar]
- Dechant R, Binda M, Lee SS, Pelet S, Winderickx J, Peter M. Cytosolic pH is a second messenger for glucose and regulates the PKA pathway through V-ATPase. EMBO J. 2010;29:2515–2526. doi: 10.1038/emboj.2010.138. [DOI] [PMC free article] [PubMed] [Google Scholar]
- Dehaven CD, Evans AM, Dai H, Lawton KA. Organization of GC/MS and LC/MS metabolomics data into chemical libraries. J Cheminform. 2010;2:9. doi: 10.1186/1758-2946-2-9. [DOI] [PMC free article] [PubMed] [Google Scholar]
- Denans N, Iimura T, Pourquie O. Hox genes control vertebrate body elongation by collinear Wnt repression. eLife. 2015;4 doi: 10.7554/eLife.04379. [DOI] [PMC free article] [PubMed] [Google Scholar]
- Esen E, Chen J, Karner CM, Okunade AL, Patterson BW, Long F. WNT-LRP5 signaling induces Warburg effect through mTORC2 activation during osteoblast differentiation. Cell Metab. 2013;17:745–755. doi: 10.1016/j.cmet.2013.03.017. [DOI] [PMC free article] [PubMed] [Google Scholar]
- Evans AM, DeHaven CD, Barrett T, Mitchell M, Milgram E. Integrated, nontargeted ultrahigh performance liquid chromatography/electrospray ionization tandem mass spectrometry platform for the identification and relative quantification of the small-molecule complement of biological systems. Analytical chemistry. 2009;81:6656–6667. doi: 10.1021/ac901536h. [DOI] [PubMed] [Google Scholar]
- Gardner DK. Lactate production by the mammalian blastocyst: manipulating the microenvironment for uterine implantation and invasion? Bioessays. 2015;37:364–371. doi: 10.1002/bies.201400155. [DOI] [PMC free article] [PubMed] [Google Scholar]
- Gomez C, Ozbudak EM, Wunderlich J, Baumann D, Lewis J, Pourquie O. Control of segment number in vertebrate embryos. Nature. 2008;454:335–339. doi: 10.1038/nature07020. [DOI] [PubMed] [Google Scholar]
- Greco TL, Takada S, Newhouse MM, McMahon JA, McMahon AP, Camper SA. Analysis of the vestigial tail mutation demonstrates that Wnt-3a gene dosage regulates mouse axial development. Genes Dev. 1996;10:313–324. doi: 10.1101/gad.10.3.313. [DOI] [PubMed] [Google Scholar]
- Hamburger V, Hamilton HL. A series of normal stages in the development of the chick embryo (1951) Dev Dyn. 1992;195:231–272. doi: 10.1002/aja.1001950404. [DOI] [PubMed] [Google Scholar]
- Henrique D, Abranches E, Verrier L, Storey KG. Neuromesodermal progenitors and the making of the spinal cord. Development. 2015;142:2864–2875. doi: 10.1242/dev.119768. [DOI] [PMC free article] [PubMed] [Google Scholar]
- Henrique D, Adam J, Myat A, Chitnis A, Lewis J, Ish-Horowicz D. Expression of a Delta homologue in prospective neurons in the chick. Nature. 1995;375:787–790. doi: 10.1038/375787a0. [DOI] [PubMed] [Google Scholar]
- Hubaud A, Pourquie O. Signalling dynamics in vertebrate segmentation. Nat Rev Mol Cell Biol. 2014;15:709–721. doi: 10.1038/nrm3891. [DOI] [PubMed] [Google Scholar]
- Itoh Y, Abe T, Takaoka R, Tanahashi N. Fluorometric determination of glucose utilization in neurons in vitro and in vivo. J Cereb Blood Flow Metab. 2004;24:993–1003. doi: 10.1097/01.WCB.0000127661.07591.DE. [DOI] [PubMed] [Google Scholar]
- Johnson MT, Mahmood S, Patel MS. Intermediary metabolism and energetics during murine early embryogenesis. J Biol Chem. 2003;278:31457–31460. doi: 10.1074/jbc.R300002200. [DOI] [PubMed] [Google Scholar]
- Kimelman D. Tales of Tails (and Trunks): Forming the Posterior Body in Vertebrate Embryos. Curr Top Dev Biol. 2016;116:517–536. doi: 10.1016/bs.ctdb.2015.12.008. [DOI] [PMC free article] [PubMed] [Google Scholar]
- Knezevic V, De Santo R, Mackem S. Two novel chick T-box genes related to mouse Brachyury are expressed in different, non-overlapping mesodermal domains during gastrulation. Development. 1997;124:411–419. doi: 10.1242/dev.124.2.411. [DOI] [PubMed] [Google Scholar]
- Krol AJ, Roellig D, Dequeant ML, Tassy O, Glynn E, Hattem G, Mushegian A, Oates AC, Pourquie O. Evolutionary plasticity of segmentation clock networks. Development. 2011;138:2783–2792. doi: 10.1242/dev.063834. [DOI] [PMC free article] [PubMed] [Google Scholar]
- McGrew MJ, Dale JK, Fraboulet S, Pourquie O. The lunatic fringe gene is a target of the molecular clock linked to somite segmentation in avian embryos. Curr Biol. 1998;8:979–982. doi: 10.1016/s0960-9822(98)70401-4. [DOI] [PubMed] [Google Scholar]
- McGrew MJ, Sherman A, Ellard FM, Lillico SG, Gilhooley HJ, Kingsman AJ, Mitrophanous KA, Sang H. Efficient production of germline transgenic chickens using lentiviral vectors. EMBO Rep. 2004;5:728–733. doi: 10.1038/sj.embor.7400171. [DOI] [PMC free article] [PubMed] [Google Scholar]
- Minowada G, Jarvis LA, Chi CL, Neubuser A, Sun X, Hacohen N, Krasnow MA, Martin GR. Vertebrate Sprouty genes are induced by FGF signaling and can cause chondrodysplasia when overexpressed. Development. 1999;126:4465–4475. doi: 10.1242/dev.126.20.4465. [DOI] [PubMed] [Google Scholar]
- Moussaieff A, Rouleau M, Kitsberg D, Cohen M, Levy G, Barasch D, Nemirovski A, Shen-Orr S, Laevsky I, Amit M, et al. Glycolysis-mediated changes in acetyl-CoA and histone acetylation control the early differentiation of embryonic stem cells. Cell Metab. 2015;21:392–402. doi: 10.1016/j.cmet.2015.02.002. [DOI] [PubMed] [Google Scholar]
- Naiche LA, Holder N, Lewandoski M. FGF4 and FGF8 comprise the wavefront activity that controls somitogenesis. Proc Natl Acad Sci U S A. 2011;108:4018–4023. doi: 10.1073/pnas.1007417108. [DOI] [PMC free article] [PubMed] [Google Scholar]
- Nguyen TN, Wang HJ, Zalzal S, Nanci A, Nabi IR. Purification and characterization of beta-actin-rich tumor cell pseudopodia: role of glycolysis. Exp Cell Res. 2000;258:171–183. doi: 10.1006/excr.2000.4929. [DOI] [PubMed] [Google Scholar]
- Nowotschin S, Ferrer-Vaquer A, Concepcion D, Papaioannou VE, Hadjantonakis AK. Interaction of Wnt3a, Msgn1 and Tbx6 in neural versus paraxial mesoderm lineage commitment and paraxial mesoderm differentiation in the mouse embryo. Dev Biol. 2012;367:1–14. doi: 10.1016/j.ydbio.2012.04.012. [DOI] [PMC free article] [PubMed] [Google Scholar]
- Ogawa M, Kosaka N, Regino CA, Mitsunaga M, Choyke PL, Kobayashi H. High sensitivity detection of cancer in vivo using a dual-controlled activation fluorescent imaging probe based on H-dimer formation and pH activation. Molecular bioSystems. 2010;6:888–893. doi: 10.1039/b917876g. [DOI] [PMC free article] [PubMed] [Google Scholar]
- Okada A, Lansford R, Weimann JM, Fraser SE, McConnell SK. Imaging cells in the developing nervous system with retrovirus expressing modified green fluorescent protein. Exp Neurol. 1999;156:394–406. doi: 10.1006/exnr.1999.7033. [DOI] [PubMed] [Google Scholar]
- Olivera-Martinez I, Harada H, Halley PA, Storey KG. Loss of FGF-dependent mesoderm identity and rise of endogenous retinoid signalling determine cessation of body axis elongation. PLoS Biol. 2012;10:e1001415. doi: 10.1371/journal.pbio.1001415. [DOI] [PMC free article] [PubMed] [Google Scholar]
- Ozbudak EM, Tassy O, Pourquie O. Spatiotemporal compartmentalization of key physiological processes during muscle precursor differentiation. Proc Natl Acad Sci U S A. 2010;107:4224–4229. doi: 10.1073/pnas.0909375107. [DOI] [PMC free article] [PubMed] [Google Scholar]
- Papaconstantinou J. Metabolic control of growth and differentiation in vertebrate embryos. In: Weber R, editor. The Biochemistry of Animal Development. New York and London: Academic Press; 1967. pp. 57–113. [Google Scholar]
- Parks SK, Chiche J, Pouyssegur J. Disrupting proton dynamics and energy metabolism for cancer therapy. Nature reviews. 2013;13:611–623. doi: 10.1038/nrc3579. [DOI] [PubMed] [Google Scholar]
- Primmett DR, Norris WE, Carlson GJ, Keynes RJ, Stern CD. Periodic segmental anomalies induced by heat shock in the chick embryo are associated with the cell cycle. Development. 1989;105:119–130. doi: 10.1242/dev.105.1.119. [DOI] [PubMed] [Google Scholar]
- Qian H, Sheetz MP, Elson EL. Single particle tracking. Analysis of diffusion and flow in two-dimensional systems. Biophys J. 1991;60:910–921. doi: 10.1016/S0006-3495(91)82125-7. [DOI] [PMC free article] [PubMed] [Google Scholar]
- Reitman ZJ, Jin G, Karoly ED, Spasojevic I, Yang J, Kinzler KW, He Y, Bigner DD, Vogelstein B, Yan H. Profiling the effects of isocitrate dehydrogenase 1 and 2 mutations on the cellular metabolome. Proc Natl Acad Sci U S A. 2011;108:3270–3275. doi: 10.1073/pnas.1019393108. [DOI] [PMC free article] [PubMed] [Google Scholar]
- Sbalzarini IF, Koumoutsakos P. Feature point tracking and trajectory analysis for video imaging in cell biology. Journal of structural biology. 2005;151:182–195. doi: 10.1016/j.jsb.2005.06.002. [DOI] [PubMed] [Google Scholar]
- Shepard TH, Tanimura T, Park HW. Glucose absorption and utilization by rat embryos. Int J Dev Biol. 1997;41:307–314. [PubMed] [Google Scholar]
- Shyh-Chang N, Daley GQ, Cantley LC. Stem cell metabolism in tissue development and aging. Development. 2013;140:2535–2547. doi: 10.1242/dev.091777. [DOI] [PMC free article] [PubMed] [Google Scholar]
- Sparrow DB, Chapman G, Smith AJ, Mattar MZ, Major JA, O’Reilly VC, Saga Y, Zackai EH, Dormans JP, Alman BA, et al. A mechanism for gene-environment interaction in the etiology of congenital scoliosis. Cell. 2012;149:295–306. doi: 10.1016/j.cell.2012.02.054. [DOI] [PubMed] [Google Scholar]
- Spratt NT., Jr Development of the early chick blastoderm on synthetic media. J Exp Zool. 1948;107:39–64. doi: 10.1002/jez.1401070103. [DOI] [PubMed] [Google Scholar]
- Takemoto T, Uchikawa M, Yoshida M, Bell DM, Lovell-Badge R, Papaioannou VE, Kondoh H. Tbx6-dependent Sox2 regulation determines neural or mesodermal fate in axial stem cells. Nature. 2011;470:394–398. doi: 10.1038/nature09729. [DOI] [PMC free article] [PubMed] [Google Scholar]
- Tzouanacou E, Wegener A, Wymeersch FJ, Wilson V, Nicolas JF. Redefining the progression of lineage segregations during mammalian embryogenesis by clonal analysis. Dev Cell. 2009;17:365–376. doi: 10.1016/j.devcel.2009.08.002. [DOI] [PubMed] [Google Scholar]
- Vander Heiden MG, Cantley LC, Thompson CB. Understanding the Warburg effect: the metabolic requirements of cell proliferation. Science. 2009;324:1029–1033. doi: 10.1126/science.1160809. [DOI] [PMC free article] [PubMed] [Google Scholar]
- Venters SJ, Hultner ML, Ordahl CP. Somite cell cycle analysis using somite-staging to measure intrinsic developmental time. Dev Dyn. 2008;237:377–392. doi: 10.1002/dvdy.21424. [DOI] [PubMed] [Google Scholar]
- Wales RG, Martin KL, Leese HJ. Glucose utilization by components of the mouse conceptus during early embryogenesis. Journal of reproduction and fertility. 1995;104:125–132. doi: 10.1530/jrf.0.1040125. [DOI] [PubMed] [Google Scholar]
- Wittler L, Shin EH, Grote P, Kispert A, Beckers A, Gossler A, Werber M, Herrmann BG. Expression of Msgn1 in the presomitic mesoderm is controlled by synergism of WNT signalling and Tbx6. EMBO Rep. 2007;8:784–789. doi: 10.1038/sj.embor.7401030. [DOI] [PMC free article] [PubMed] [Google Scholar]
- Yamaguchi TP, Takada S, Yoshikawa Y, Wu N, McMahon AP. T (Brachyury) is a direct target of Wnt3a during paraxial mesoderm specification. Genes Dev. 1999;13:3185–3190. doi: 10.1101/gad.13.24.3185. [DOI] [PMC free article] [PubMed] [Google Scholar]
- Yoshioka K, Takahashi H, Homma T, Saito M, Oh KB, Nemoto Y, Matsuoka H. A novel fluorescent derivative of glucose applicable to the assessment of glucose uptake activity of Escherichia coli. Biochim Biophys Acta. 1996;1289:5–9. doi: 10.1016/0304-4165(95)00153-0. [DOI] [PubMed] [Google Scholar]
Associated Data
This section collects any data citations, data availability statements, or supplementary materials included in this article.