

Abstract
Background:
The existing evidence indicates increased levels of transforming growth factor beta 1 (TGF-β1) in patients with type 2 diabetes mellitus (T2DM) and those with type 2 diabetic nephropathy (T2DN); yet no meta-analysis displays a reliable result. Here we conducted a meta-analysis to evaluate characteristic changes of TGF-β1 in T2DM and diabetic nephropathy.
Methods:
A systematic search was conducted for eligible studies, which reported the association of TGF-β1 withT2DM and T2DN patients, in PubMed, Wangfang, Chinese-Cqvip, and China National Knowledge Infrastructure database, from February 1, 1991 to December 15, 2015. The association of serum and urine TGF-β1 in T2DM and T2DN patients should be evaluated in case-control studies. The Newcastle-Ottawa Scale was used to access the quality of the included studies, and pooling data were synthesized as standard mean difference (SMD) and 95% confidence interval (CI). The collected data were synthesized according to Cochrane Handbook for Systematic Reviews criteria. Subgroup analysis was conducted by albuminuria and ethnicity. Regression analysis and sensitivity analysis were used to explore the sources of heterogeneity. Publication bias was judged by the Egger test.
Results:
Sixty-three case-control studies of 364 T2DM patients (1604 T2DN patients) and 2100 healthy controls were included for meta-analysis. Compared with the controls, the cases had increased TGF-β1 levels in both serum (T2DM: SMD 1.78 μg/L; 95% CI 0.98–2.59, P < .001; T2DN: SMD 4.70 μg/L, 95% CI 3.55–5.85, P < .001) and urine samples (T2DM: SMD 1.27 pg/mg.creatinine, 95% CI 0.16–2.38, P < .001; SMD 1.19 ng/L, 95% CI 0.77–1.62, P < .001; T2DN: SMD 3.14 pg/mg.creatinine, 95% CI 2.15–4.13, P < .001; SMD 4.50 ng/L, 95% CI 3.16–5.83, P < .001). The increase of serum TGF-β1 persisted in patients with either microalbuminuria or macroalbuminuria (all P < .001) in Chinese and non-Chinese population. High heterogeneity exists in some comparisons and small-sample studies.
Conclusions:
Patients with T2DM and those with albuminuria, Chinese or non-Chinese, had increased serum and urine TGF-β1 levels.
Keywords: case-control study, diabetic nephropathy, meta-analysis, transforming growth factor beta 1, type 2 diabetes mellitus
1. Introduction
The prevalence of type 2 diabetes mellitus (T2DM) and diabetic nephropathy (DN) is growing rapidly worldwide, posing potential economic burden for every family and country.[1,2] Despite advances in care over the past 20 years, DN remains the single largest cause of patients with renal failure, and additional therapeutic approaches beyond glycemic and hypertensive control should be employed to reduce the rate of progression of nephropathy.[3] More innovative strategies are needed to prevent and treat DN. In fact, several clinical trials are disappointing.[4–6] Thus, searching for novel biomarkers for early diagnosis and effective therapy is ongoing.[7] Meanwhile, identification of early biomarkers for DN may pave the way to the insight of novel mechanisms of diabetic renal damage.[7]
Several studies have suggested that intrinsic renal cells are able to produce the inflammatory cytokines and growth factors such as transforming growth factor beta 1 (TGF-β1) in the progression of DN.[8] As a fibrogenic cytokine, TGF-β1 is considered a key mediator in DN.[9] Recent evidences suggest that TGF-β1 is involved in the pathogenesis of DN, because of its prosclerotic properties.[10] TGF-β1 is a multifunctional cytokine circulating in a biologically inactive form in human plasma.[11] Among its many actions, regulation of cell proliferation and extracellular matrix production appears prominent. Excessive production of TGF-β1 is thought to occur in fibrosis of the kidney, liver, skin, and other organs.[12]
Although clinical studies have revealed the association between TGF-β1 and nephropathy in T2DM, results of the changes in TGF-β1 are often conflicting.[13–17] Previously, our work[18] has proved TGF-β1 was lower expressed in T1DM patients. Because of the existed and inconsistent ideas, we conducted this meta-analysis, synthesizing the data from case-control studies to evaluate changes of TGF-β1 level in T2DM and T2DN patients, and judge that whether TGF-β1 could be as a potential prognostic marker for DM or DN.
2. Methods
2.1. Study identification and search strategy
Our study was conducted according to the Preferred Reporting Items for Systematic Reviews and Meta-analyses (PRISMA)[19] and Cochrane Handbook for Systematic Reviews criteria. Ethical approval was obtained from the Ethics Committee of Guilin Medical University. A systematic search was conducted for eligible studies which discussed the association between TGF-β1 and T2DM or T2DN patients from PubMed, Wangfang database, Chinese-Cqvip, and China National Knowledge Infrastructure (CNKI) database from February 1, 1991 to December 15, 2015. The search terms used were: (“transforming growth factor beta” or “TGF-β1”) and (“type 2 diabetes” or “type 2 diabetic nephropathy” or “diabetic nephropathy” or “diabetic renal disease” or “T2DM” or “T2DN” or “DN” or “DM”). In addition, we also conducted an extensive literature search such as Baidu and Google; articles were further hand-searched in reference lists.
2.2. Inclusion criteria
All relevant articles were reviewed and studies meeting all the following criteria were included: the study should evaluate the association about total TGF-β1 with T2DM or T2DN patients; there had to be at least 2 comparison groups (case group vs control group); original data displayed as mean ± SD; and original report but not duplicated data.
2.3. Quality assessment and data extraction
The data were extracted independently by 2 reviewers (Y.-C.Q. and J.S.) by using predefined data extraction forms, and the quality of all eligible studies was evaluated according to the Newcastle-Ottawa Scale (NOS).[20] The NOS was developed to assess the quality of nonrandomized studies with its design, content, and ease of use directed to the task of incorporating the quality assessments in the interpretation of meta-analytic results. A “star system” has been developed in which a study is judged on 3 broad perspectives: the selection of the study groups; the comparability of the groups; and the ascertainment of either the exposure or outcome of interest for case-control or cohort studies, respectively.[20] The following information was extracted: name of the first author; date of publication; country of the study; study design; sample size of patients and controls; mean age of the sample; mean ± SD of serum and urinary TGF-β1 level about T2DM or T2DN patients and controls. A third investigator (H.-L.Z.) was invited to assess such articles in case of disagreement, and the disagreements were resolved through discussion.
2.4. Statistical analysis
The data (sample size, mean ± SD) collected was used to value the association about TGF-β1 in T2DN or T2DM versus healthy controls. Heterogeneity was assessed with Cochran Q statistic test, and P < .10 was considered evidence of significant heterogeneity.[21] Heterogeneity was quantified by I2 test (I2 = 0%–25%: no heterogeneity; I2 = 25%–50%: moderate heterogeneity; I2 = 50%–75%: large heterogeneity; and I2 = 75%–100%: extreme heterogeneity).[22] When P < .1 or I2 >50%, the heterogeneity was considered significant and random-effect model was used; otherwise fixed-effect model was used. According to the urinary albumin/creatinine ratio (UACR) (normoalbuminuria: UACR <30 mg/g; microalbuminuria: 30 mg/g ≤ UACR ≤ 300 mg/g; macroalbuminuria: UACR >300 mg/g) or urinary albumin excretion rate (UAER) (normoalbuminuria: UAER <20 μg/min; microalbuminuria: 20 μg/min ≤ UAER ≤ 200 μg/min; macroalbuminuria: UAER >200 μg/min), DN was defined as microalbuminuria and macroalbuminuria which was used for subgroup analysis. Otherwise, according to the ethnic, patients were divided into 2 groups (Chinese and non-Chinese) for subgroup analysis. Regression analysis is also an important method for exploring sources of heterogeneity. We performed sensitivity analysis by excluding some 1 study step by step, or by limiting the studies of NOS score ≥7 or excluding the obvious bias studies. Publication bias was examined graphically by constructing an Egger test (P < .05 was considered representative of statistically significant publication bias).[23] Stata 12.0 software was performed in this meta-analysis.
3. Results
3.1. The process and results of selection
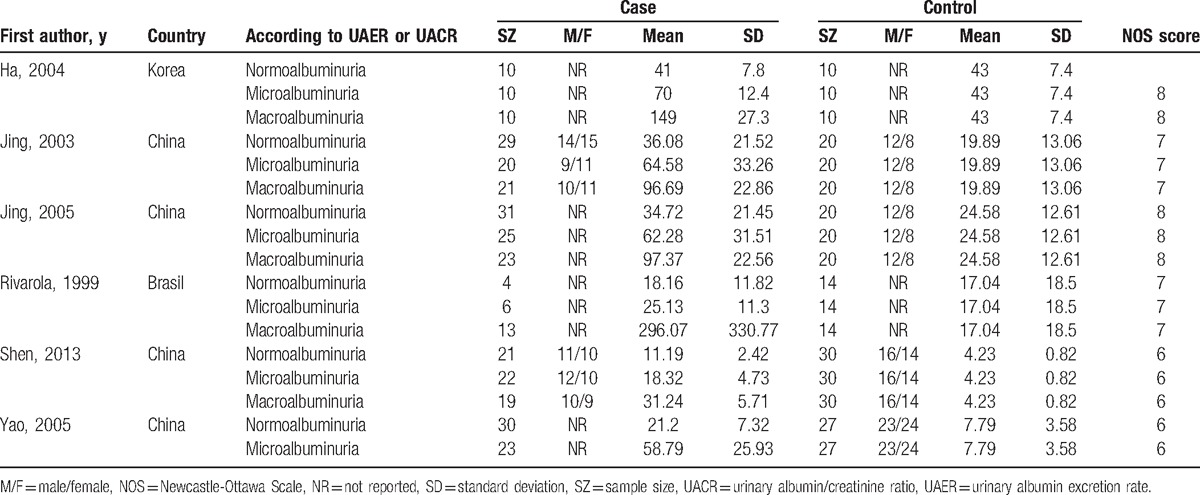
Figure 1 displays the flow chart of the literature search and inclusion process. Based on the search strategy, a total of 437 articles were collected. Eventually, 26 reports of 63 case-control studies (21 studies of 364 T2DM patients, 42 studies of 1604 T2DN patients, and 2100 healthy controls) were included. The unit of the measurement was μg/L for serum TGF-β1 in 15 articles,[7,13–15,24–34] pg/mg.creatinine for urinary TGF-β1 in 6 articles,[16,28,35–38] and ng/L for urinary TGF-β1 in 5 articles.[39–43] The demographic characteristics of the 26 included studies were listed in Tables 1–3. NOS results showed high methodological quality.
Figure 1.
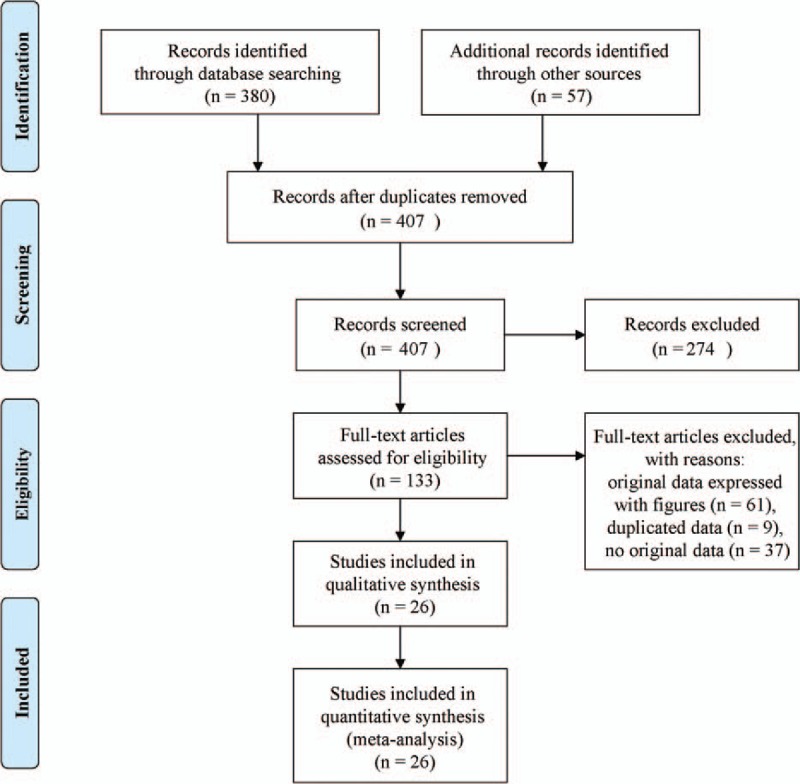
A flow chart of the article search and inclusion process.
Table 1.
Characteristics of studies about serum TGF-β1 level (μg/L) included in this meta-analysis.
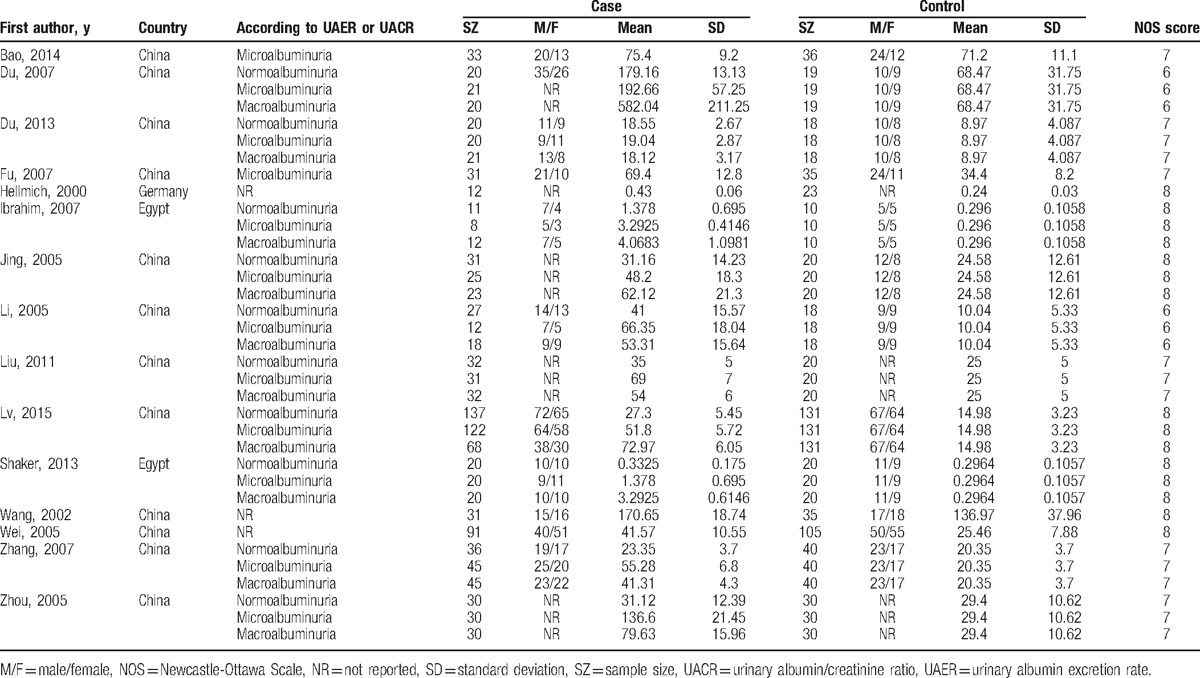
Table 3.
Characteristics of studies about urinary TGF-β1 level (ng/L) included in this meta-analysis.
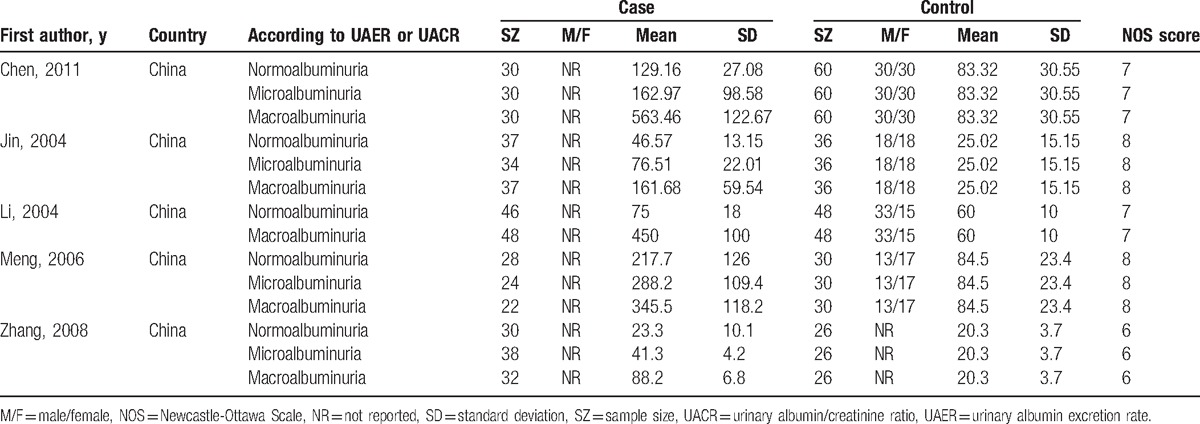
Table 2.
Characteristics of studies about urinary TGF-β1 level (pg/mg.creatinine) included in this meta-analysis.
3.2. Meta-analysis results
The results of pooling analysis displayed that compared with the controls, the DM and DN patients had both increased TGF-β1 levels in serum (μg/L) (DM: SMD 1.78, 95% CI .98–2.59, P < .001; DN: SMD 4.70, 95% CI 3.55–5.85, P < .001) and urine samples, expressed as pg/mg.creatinine (DM: SMD 1.27, 95% CI 0.16–2.38, P < .001; DN: SMD 3.14, 95% CI 2.15–4.13, P < .001) and as ng/L (DM: SMD 1.19, 95% CI 0.77–1.62, P < .001; DN: SMD 4.50, 95% CI 3.16–5.83, P < .001) (Figs. 2–5). All the results of this meta-analysis indicated that significant heterogeneity existed (P < .001).
Figure 2.
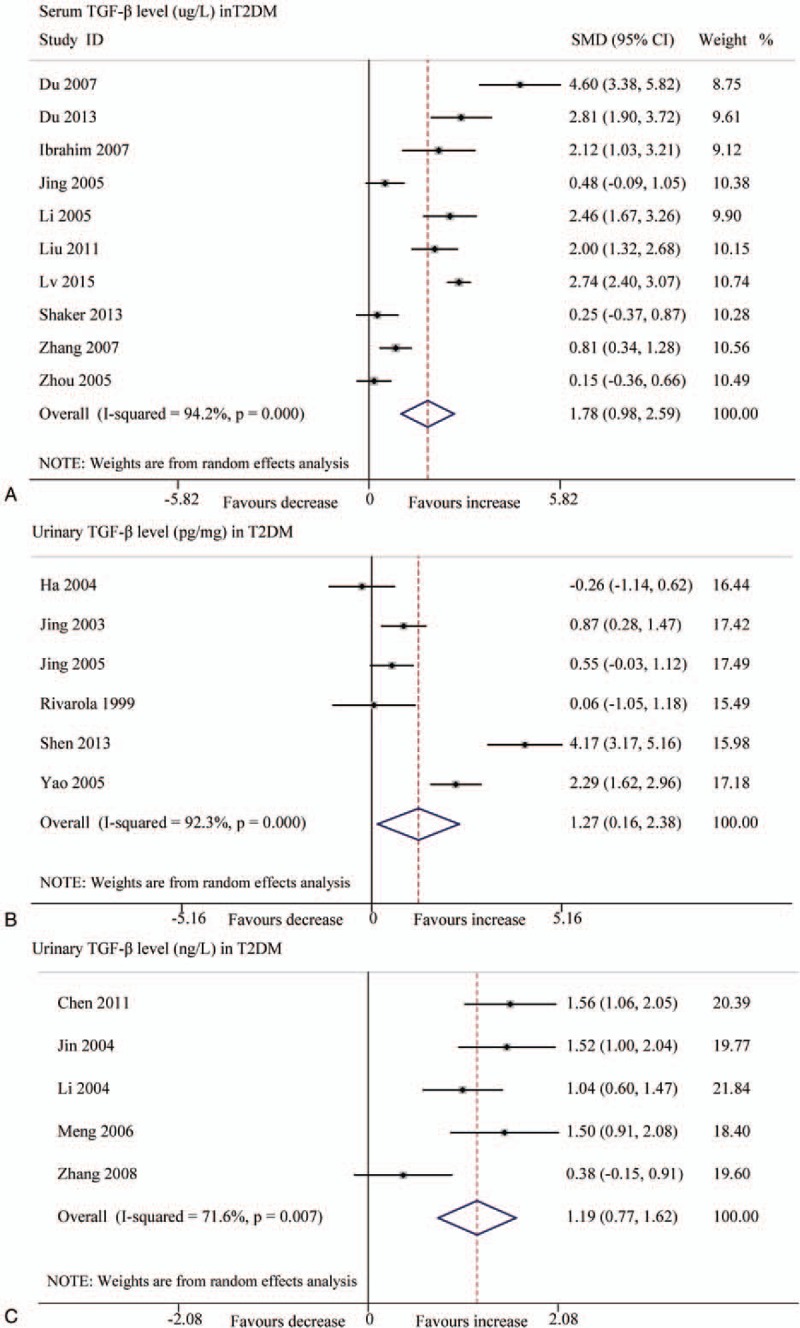
Forest plots for the level of TGF-β1 between T2DM patients and controls with random-effects model. (A) TGF-β1 level (μg/L) in serum (SMD 1.78, 95% CI 0.98–2.59, P < .001); (B) TGF-β1 level (pg/mg.creatinine) in urinary (SMD 1.27, 95% CI 0.16–2.38, P < .001); (C) TGF-β1 level (ng/L) in urinary (SMD 1.19, 95% CI 0.77–1.62, P < .001). CI = confidence interval, SMD = standard mean difference, T2DM = type 2 diabetes mellitus, TGF-β1 = transforming growth factor beta 1.
Figure 5.
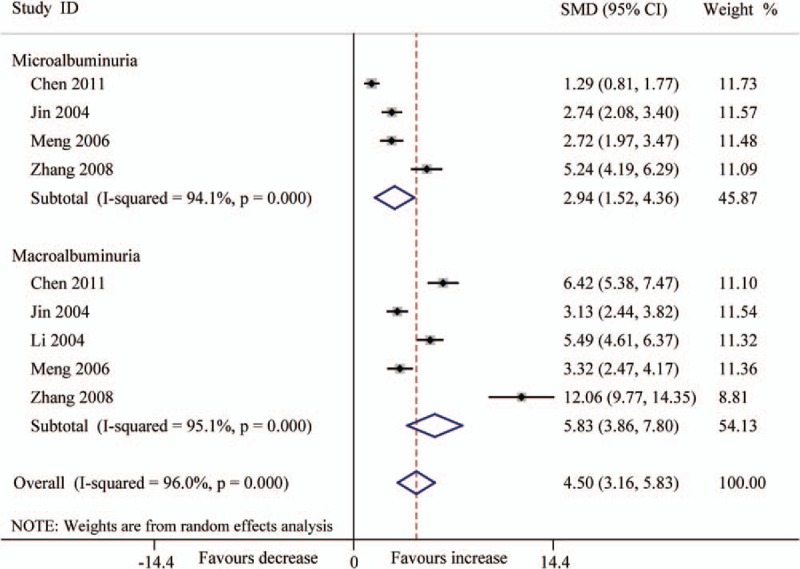
Forest plots for the level (ng/L) of urinary TGF-β1 between T2DN patients and controls with random-effects model. Microalbuminuria (SMD 2.94, 95% CI 1.52–4.36, P < .001), macroalbuminuria (SMD 5.83, 95% CI 3.86–7.80, P < .001), overall (SMD 4.50, 95% CI 3.16–5.83, P < .001). CI = confidence interval, SMD = standard mean difference, T2DN = type 2 diabetic nephropathy, TGF-β1 = transforming growth factor beta 1.
3.3. Subgroup analysis and regression analysis
In consideration of the influence about various levels of albuminuria in T2DN, we divided the patients into 2 groups (microalbuminuria and macroalbuminuria) according to UACR or UAER. The results indicated that the level of serum TGF-β1 was significantly increased in DN patients (microalbuminuria: SMD 4.45, 95% CI 2.87–6.04, P < .001; macroalbuminuria: SMD 5.00, 95% CI 3.31–6.69, P < .001) (Fig. 3). The level (pg/mg.creatinine) of urinary TGF-β1 also was significantly increased (microalbuminuria: SMD 2.27, 95% CI 1.27–3.27, P < .001; macroalbuminuria: SMD 4.33, 95% CI 2.30–6.36, P < .001) (Fig. 4), and also the level (ng/L) of urinary TGF-β1 (microalbuminuria: SMD 2.94, 95% CI 1.52–4.36, P < .001; macroalbuminuria: SMD 5.83, 95% CI 3.86–7.80, P < .001 (Fig. 5).
Figure 3.
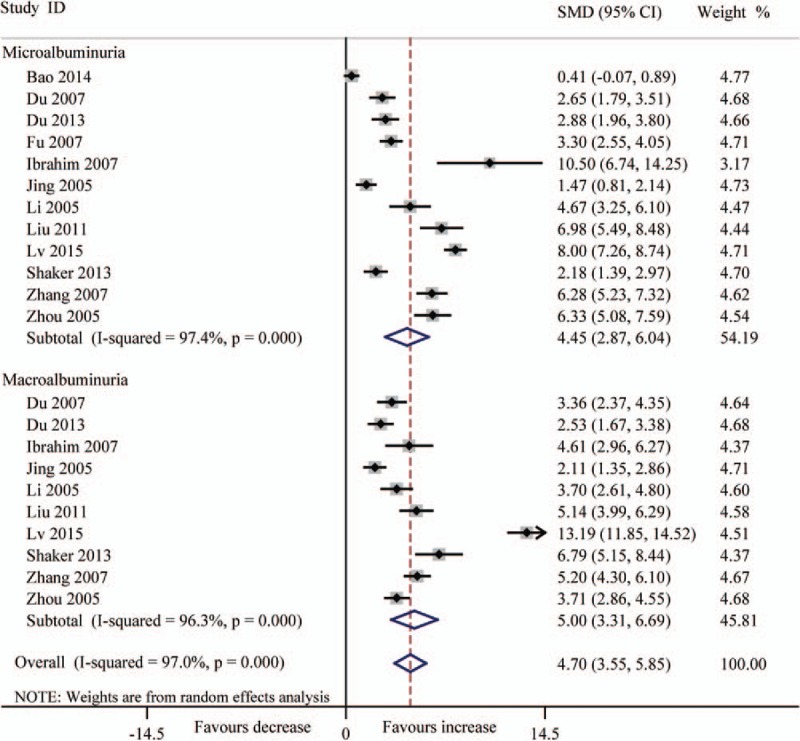
Forest plots for the level (μg/L) of serum TGF-β1 between T2DN patients and controls with random-effects model. Microalbuminuria (SMD 4.45, 95% CI 2.87–6.04, P < .001), macroalbuminuria (SMD 5.00, 95% CI 3.31–6.69, P < .001), overall (SMD 4.70, 95% CI 3.55–5.85, P < .001). CI = confidence interval, SMD = standard mean difference, T2DN = type 2 diabetic nephropathy, TGF-β1 = transforming growth factor beta 1.
Figure 4.
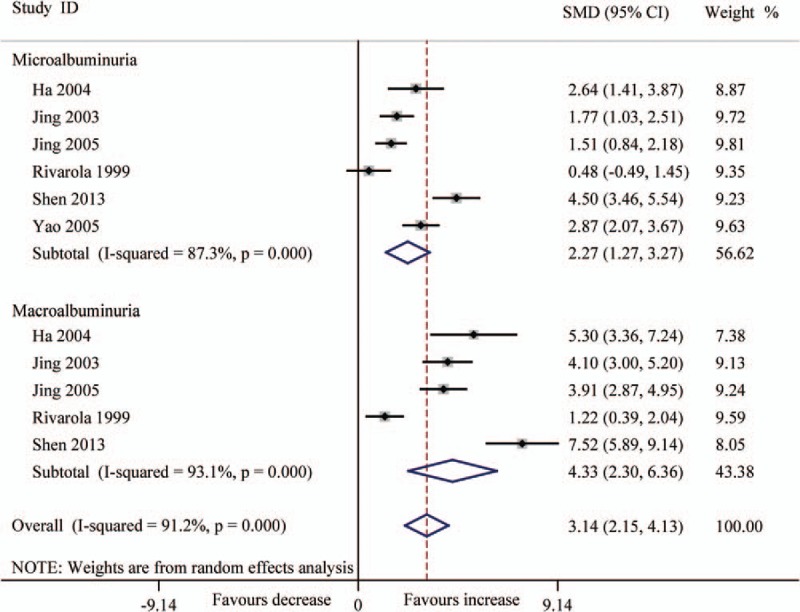
Forest plots for the level (pg/mg.creatinine) of urinary TGF-β1 between T2DN patients and controls with random-effects model. Microalbuminuria (SMD 2.27, 95% CI 1.27–3.27, P < .001), macroalbuminuria (SMD 4.33, 95% CI 2.30–6.36, P < .001), overall (SMD 3.14, 95% CI 2.15–4.13, P < .001). CI = confidence interval, SMD = standard mean difference, T2DN = type 2 diabetic nephropathy, TGF-β1 = transforming growth factor beta 1.
Because of the high heterogeneity, we performed subgroup analysis according to patients’ ethnicity, and found that the Chinese patients with microalbuminuria displayed both higher serum TGF-β1 level (μg/L) and urine TGF-β1 level (pg/mg and ng/L) (P < .001) (Figs. 6 and 7). In contrast, the non-Chinese patients with macroalbuminuria had increased TGF-β1 levels (SMD 5.71, 95% CI 3.57–7.84, P < .001) in serum, but not in urine (Figs. 6 and 7).
Figure 6.
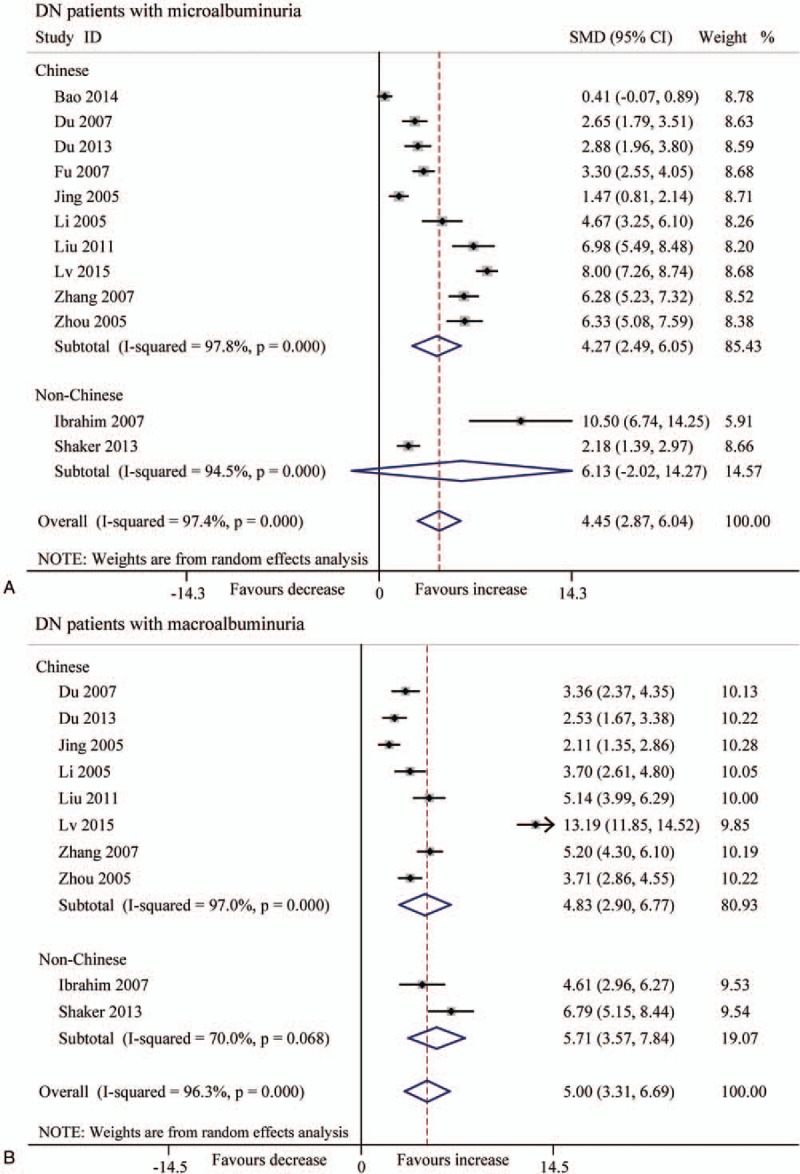
Forest plots for the level (μg/L) of serum TGF-β1 between T2DN patients and controls with random-effects model. (A) Microalbuminuria (Chinese: SMD 4.27, 95% CI 2.49 to 6.05, P < .001; non-Chinese: SMD 6.13, 95% CI −2.02 to 14.27, P = .140). (B) Macroalbuminuria (Chinese: SMD 4.83, 95% CI 2.90–6.77, P < .001; non-Chinese: SMD 5.71, 95% CI 3.57–7.84, P < .001). CI = confidence interval, SMD = standard mean difference, T2DN = type 2 diabetic nephropathy, TGF-β1 = transforming growth factor beta 1.
Figure 7.
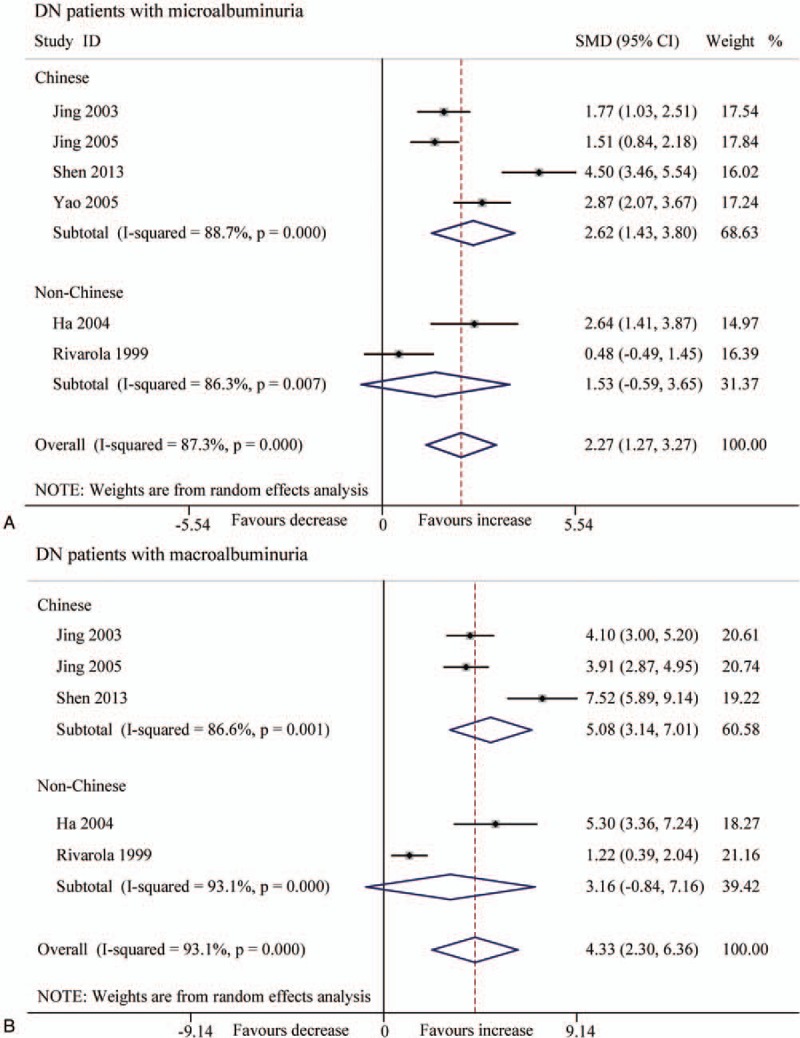
Forest plots for the level (pg/mg.creatinine) of urinary TGF-β1 between T2DN patients and controls with random-effects model. (A) Microalbuminuria (Chinese: SMD 2.62, 95% CI 1.43 to 3.80, P < .001; non-Chinese: SMD 1.53, 95% CI −0.59 to 3.65, P = .157). (B) Macroalbuminuria (Chinese: SMD 5.08, 95% CI 3.14 to 7.01, P < .001; non-Chinese: SMD 3.16, 95% CI −0.84 to 7.16, P = .121). CI = confidence interval, SMD = standard mean difference, T2DN = type 2 diabetic nephropathy, TGF-β1 = transforming growth factor beta 1.
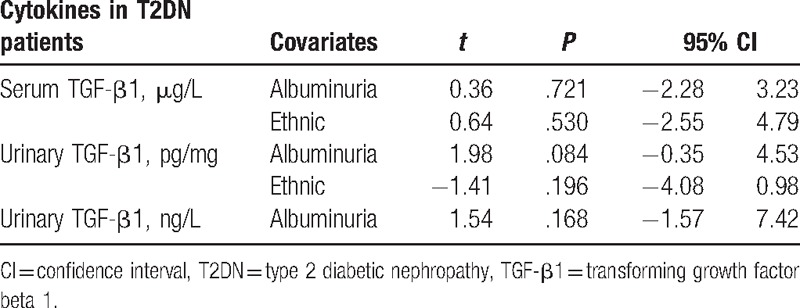
The high heterogeneity was still observed in all subgroup analysis. To explore the source of heterogeneity, we conducted regression analysis (the level of albuminuria and/or ethnic as covariates) and found that the level of albuminuria and/or ethnic was not a key influencing factor for the high heterogeneity in this meta-analysis (Table 4).
Table 4.
Regression analysis according to the level of albuminuria and/or ethnic in this meta-analysis.
3.4. Correlation between TGF-β1 level and albuminuria level
Pooling data about the level of TGF-β1 based on the collected studies (SMD and 95% CI) displayed in Table 5 and Fig. 8, which indicated the level of TGF-β1, were positively correlated with the level of albuminuria in patients.
Table 5.
Correlation between TGF-β level and albuminuria level.
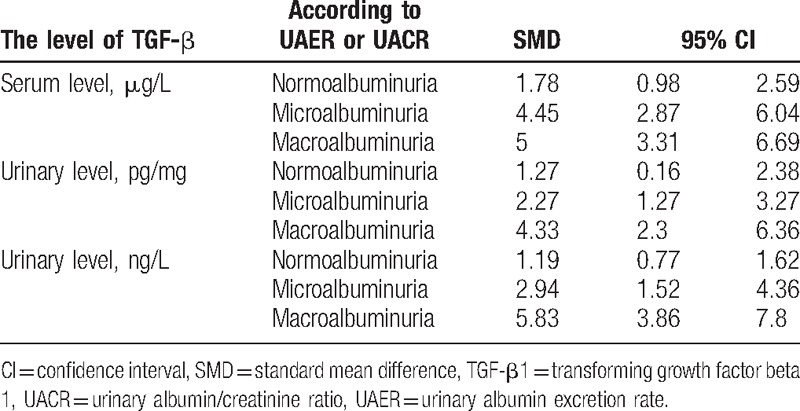
Figure 8.
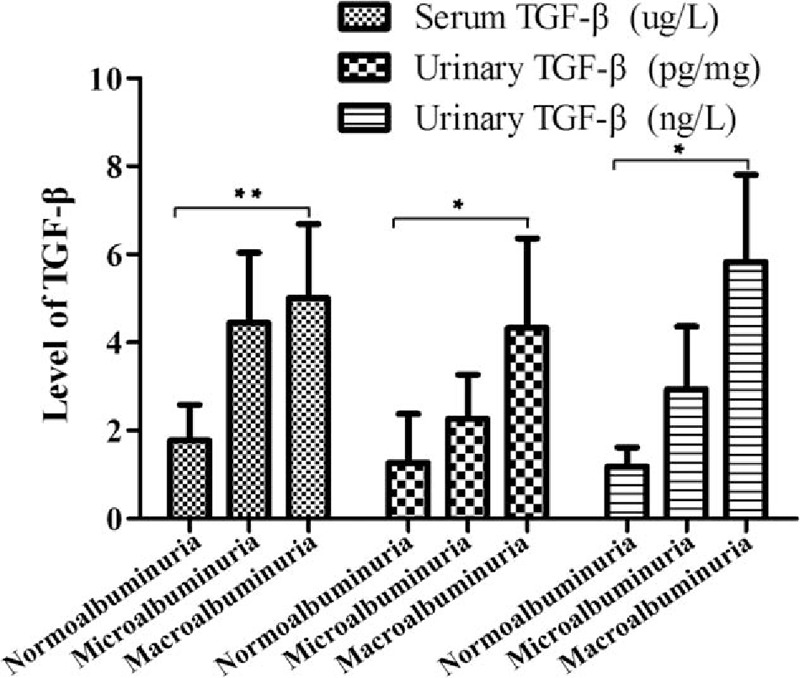
Correlation between TGF-β1 level and albuminuria level (data displayed SMD and 95% CI). (∗) P < .05; (∗∗) P < .01. CI = confidence interval, SMD = standard mean difference, TGF-β1 = transforming growth factor beta 1.
3.5. Sensitivity analysis
Sensitivity analysis was performed to assess the stability of the results, and we found the results had no significant change through excluding studies with high risk of bias. We again conducted sensitivity analysis when the articles were limited with high NOS score (≥7) and found all of the results had no significant change.
3.6. Publication bias
Egger test was used to judge the publication bias, and P < .05 was considered to be representative of statistically significant publication bias.[23] No obvious publication bias was found in most subgroup according to the Egger tests, except the subgroup about the level (ng/L) of urinary TGF-β1 in DN patients (microalbuminuria: t = 7.73, 95% CI 5.77–20.26, P = .016; macroalbuminuria: t = 3.77, 95% CI 1.86–21.88, P = .033).
4. Discussion
Our meta-analysis based on 26 studies with 1968 cases and 2100 controls evaluated the association between the level of serum, urinary TGF-β1, and patients with DM or DN. The results suggested that both of the serum and urinary TGF-β1 levels were significant increased versus healthy controls, which is consistent with most of the related studies. Earlier research indicated that TGF-β1 promoted the renal cell hypertrophy, regulated the production of extracellular matrix molecules, and induced the chemokines production in proximal tubules of the kidney.[44,45] In our study, complication as an important factor significantly influenced the level of TGF-β1. Complications such as retinopathy, nephropathy, and cardiovascular disease were sensitive to immune cells and cytokines in T2DM.[46,47] T2DM and its complications were low response and immune suppressive function, whereas TGF-β1 displayed higher level was a multifunctional growth factor and could be secreted by many immune cells such as macrophages, T cell and other tissue cell when confronted with inflammatory response. TGF-β1 in DN has been indicated by prior findings that protein and mRNA production of TGF-β1 were significantly enhanced in the renal tissues of patients with DN.[48,49] Some articles also found that urinary TGF-β1 levels were elevated with microalbuminuria and overt proteinuria, as compared with normoalbuminuria.[35] The results of serum and urinary TGF-β1 illuminate that it may be a novel biomarker for early diagnosis of DN.
Despite this, significant heterogeneity was found among most of the comparisons. The existing heterogeneity maybe possibly due to the different levels of albuminuria or ethnic, and subgroup analysis was used to reduce the heterogeneity. The results of subgroup analysis indicated that the levels of serum and urinary TGF-β1 were increased in Chinese DN patients with microalbuminuria, contrary to patients with macroalbuminuria in non-Chinese patients. However, we found that the high heterogeneity still existed. We used regression analysis to attempt to reduce the heterogeneity, and the results represented that different levels of albuminuria and ethnic were not parts of the source of high heterogeneity in the meta-analysis of serum and urinary TGF-β1 level. DN is a complex metabolic disease characterized by serious microvascular complications of DM[50,51]; so we speculated that the factors influencing the level of TGF-β1 in T2DN possibly were not only the level of albuminuria and ethnic but also sex, weight, age, and disease duration, and future work is needed to explore the factors. We also used sensitivity analysis to explore the source of heterogeneity and assessed the stability of the results, and found that the results indicated no significant change, suggesting that the association was predominantly reliable and stable.
The publication bias in some comparisons might influence the interpretation of our final results. The reasons for the results may be the small-size studies or the researchers and reviewers preferred positive results and neglected the negative research when submitting or accepting the articles or some valid articles were missed or had not been published. So publication bias was inevitable in this meta-analysis.
It should be noticed that there were several limitations that need to be taken into consideration in our meta-analysis when interpreting the findings. Firstly, random-effect model was selected to pool SMD because of the high heterogeneity that existed in some comparisons, and it may affect the accuracy of outcomes. Secondly, though more and more research was referred to the relationship between TGF-β1 level and T2DN, only a few studies were selected for meta-analysis, and we could not conduct further subgroup analysis such as by sex, weight, and duration, because most of them lack sufficient original data. Thirdly, only Chinese and English articles were chosen, and more eligible studies which were unpublished or other language articles were not considered. Otherwise, publication bias existed in the conclusion which was based on relatively small study samples. So larger studies should be warranted in future to elucidate the role of the TGF-β1 level in DN. Undoubtedly, though all the limitations will inevitably influence the conclusions, the strength of our meta-analysis based on the accumulating studies had more power to get a more precise estimation.
In conclusion, the results in our study support that the levels of serum and urinary TGF-β1 are significantly increased in T2DM and T2DN. Considering the conclusion was based on limited studies with relatively small samples, larger well-designed studies involving T2DM or T2DN are required to confirm our findings.
Footnotes
Abbreviations: DM = diabetes mellitus, T2DN = type 2 diabetic nephropathy, TGF-β1 = transforming growth factor beta 1, UACR = urinary albumin/creatinine ratio, UAER = urinary albumin excretion rate.
Funding: This work was supported by the National Natural Science Foundation of China (81471054).
The authors report no conflicts of interest.
References
- [1].Guariguata L, Whiting DR, Hambleton I, et al. Global estimates of diabetes prevalence for 2013 and projections for 2035. Diabetes Res Clin Pract 2014;103:137–49. [DOI] [PubMed] [Google Scholar]
- [2].Packham DK, Alves TP, Dwyer JP, et al. Relative incidence of ESRD versus cardiovascular mortality in proteinuric type 2 diabetes and nephropathy: results from the DIAMETRIC (Diabetes Mellitus Treatment for Renal Insufficiency Consortium) database. Am J Kidney Dis 2012;59:75–83. [DOI] [PubMed] [Google Scholar]
- [3].Satirapoj B, Kaewput W, Supasyndh O, et al. Effect of sulodexide on urinary biomarkers of kidney injury in normoalbuminuric type 2 diabetes: a randomized controlled trial. J Diabetes Res 2015;2015:172038. [DOI] [PMC free article] [PubMed] [Google Scholar]
- [4].Parving HH, Brenner BM, McMurray JJ, et al. Cardiorenal end points in a trial of aliskiren for type 2 diabetes. N Engl J Med 2012;367:2204–13. [DOI] [PubMed] [Google Scholar]
- [5].de Zeeuw D, Akizawa T, Audhya P, et al. Bardoxolone methyl in type 2 diabetes and stage 4 chronic kidney disease. N Engl J Med 2013;369:2492–503. [DOI] [PMC free article] [PubMed] [Google Scholar]
- [6].Bolton WK, Cattran DC, Williams ME, et al. Randomized trial of an inhibitor of formation of advanced glycation end products in diabetic nephropathy. Am J Nephrol 2004;24:32–40. [DOI] [PubMed] [Google Scholar]
- [7].Lv C, Zhou YH, Wu C, et al. The changes in miR-130b levels in human serum and the correlation with the severity of diabetic nephropathy. Diabetes/Metab Res Rev 2015;31:717–24. [DOI] [PubMed] [Google Scholar]
- [8].Navarro-Gonzalez JF, Mora-Fernandez C. The role of inflammatory cytokines in diabetic nephropathy. J Am Soc Nephrol 2008;19:433–42. [DOI] [PubMed] [Google Scholar]
- [9].Korpinen E, Groop PH, Fagerudd JA, et al. Increased secretion of TGF-beta1 by peripheral blood mononuclear cells from patients with type 1 diabetes mellitus with diabetic nephropathy. Diabetic Med 2001;18:121–5. [DOI] [PubMed] [Google Scholar]
- [10].Iwano M, Kubo A, Nishino T, et al. Quantification of glomerular TGF-beta 1 mRNA in patients with diabetes mellitus. Kidney Int 1996;49:1120–6. [DOI] [PubMed] [Google Scholar]
- [11].Border WA, Ruoslahti E. Transforming growth factor-beta in disease: the dark side of tissue repair. J Clin Investig 1992;90:1–7. [DOI] [PMC free article] [PubMed] [Google Scholar]
- [12].Border WA, Noble NA. Transforming growth factor beta in tissue fibrosis. N Engl J Med 1994;331:1286–92. [DOI] [PubMed] [Google Scholar]
- [13].Hellmich B, Schellner M, Schatz H, et al. Activation of transforming growth factor-beta1 in diabetic kidney disease. Metab Clin Exp 2000;49:353–9. [DOI] [PubMed] [Google Scholar]
- [14].Ibrahim S, Rashed L. Estimation of transforming growth factor-beta 1 as a marker of renal injury in type II diabetes mellitus. Saudi Med J 2007;28:519–23. [PubMed] [Google Scholar]
- [15].Shaker OG, Sadik NA. Transforming growth factor beta 1 and monocyte chemoattractant protein-1 as prognostic markers of diabetic nephropathy. Hum Exp Toxicol 2013;32:1089–96. [DOI] [PubMed] [Google Scholar]
- [16].Rivarola EW, Moyses-Neto M, Dantas M, et al. Transforming growth factor beta activity in urine of patients with type 2 diabetes and diabetic nephropathy. Braz J Med Biol Res 1999;32:1525–8. [DOI] [PubMed] [Google Scholar]
- [17].Upadhyaya S, Kadamkode V, Mahammed R, et al. Adiponectin and IL-6: mediators of inflammation in progression of healthy to type 2 diabetes in Indian population. Adipocyte 2014;3:39–45. [DOI] [PMC free article] [PubMed] [Google Scholar]
- [18].Qiao YC, Shen J, Hong XZ, et al. Changes of regulatory T cells, transforming growth factor-beta and interleukin-10 in patients with type 1 diabetes mellitus: A systematic review and meta-analysis. Clin Immunol 2016;170:61–9. [DOI] [PubMed] [Google Scholar]
- [19].Moher D, Liberati A, Tetzlaff J, et al. Preferred reporting items for systematic reviews and meta-analyses: the PRISMA statement. J Clin Epidemiol 2009;62:1006–12. [DOI] [PubMed] [Google Scholar]
- [20].Wells G, Shea B, O’Connell D, et al. The Newcastle-Ottawa Scale (NOS) for assessing the quality of nonrandomised studies in meta-analyses. 2011; Available at: http://www.ohri.ca/programs/clinical_epidemiology/oxford.asp. Accessed August 20, 2016. [Google Scholar]
- [21].Zintzaras E, Ioannidis JP. Heterogeneity testing in meta-analysis of genome searches. Genet Epidemiol 2005;28:123–37. [DOI] [PubMed] [Google Scholar]
- [22].Higgins JP, Thompson SG. Quantifying heterogeneity in a meta-analysis. Stat Med 2002;21:1539–58. [DOI] [PubMed] [Google Scholar]
- [23].Qiao YC, Shen J, He L, et al. Changes of regulatory T cells and of proinflammatory and immunosuppressive cytokines in patients with type 2 diabetes mellitus: a systematic review and meta-analysis. J Diabetes Res 2016;2016:3694957. [DOI] [PMC free article] [PubMed] [Google Scholar]
- [24].Liu S, Tian J, Bao HL, et al. Infect of pingshen decoction on serum HGF, Cys C and TGF-beta1 diabetic nephropathy in early stage. J Immunol Res 2014;39:1128–31. [PubMed] [Google Scholar]
- [25].Jun-Wen D, Tao W, Guo-Zhen N. The level about the TGF-β1 and proto-oncogene proteins c-sis in peripheral blood of T2DM patients with nephropathy and the clinical applications (in Chinese). Clin Focus 2007;22:793–4. [Google Scholar]
- [26].Chi DZ. Association of serum transforming growth factor-(TGF-β1), type IV collagen and laminin with diabetic nephropathy in type 2 diabetic patients (in Chinese). Heilongjiang Med J 2013;26:402–7. [Google Scholar]
- [27].Changxin F. Clinical significance of determination of serum cystatin C, transforming growth factor beta1(TGF-β1) and urine microalbumin levels in patients with DM2 nephropathy (in Chinese). J Radionimmunol 2007;20:471–4. [Google Scholar]
- [28].Jing C-y, Ye S-d, Chen Y. The change of serum and urinary transforming growth factor-beta-1 and their clinical significances in type 2 diabetics (in Chinese). Chin J Lab Diagn 2005;9:286–9. [Google Scholar]
- [29].Zhen-zuo L, Lin L, Rui-yan X. Clinical study of serum matrix metalloproteinase-9 and transforming growth factor-β1 related with type 2 diabetic patients with nephropathy (in Chinese). J Taishan Med Coll 2005;26:530–4. [Google Scholar]
- [30].Rui-ji L, Lan-ji L. The level about the HGF and TGF-β1 in peripheral blood of T2DM patients with nephropathy and the clinical applications (in Chinese). Hebei Med J 2011;33:1806–8. [Google Scholar]
- [31].Yan-jun W, Ping H, Li-ping L. Determination and clinical significance analysis of IL-6, TNF-β and TGF-β1 in the patients with diabetic nephropathy (in Chinese). Chin J Sci Techn Periodicals 2002;18:214–5. [Google Scholar]
- [32].Ye-Sheng W, Yan L, Yan-Wu Y. The serum level and the genotype of TGF-β1 in patients with type 2 diabetic nephropathy (in Chinese). Chin J Lab Med 2005;128:173–8. [Google Scholar]
- [33].Wei-jie Z, Kai L. Association between changes in transforming growth factor-beta1 level and type 2 diabetic nephropathy (in Chinese). J Clin Rehabil Tissue Eng Res 2007;11:9838–42. [Google Scholar]
- [34].Zhou Y, Su X, Ke S. Relationship between serum levels of transforming growth factor-β1, tumor necrosis factor-β and diabetic nephropathy (in Chinese). Acta Med Univ Sci Technol Huazhong 2005;34:441–4. [Google Scholar]
- [35].Ha SW, Kim HJ, Bae JS, et al. Elevation of urinary betaig-h3, transforming growth factor-beta-induced protein in patients with type 2 diabetes and nephropathy. Diabetes Res Clin Pract 2004;65:167–73. [DOI] [PubMed] [Google Scholar]
- [36].Chun-Yan J, Shan-Dong Y, Yan C. Clinical significance of urinary transforming growth factor-β1 measurement in diabetics (in Chinese). Acta Univ Med Nahui 2003;38:202–5. [Google Scholar]
- [37].Yun-hai S. Clinical significance of Urinary transforming growth factor-β1 measurement in type 2 diabetic nephropathy. J Radionimmunol 2013;26:743–4. [Google Scholar]
- [38].Jian-jian Y, Yun-juan Q, Qi L, et al. Urinalysis of transforming growth factor-β1 in old patients with diabetic nephropathy. Chin J Rehabil Theory Pract 2005;11:940–1. [Google Scholar]
- [39].Dong C, Wen-ruo D, Jian-bin L, et al. Correlation of serum TGF-β1 and PDGF-BB with albumin excretion rate in patients with type 2 diabetic nephropathy (in Chinese). Acta Acad Med Qingdao Univ 2011;47:450–9. [Google Scholar]
- [40].Jian-hong J, Yue-zhi H, Yan W, et al. The change and the implication of urinary VEGF, TGFβ1 and Co-IV level in type 2 diabetic patients with nephropathy (in Chinese). Bull Med Res 2004;33:16–20. [Google Scholar]
- [41].Wei-min L, Kui X. The detection and clinical significance of serum and urinary transforming growth factor-β1 measurement in type 2 diabetic nephropathy (in Chinese). Clin Focus 2004;19:1362–3. [Google Scholar]
- [42].Tao M. The correlation research about urinary microalbuminuria, and TGF-β1 in early diabetic nephropathy (in Chinese). J Pract Med 2006;22:399–400. [Google Scholar]
- [43].Wei-kang Z. Clinical significance of determination of transforming growth factor beta 1, tumor necrosis factor alpha and urine microalbumin levels in patients with DM2 nephropathy (in Chinese). J Clin Res 2008;25:972–5. [Google Scholar]
- [44].Raptis AE, Viberti G. Pathogenesis of diabetic nephropathy. Exp Clin Endocrinol Diabetes 2001;109(suppl 2):S424–37. [DOI] [PubMed] [Google Scholar]
- [45].Chen S, Jim B, Ziyadeh FN. Diabetic nephropathy and transforming growth factor-beta: transforming our view of glomerulosclerosis and fibrosis build-up. Semin Nephrol 2003;23:532–43. [DOI] [PubMed] [Google Scholar]
- [46].Shoelson SE, Herrero L, Naaz A. Obesity, inflammation, and insulin resistance. Gastroenterology 2007;132:2169–80. [DOI] [PubMed] [Google Scholar]
- [47].King GL. The role of inflammatory cytokines in diabetes and its complications. J Periodontol 2008;79(8 suppl):1527–34. [DOI] [PubMed] [Google Scholar]
- [48].Yamamoto T, Nakamura T, Noble NA, et al. Expression of transforming growth factor beta is elevated in human and experimental diabetic nephropathy. Proc Natl Acad Sci USA 1993;90:1814–8. [DOI] [PMC free article] [PubMed] [Google Scholar]
- [49].Sharma K, Ziyadeh FN, Alzahabi B, et al. Increased renal production of transforming growth factor-beta1 in patients with type II diabetes. Diabetes 1997;46:854–9. [DOI] [PubMed] [Google Scholar]
- [50].Jawa A, Kcomt J, Fonseca VA. Diabetic nephropathy and retinopathy. Med Clin N Am 2004;88:1001–36. xi. [DOI] [PubMed] [Google Scholar]
- [51].Remuzzi G, Schieppati A, Ruggenenti P. Clinical practice. Nephropathy in patients with type 2 diabetes. N Engl J Med 2002;346:1145–51. [DOI] [PubMed] [Google Scholar]