Abstract
This study presents the calculated reference interval for the disc-to-macula distance to disc diameter ratio (DM:DD) based on a large population of healthy Japanese adults.
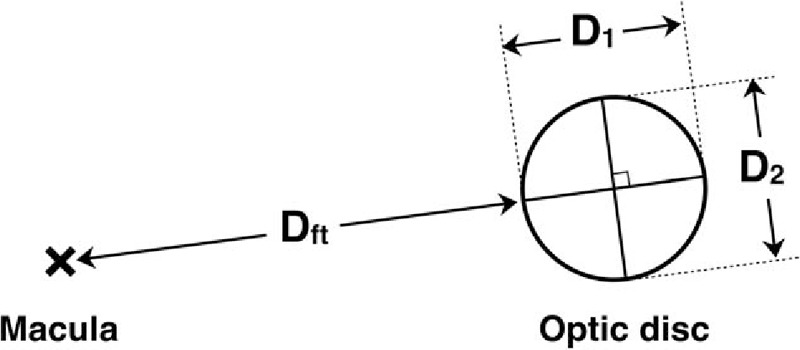
A total of 308 consecutive, healthy Japanese adults were examined in this prospective observational study. Eighteen subjects were also excluded because of poor quality of the fundus photograph of one or both eyes; 290 (161 men and 129 women) were included in this study. For each subject, a color fundus photograph of one eye, either the right or left, was randomly selected and used for analysis. On the photograph, the distances between the fovea and the nearest temporal margin of the optic disc (Dft), and the two kinds of disc diameters (D1 and D2), which bisected at right angles and one of which was directed to the fovea (D1), were measured. DM:DD was estimated using the formula: (2Dft + D1)/(D1 + D2).
The mean ± standard deviation of DM:DD was 2.91 ± 0.49 for men and 2.96 ± 0.54 for women; there was no sex difference (P = .78, Mann–Whitney U test). Also, almost no relationship was found between DM:DD and age (ρ = −.12, P = .04, Spearman's rank correlation coefficient). The data did not fit a normal distribution (P < .001, Kolmogorov–Smirnov test). The estimated reference interval for DM:DD corresponding to the 2.5th and 97.5th percentiles was 2.12 to 4.18.
Using a nonparametric approach, the reference interval for DM:DD of a large population of healthy Japanese adults was calculated to be 2.12 to 4.18, regardless of age or sex.
Keywords: diameter, macula, morphology, optic disc, reference interval
1. Introduction
The clinical importance of measuring optic disc size has been reported. A large disc size may be related to glaucomatous damage.[1,2] Also, a recent study noted that a large disc size disturbed the detection of morphological changes in a glaucomatous optic disc.[3] On the other hand, a small disc size suggests optic nerve hypoplasia.[4–7]
Several methods have been established to measure the disc size: stereo photography,[8] optical coherence tomography, and confocal scanning laser ophthalmoscopy.[9] However, these methods need complicated procedures or expensive equipment.
Although calculation of disc-to-macula distance to disc diameter ratio (DM:DD) does not reveal an absolute value, it is a simple method to estimate the disc size.[4,5,7,10] Briefly, this ratio gives the number of optic discs that can be apposed between the macula and the center of the disc. DM:DD can be obtained by taking a planar fundus photograph or may be approximated by observing the fundus with an ophthalmoscope. Published literature on DM:DD presented only clinical decision limits (e.g., thresholds for optic nerve hypoplasia),[5–7] but not reference intervals.[11] In addition, these reports had relatively small sample sizes. The present study aimed to show the calculated reference interval for DM:DD based on a large population of healthy Japanese adults.
2. Methods
The subjects for this prospective, observational study were asymptomatic patients who underwent a general health examination at Nikko Memorial Hospital, Muroran, Japan. Subjects who had visual symptoms or a past history of ophthalmic disease were empirically excluded. This study did not consider the refractive error, visual acuity, or intraocular pressure of each subject. Continuous data collection was planned until the number in each of the 30s, 40s, 50s, and 60s age groups reached 30. Data collection was started on December 3, 2014, and was completed on February 18, 2015.
In each subject, color fundus photographs of both eyes were taken using a retinal camera (TRC-NW8, Topcon Corporation, Tokyo, Japan) and were printed with a 45° field of view and 95-mm diameter. Either the right or left eye was randomly selected and used for further analysis. Using a digital caliper on printed paper, an ophthalmologist with more than two decades of clinical experience measured the distance between the fovea and the nearest temporal margin of the optic disc (Dft). Two kinds of disc diameters, D1 and D2, which bisected at right angles and one of which was directed toward the fovea (D1), were also measured (Fig. 1). Following the method described by Wakakura and Alvarez,[5] DM:DD was estimated using the formula: (2Dft + D1)/(D1 + D2). Informed consent was obtained from all subjects prior to examination and the study adhered to the tenets of the Declaration of Helsinki.
Figure 1.

Diagram of disc-to-macula distance to disc diameter ratio measurement. Dft indicates the distance between the fovea and the nearest temporal margin of the optic disc; D1, the disc diameter directed towards the fovea; D2, the disc diameter in the direction perpendicular to D1.
2.1. Statistical analysis
Data analysis was conducted in Stat view 5.0 (SAS Institute, Inc., Cary, NC) with significance set at 5%. The Mann–Whitney U test was used to determine significance between the sexes, and Spearman's rank correlation coefficient was employed to analyze relationships between DM:DD and age. The Kolmogorov–Smirnov test was used to examine if the data fit a normal distribution.
3. Results
A total of 308 consecutive subjects were examined, but 18 were secondarily excluded because of poor quality of the fundus photograph of one or both eyes. Thus, 290 subjects (161 men, 129 women) were included in the analysis, who were in their 30s (n = 31), 40s (n = 111), 50s (n = 75), 60s (n = 63), or 70s (n = 10).
The mean (± standard deviation) DM:DD values were similar between the sexes (2.91 ± 0.49 for men vs. 2.96 ± 0.54 for women, P = .78). Also, almost no relationship was found between DM:DD and age (ρ = −.12, P = .04). Accordingly, the influences of sex and age on the reference interval of the present data could be ignored.
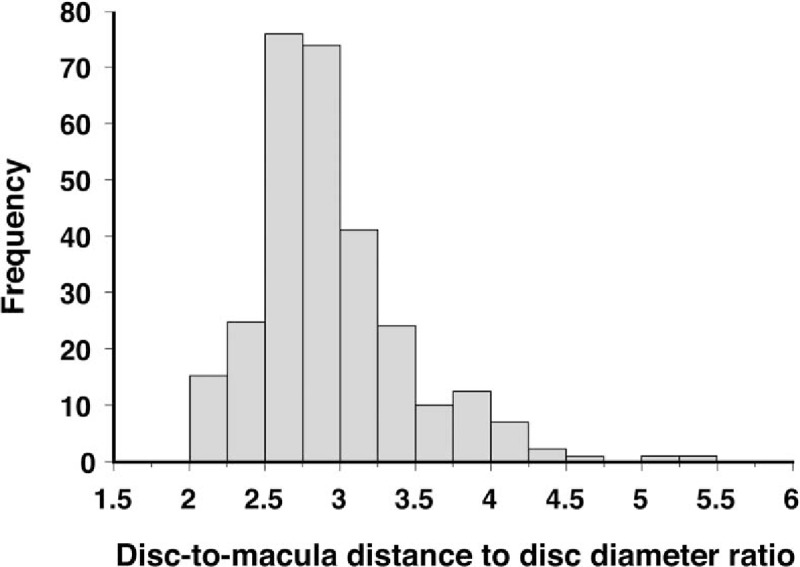
A histogram of DM:DD was skewed to the right and showed a unimodal distribution (Fig. 2); the data did not fit a normal distribution (P < .001). Therefore, the reference interval for DM:DD was calculated by the nonparametric approach.[11] The estimated reference interval corresponding to the 2.5th and 97.5th percentiles was 2.12 to 4.18.
Figure 2.

A histogram showing the population distribution of the disc-to-macula distance to disc diameter ratio.
4. Discussion
In the present study, the reference interval for DM:DD of a large population of healthy Japanese adults was calculated.
The Clinical and Laboratory Standards Institute recommends the use of a questionnaire to select reference individuals.[12] Similarly, without further detailed ophthalmic examination at the beginning, the present study empirically excluded only those who had visual symptoms or a past history of ophthalmic disease.
Reference intervals are the distribution of test results that are normal for a selected population of healthy persons. Use of nonparametric methods to calculate reference intervals does not require assumption of a particular distribution of data and are recommended when 120 or more reference samples are available. Nonparametric methods typically encompass the central 95th percentile of reference values.[13] As the data in this study did not fit a normal distribution, the reference interval was calculated by the nonparametric method.
Previous studies reporting DM:DD had relatively small sample sizes of 37 to 125.[4–7,10] In addition, these studies described the clinical decision limits for optic nerve hypoplasia[4–7] or macrodiscs,[10] but not the reference interval for DM:DD. The present study prepared a large sample size in order to calculate a credible reference interval.
Barr et al[7] claimed that the thresholds of DM:DD for unequivocal and almost-certain optic nerve hypoplasia were 4.20 and 3.68, respectively. Their results were consistent with those of the present study. In contrast, Wakakura and Alvarez[5] reported that the mean DM:DD in patients with optic nerve hypoplasia, which was characterized by visual field defect to some extent and nerve fiber loss, was 3.25 ± 0.26 (standard deviation). Most of their cases seemed to fall within the reference interval calculated in the present study. Their investigation was conducted in both Scotland and Japan, and the effect of racial/ethnic variation in DM:DD was not necessarily negated. However, this discordance may mean that clinical decision limits should be distinguished from reference intervals. Regardless of the presence of pathology, eyes with DM:DD less than the 2.5th percentile and more than the 97.5th percentile can be considered morphologically as macrodiscs and microdiscs, respectively.
This study had certain limitations. First, measurement on the photo prints was performed by a single examiner. Barr et al[7] reported that interobserver variation increased as DM:DD increased. Likewise, this interobserver variation in the present study may affect the DM:DD in eyes with a smaller disc.
Second, the nonparametric calculation method employed in this study may be disadvantageous compared with a parametric method in allowing identification and exclusion of extreme values during the computation of reference intervals.[11]
In summary, using a nonparametric approach, the reference interval for DM:DD of a large population of healthy Japanese adults was calculated to be 2.12 to 4.18, regardless of age or sex.
Footnotes
Abbreviations: D1 = disc diameter directed to the fovea, D2 = disc diameter in the direction perpendicular to D1, Dft = distance between the fovea and the nearest temporal margin of the optic disc, DM:DD = disc-to-macula distance to disc diameter ratio.
The author has no funding and conflicts of interest to disclose.
References
- [1].Burk RO, Rohrschneidern K, Noack H, et al. Are large optic nerve heads susceptible to glaucomatous damage at normal intraocular pressure? A three dimensional study by laser scanning tomography. Graefes Arch Clin Exp Ophthalmol 1992;230:552–60. [DOI] [PubMed] [Google Scholar]
- [2].Enomoto N, Anraku A, Ishida K, et al. Size of the optic nerve head and its relationship with the thickness of the macular ganglion cell complex and peripapillary retinal nerve fiber layer in patients with primary open angle glaucoma. J Ophthalmol 2015;2015:747302. [DOI] [PMC free article] [PubMed] [Google Scholar]
- [3].Okimoto S, Yamashita K, Shibata T, et al. Morphological features and important parameters of large optic discs for diagnosing glaucoma. PloS One 2015;10:e0118920. [DOI] [PMC free article] [PubMed] [Google Scholar]
- [4].Awan KJ. Ganglionic neuroretinal aplasia and hypoplasia: aplasia and hypoplasia of optic nerve. Ann Ophthalmol 1976;8:1193–202. [PubMed] [Google Scholar]
- [5].Wakakura M, Alvarez E. A simple clinical method of assessing patients with optic nerve hypoplasia. The disc-macula distance to disc diameter ratio (DM/DD). Acta Ophthalmol (Copenh) 1987;65:612–7. [DOI] [PubMed] [Google Scholar]
- [6].Alvarez E, Wakakura M, Khan Z, et al. The disc-macula distance to disc diameter ratio: a new test for confirming optic nerve hypoplasia in young children. J Pediatr Ophthalmol Strabismus 1987;25:151–4. [DOI] [PubMed] [Google Scholar]
- [7].Barr DB, Weir CR, Purdie AT. An appraisal of the disc–macula distance to disc diameter ratio in the assessment of optic disc size. Ophthalmic Physiol Opt 1999;19:365–75. [DOI] [PubMed] [Google Scholar]
- [8].Tsutsumi T, Tomidokoro A, Araie M, et al. Planimetrically determined vertical cup/disc and rim width/disc diameter ratios and related factors. Invest Ophthalmol Vis Sci 2012;53:1332–40. [DOI] [PubMed] [Google Scholar]
- [9].Moghimi S, Hosseini H, Riddle J, et al. Measurement of optic disc size and rim area with spectral-domain OCT and scanning laser ophthalmoscopy. Invest Ophthalmol Vis Sci 2012;53:4519–30. [DOI] [PubMed] [Google Scholar]
- [10].Mok KH, Lee VW. Disc-to-macula distance to disc-diameter ratio for optic disc size estimation. J Glaucoma 2002;11:392–5. [DOI] [PubMed] [Google Scholar]
- [11].Ichihara K, Boyd JC. An appraisal of statistical procedures used in derivation of reference intervals. Clin Chem Lab Med 2010;48:1537–51. [DOI] [PubMed] [Google Scholar]
- [12].CLSI and IFCC Defining, establishing, and verifying reference intervals in the clinical laboratory: approved guideline—third edition. C28-A3 Document 2008;28:1–76. [Google Scholar]
- [13].Horn PS, Pesce AJ. Reference intervals: an update. Clin Chim Acta 2003;334:5–23. [DOI] [PubMed] [Google Scholar]


