Abstract
Neuroblastoma is the second most common extracranial malignant solid tumor that occurs in childhood, and metastasis is one of the major causes of death in neuroblastoma patients. The epithelial-mesenchymal transition (EMT) is an important mechanism for both the initiation of tumor invasion and subsequent metastasis. Therefore, this study investigated the mechanism by which transforming growth factor (TGF)-β1 induces EMT in human neuroblastoma cells. Using quantitative RT-qPCR and western blot analyses, we found that the mRNA and protein expression levels of E-cadherin were significantly decreased, whereas that of α-SMA was significantly increased after neuroblastoma cells were treated with different concentrations of TGF-β1. A scratch test and Transwell migration assay revealed that cell migration significantly and directly correlated with the concentration of TGF-β1 indicating that TGF-β1 induced EMT in neuroblastoma cells and led to their migration. Inhibiting Smad2/3 expression did not affect the expression of the key molecules involved in EMT. Further investigation found that the expression of the glioblastoma transcription factor (Gli) significantly increased in TGF-β1-stimulated neuroblastoma cells undergoing EMT, accordingly, interfering with Gli1/2 expression inhibited TGF-β1-induced EMT in neuroblastoma cells. GANT61, which is a targeted inhibitor of Gli1 and Gli2, decreased cell viability and promoted cell apoptosis. Thus, TGF-β1 induced EMT in neuroblastoma cells to increase their migration. Specifically, EMT induced by TGF-β1 in neuroblastoma cells did not depend on the Smad signaling pathway, and the transcription factor Gli participated in TGF-β1-induced EMT independent of Smad signaling.
Keywords: neuroblastoma, epithelial-mesenchymal transition, transforming growth factor-β1, transcription factor Gli
Introduction
Neuroblastoma is the second most common extracranial malignant tumor that occurs in childhood (1). It is a high-grade malignancy, and metastasis often occurs in the early phase of disease (2). Therefore, the long-term outcome of children with neuroblastoma who are classified as high-risk patients remains as poor as 30%, despite the administration of aggressive multimodal therapy, and metastasis is one of the major causes of death in patients with neuroblastoma (3,4). Tumor metastasis has been shown to be associated with the epithelial-mesenchymal transition (EMT), which promotes the loss of tight junctions between cancer cells, increases metastasis and invasion of cancer cells, and inhibits apoptosis (5,6). However, the mechanisms regulating EMT in tumor cells are complex and involve the cell microenvironment and various cytokine signal transduction pathways. Transforming growth factor (TGF)-β level was indeed elevated in neuroblastoma cases and found to be related to a pathway important for promoting neuroblastoma invasion (7,8) and may be a potential treatment target in neuroblastoma (9). Although, TGF-β1 is known to induce EMT (10), the mechanism of this induction in neuroblastoma is poorly understood.
The glioblastoma transcription factor (Gli) plays an important role in humans by regulating the growth and differentiation of normal cells, and it also plays an important role in the initiation and development of various tumors (11,12). This study focused on the regulatory effects of TGF-β1 on EMT in human neuroblastoma cells and the correlation of these effects with transcription factor Gli.
Materials and methods
Cell culture
Human neuroblastoma SK-N-SH, SH-SY5Y, IMR-32 cells were purchased from the Shanghai Institute of Biochemistry and Cell Biology of the Chinese Academy of Sciences. SK-N-SH cells were established from the brain metastases of a patient with prostate cancer who had a 3-year history of neuroblastoma. These cells exhibited irregular shapes, including spindle, round, and polygonal shapes. SH-SY5Y cells were established from the bone marrow metastases of a patient with neuroblastoma. The cells grow as clusters of neuroblastic cells with multiple, short, fine cell processes (neurites). Cells will aggregate, form clumps and float. The IMR-32 cells were established from an abdominal mass occurring in a 13-month-old Caucasian male. The cells were cultured in DMEM medium containing 100 ml/l FBS and incubated in a 37°C incubator containing 5% CO2.
Antibodies and reagents
Primary antibodies against E-cadherin and GAPDH were obtained from Proteintech Co., USA. α-SMA, Gli1, Gli2, Gli3, Smad2, Smad3, TGF-β receptor I/receptor II and GANT61 were obtained from Abcam Co., UK. Recombinant human TGF-β1 was purchased from R&D Systems (Minneapolis, MN, USA). SiRNA against Smad2/3, Gli1, and Gli2, control SiRNA, FITC-labeled secondary antibodies, all from Santa Cruz Biotechnology (CA, USA). pcDNA3.0 Smad2, pcDNA3.0 Smad3, and pcDNA3.0 control were obtained from Dr Huang Wenyan from Shanghai Children's Hospital, China. The PCR primers were obtained from Shanghai Sangon Biotech Co., Ltd., China; the reverse transcription kit was purchased from Takara Co. (Japan). Lipofectamine™ 2000 was from Life Co. (USA).
Morphology
The cells were seeded in 6-well plates and treated with TGF-β1 for 14 days. The changes in cell morphology were observed daily by phase contrast microscopy, and the cells were also imaged.
Immunofluorescence staining
The cells were cultured in 24-well plates that were pre-loaded with a small round slide in each well. When the cells attached to the slides, the slides were removed and fixed in 4% paraformaldehyde at room temperature for 30 min. Primary antibodies were then added, and the cells were incubated at room temperature for 2 h before being incubated with FITC-labeled secondary antibodies in the dark. The slides were then stained with DAPI, washed twice with PBS, mounted, and observed and imaged under a fluorescence microscope.
Total RNA extraction and reverse transcription
The cells were grown in 25 cm2 cell culture flasks until they reached 80% confluence, at which point 1 ml of TRIzol was added. The suspension was added to a 1.5-ml centrifuge tube, and 200 µl of chloroform was added. The top layer, which consisted of a colorless liquid, was retained, and an equal volume of isopropanol was added, followed by centrifugation. The supernatant was discarded, the white pellet at the bottom was precipitated twice with 75% ethanol, and the supernatant was discarded after centrifugation. After drying, the pellet was dissolved in DEPC water, the RNA concentration was measured, and reverse transcription was performed according to the manufacturer's instructions.
Fluorescent reverse transcription quantitative polymerase chain reaction (RT-qPCR)
The cells were cultured, RNA was extracted using the TRIzol method, and 500 µg RNA was reverse transcribed into cDNA, which was diluted 5-fold to detect changes in gene expression by RT-qPCR. The total reaction volume was 20 µl and consisted of 10 µl of SYBR Premix Ex Taq™, 2 µl of cDNA, 6 µl of DEPC water, and 1 µl each of the upstream and downstream primers. RT-qPCR was performed using the following primers: E-cadherin: 5′-GGA TGTGAATGAAGCCCCCA-3′ (sense) and 5′-CCTGGGCAGTGTAGGATGTG-3′ (antisense). β-actin: 5′-GCACTCTTCCAGCCTTCCTT-3′ (sense) and 5′-AATGCCAGGGTACATGGTGG-3′ (antisense). α-SMA: 5′-CCCTTGAGAAGAGTTACGAGTTG-3′ (sense) and 5′-ATGATGCTGTTGTAGGTGGTTTC-3′ (antisense). Gli1: 5′-GAGCCAGAAGTTGGGACCTC-3′ (sense) and 5′-CCTCGCTCCATAAGGCTCAG-3′ (antisense). Gli2: 5′-GGTGAGTCGTCCAGCCAAAT-3′ (sense) and 5′-ACTGTCAAGGGGGAAGCAGA-3′ (antisense). Smad2: 5′-GCCCTAAAGTGCCTGGGATT-3′ (sense) and 5′-TGGAGAATCGCTTTTGGGCA-3′ (antisense). Smad3: 5′-TACCAGCAGCAAGAGAGTGC-3′ (sense) and 5′-CTGAAAGGGGCCTACAAGGG-3′ (antisense).
The PCR procedure was performed on the Roche RT-PCR facility (Roche Light Cycle) described below: initial steps at 95°C for 3 min, then each of 40 cycles: denaturation for 7 sec at 95°C annealing for 10 sec at 55°C, extending for 15 sec at 72°C. First, ∆Ct = Ct Gene − Ct β-actin. Then, ΔΔCt = ΔCt sample 2 − ΔCt sample 1. Lastly, 2−ΔΔCt was calculated to represent the relative mRNA expression of target genes. β-actin was used as an inner control.
Western blot analysis
After the culture medium was aspirated, each 10-cm dish was washed with PBS, and protein lysis buffer was added (containing protease and phosphatase inhibitors) to extract the proteins. The proteins were separated by 10% polyacrylamide gel electrophoresis, transferred to a polyvinylidene fluoride (PVDF) membrane (the PVDF membrane was activated by methanol), and blocked with 5% skim milk. Primary antibodies were then added, followed by overnight incubation in a rotator at 4°C and subsequent hybridization with secondary antibodies. Enhanced chemiluminescence (ECL) detection was used to detect the protein bands.
Scratch test
The backs of the 6-well plates were labeled with horizontal lines using marker pens. After digestion, the cells were seeded in 6-well plates, allowed to adhere, and treated with TGF-β1. After the cells covered the entire bottom of the plate, scratches were made by perpendicularly scratching the bottom of the wells with a 200-µl pipette tip. The cell culture medium was aspirated, serum-free medium was added, and the plates were removed and imaged once every 4–6 h.
Transwell migration assay
The migration ability of SK-N-SH cells was measured using BD Falcon cell culture inserts containing 8-µm pore size PET membranes and 24-well BD BioCoat Matrigel Invasion Chambers (BD Biosciences, Bedford, MA, USA). SK-N-SH cell suspensions were adjusted to contain 1×10⁵ cells and added to the upper chamber in serum-free medium treated with TGF-β1 (5 ng/ml). Complete medium was added to the bottom wells of the chambers. After incubation at 37°C under 5% CO2 for 72 h, cells that had not migrated were removed from the upper face of the filters using cotton swabs, and the cells that had migrated were fixed and stained with crystal violet solution.
Cell transfection
The SiRNA was dissolved in RNAase-free water to a concentration of 10 µmol/l. One day before transfection, 1×10⁵ cells were seeded in 12-well plates. Two transfection mixtures were prepared by mixing 4 µl of Lipofectamine 2000 with 200 µl of Opti-MEM1 and 8 µl of SiRNA with 200 µl of Opti-MEM1 at room temperature. The diluted SiRNA duplex was then combined with the Lipofectamine 2000 solution and incubated for 20 min at room temperature. Finally, this transfection mixture was added to 12-well plates. The cells were transfected for 6 h, and the transfection medium was then replaced with fresh medium containing TGF-β1 (5 ng/ml). The cell were incubated for a further 72 h and then harvested for protein analysis.
Cell viability assay
Cell viability and cytotoxicity was assessed by cell counting kit-8 (CCK8). Cells were seeded in 96-well plates at density of 5,000 cells in 100 µl medium per well. After being treated with various concentration of GANT61 for 48 h at 37°C, CCK8 was added to each well and the cells were incubated for a further 2 h at 37°C, after which absorbance was measured using a microplate reader with a test wavelength of 450 nm. Data were analyzed from three independent experiments.
Flow cytometry analysis
To analyze apoptosis, cells were digested with trypsin and washed with PBS. Apoptotic detection kit was from BD (BD Biosciences). BD Pharmingen-FITC Annexin V Apoptosis Detection kit cat. no. 556547) was used and staining was conducted according to the kit instructions. The cells was analyzed by BD FACSCalibur flow cytometry facility. Annexin V-FITC+/PI− represented the apoptotic cell population.
Statistical analysis
All statistical analyses were performed using GraphPad Prism 5 software (GraphPad Software, Inc., La Jolla, CA, USA). Measured data are expressed as the means ± standard deviation. Comparisons of the means of multiple groups were conducted using a one-way analysis of variance (ANOVA). Comparisons of the means of two groups were conducted using a t-test. A value of P<0.05 was considered statistically significant.
Results
Changes in cell morphology and the occurrence of EMT after treatment with TGF-β1
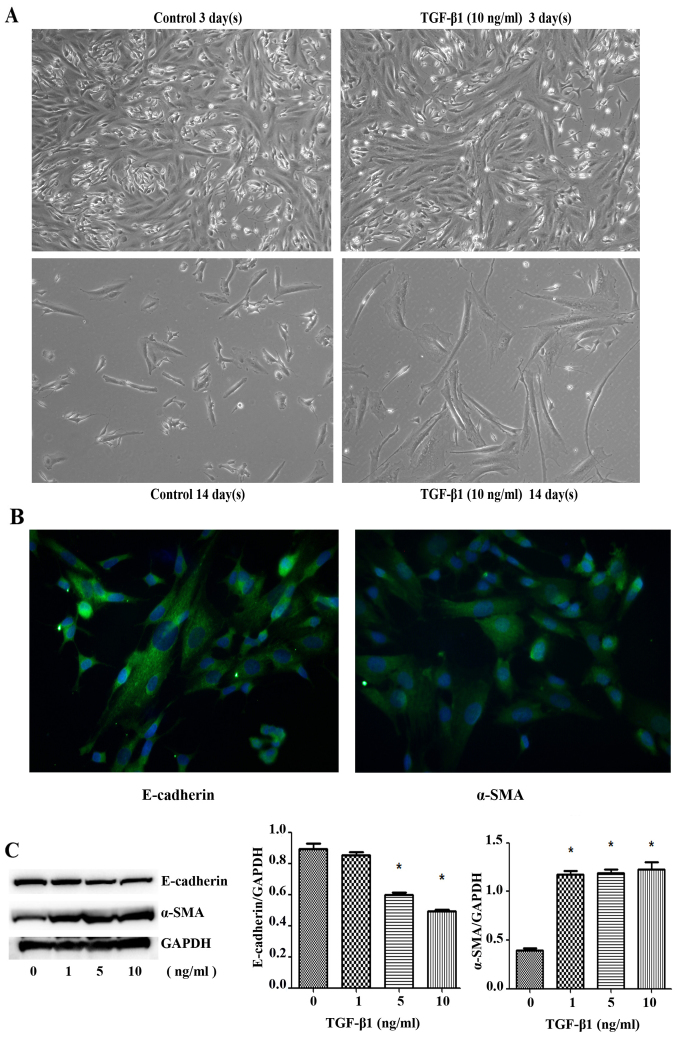
SK-N-SH cells exhibited irregular shapes, including spindle, round, and polygonal shapes. Immunofluorescence staining showed that SK-N-SH cells expressed TGF-β receptor I and II. After three days of treatment with different concentrations of TGF-β1, some spindle-shaped cells showed elongated cell bodies with a more pronounced spindle-shaped appearance. After 14 days of treatment with TGF-β1 (10 ng/ml), the spindle-shaped cells showed elongated cell bodies and had a more pronounced spindle-shaped appearance, and most cells were spindle-shaped, suggesting the occurrence of EMT (Fig. 1A). Immunofluorescence staining showed that SK-N-SH cells expressed the EMT markers E-cadherin and α-SMA in the cytoplasm (Fig. 1B). After SK-N-SH cells were treated with TGF-β1 (0, 1, 5 and 10 ng/ml) for three days, quantitative densitometric analysis showed that the protein expression level of the epithelial cell marker E-cadherin was significantly decreased (F=74.81, P=0.0006), whereas that of α-SMA was significantly increased (F=68.81, P=0.0007) (Fig. 1C). The mRNA expression level of E-cadherin was significantly decreased (F=8.144, P=0.0353), whereas that of α-SMA was significantly increased (F=547.3, P<0.0001). These changes, which occurred simultaneously, suggested that the cells had undergone EMT.
Figure 1.
Cell morphology changes and E-cadherin/α-SMA was expressed in SK-N-SH cells. (A) The SK-N-SH cells were stimulated with TGF-β1 at 10 ng/ml for 3 or 14 days. The cells showed morphology changes from epithelial to mesenchymal transition (scale bar, 100 µm). (B) The expression of E-cadherin and α-SMA detected by immunofluorescence assay (scale bar, 50 µm). (C) The SK-N-SH cells were stimulated with TGF-β1 at 0, 1, 5 and 10 ng/ml, the cells were subsequently collected and subjected to western blot analysis. GAPDH served as a loading control. Columns, mean of three experiments; bars, ± SD. *P<0.05.
TGF-β1 promotes migration in SK-N-SH cells after treatment with TGF-β1
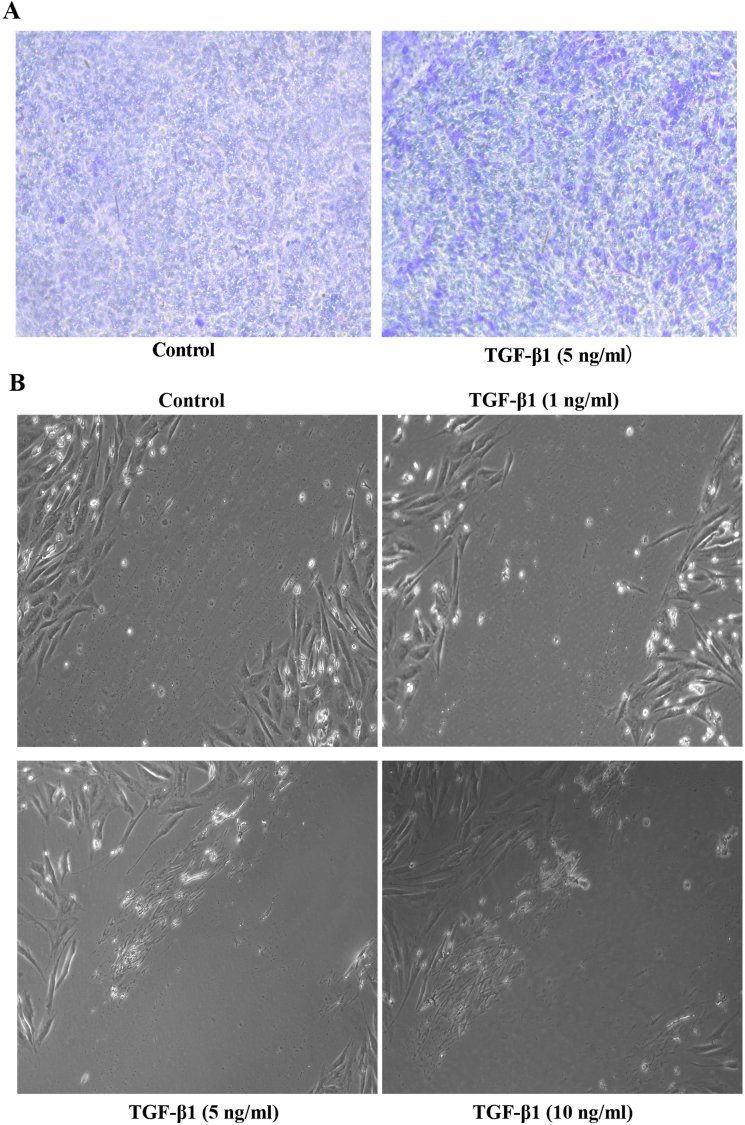
The migration ability of SK-N-SH cells after treatment with 5 ng/ml TGF-β1 for 72 h, as analyzed with a Transwell migration assay, were higher than those of the SK-N-SH control group (t=16.07, P=0.0396) (Fig. 2A). SK-N-SH cells were treated with TGF-β1 (0, 1, 5 and 10 ng/ml) for 72 h, and the medium was then exchanged for serum-free medium. The cells were imaged once every 4 h, and the results showed that the TGF-β1 concentration significantly and directly correlated with cell migration (Fig. 2B). These results indicated that TGF-β1 plays a role in neuroblastoma cell migration.
Figure 2.
TGF-β1 induces the migration of SK-N-SH cells. (A) SK-N-SH neuroblastoma cells were seed into the upper chamber in serum-free medium and were treated with TGF-β1 (5 ng/ml), the Transwell migration assay was performed as the standard protocol. (B) The SK-N-SH neuroblastoma cells were plated, treated with TGF-β1, scratches were made by perpendicularly scratching the bottom of the wells.
Interfering with the expression of Smad2/3 does not affect the expression of key EMT molecules
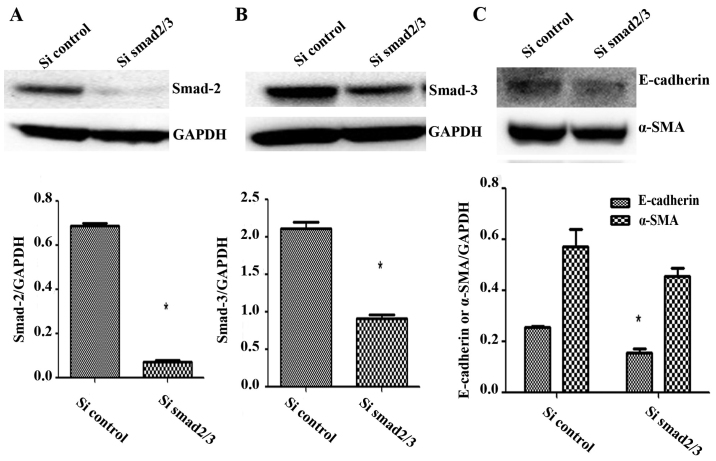
SK-N-SH cells were transfected with SiRNA against Smad2/3 and treated with TGF-β1 for 72 h, and these cells expressed significantly less Smad2 and Smad3 protein than the control group (t=34.61, P=0.0008; t=11.73, P=0.0072) (Fig. 3A and B). The mRNA expression levels of Smad2 and Smad3 were also significantly lower than those of the control group (t=12.88, P=0.0493; t=12.94, P=0.0491). Thus, Smad2 and Smad3 expression was successfully knocked down.
Figure 3.
E-cadherin and α-SMA expression level were decreased after Smad2/3 knockdown by SiRNA. (A and B) SK-N-SH neuroblastoma cells were cultured in 12-well plates and transfected with SiRNA targeting Smad2/3. The cells were collected and the lysates were subjected to western blot analysis for Smad2/3. (C) Cells were transfected with SiSmad2/3 and incubated with TGF-β1 for 72 h, E-cadherin and α-SMA expression was analyzed by western blot analysis. GAPDH served as a loading control. Results are representative of three independent experiments. All bands were quantified using ImageJ software and shown as the bar graph. Columns, mean of triplicate experiments; bars, ± SD. *P<0.05.
After treatment with TGF-β1 (5 ng/ml), the expression of the epithelial cell marker E-cadherin remained significantly lower in the Smad2/3 SiRNA group than the control group (t=6.299, P=0.0243), whereas the expression of α-SMA decreased slightly in the Smad2/3 SiRNA group, but this difference was not significant compared to the control group (t=1.502, P=0.271) (Fig. 3C). Thus, knockdown of the expression of Smad2 and Smad3 did not affect the expression of key EMT molecules induced by TGF-β1 in SK-N-SH cells.
TGF-β1 significantly increases Gli expression in neuroblastoma cell lines undergoing EMT
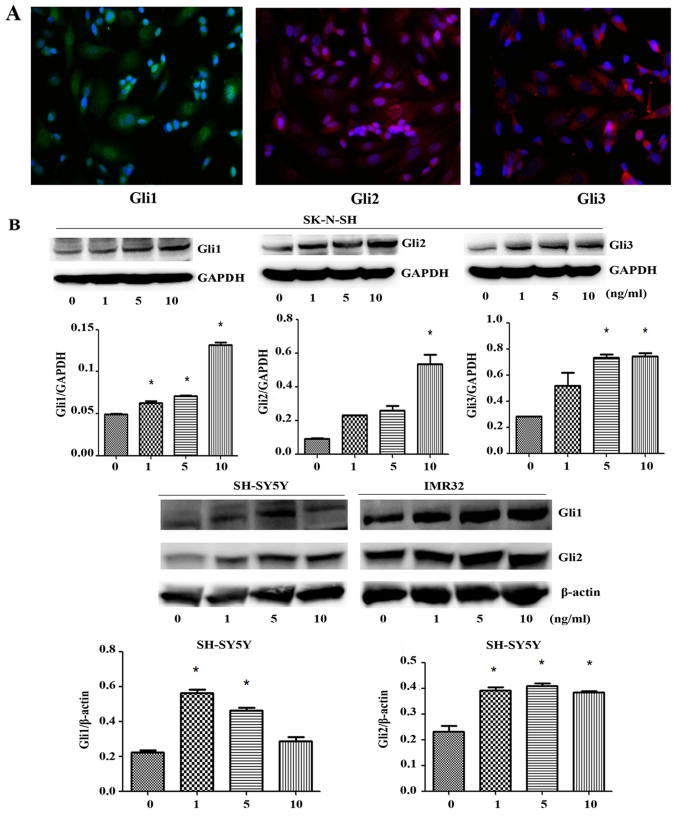
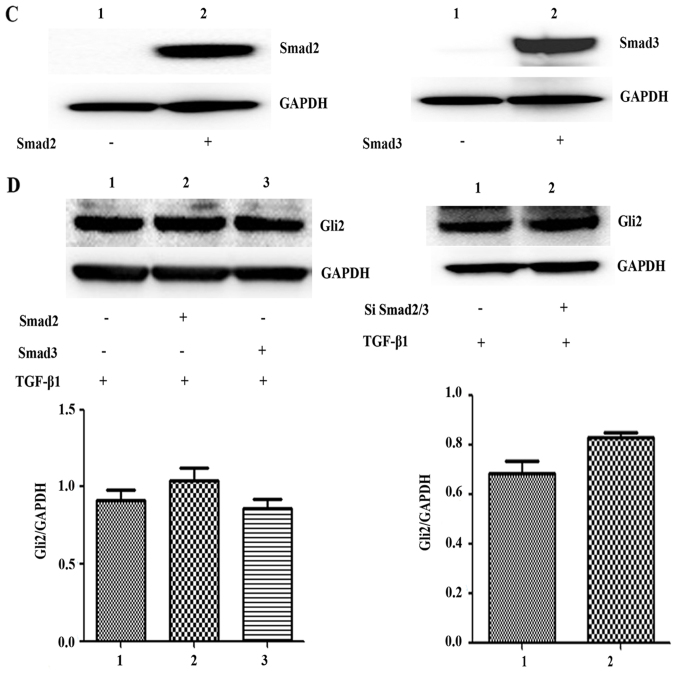
Consistent with immunofluorescence staining results, we observed SK-N-SH human neuroblastoma cells expressed the transcription factors Gli1, Gli2 and Gli3, respectively (Fig. 4A). Accordingly, western blot analysis confirmed that the protein expression levels of the transcription factors Gli1, Gli2 and Gli3 were significantly increased after TGF-β1 treatment for 3 days in SK-N-SH cells (F=268.3, P<0.0001; F=36.06, P=0.0024; F=17.17, P=0.0095). It has been reported that Gli1 and Gli2 are more closely related to EMT in cancer (11,13), we aslo found the ptotein expression of Gli1/2 increased after TGF-β1 treatment for 3 days in SH-SY5Y (F=68.45, P=0.0007; F=36.81, P=0.0023) and IMR-32 cells (F=31.67, P=0.003; F=18.24, P=0.0085) (Fig. 4B). After SK-N-SH cells were transfected with Smad2 and Smad3 plasmid and treated with TGF-β1 for 72 h, western blot analysis showed that the protein expression levels of Smad2 and Smad3 were significantly higher in the transfection group (t=19.11, P=0.0027; t=20.41, P=0.0024) (Fig. 4C). Therefore, plasmid transfection to overexpress Smad2/3 was successful. Western blot analysis also showed that the protein expression of the transcription factor Gli2 did not significantly differ after SK-N-SH cells were transfected with Smad2 and Smad3 plasmid or SiRNA Smad2/3 and treated with TGF-β1 for 72 h (F=1.643, P=0.3297; t=2.614, P=0.0602) (Fig. 4D), indicating that the increase in Gli2 expression after treatment with TGF-β1 was not related to Smad2 or Smad3 overexpression or knockdown.
Figure 4.
Immunofluorescence and western blot analysis confirmed that Gli are expressed in neuroblastoma cell lines. (A) The expression of Gli1/2/3 in SK-N-SH cells was detected by immunofluorescence assay, the green, red and red fluorescence represent the transcription factors Gli1, Gli2 and Gli3 respectively (scale bar, 50 µm). (B) The SK-N-SH, SH-SY5Y, and IMR-32 cells were plated and treated with TGF-β1 for 72 h, Cells were collected and the cell lysates were subjected to western blot analysis for Gli1/2. (C) The SK-N-SH cells were plated and transfected with Smad2 and Smad3 plasmid respectively. Cells were collected and the cell lysates were subjected to western blot analysis for Smad2 and Smad3. (D) With TGF-β1 stimulation, the SK-N-SH cells were plated and transfected with Smad2 and Smad3 plasmid or with SiSmad2/3 respectively, the Gli2 expression level was measured by western blot analysis. For all western blot analysis, GAPDH/β-actin served as a loading control. Results are representative of three independent experiments. All band intensities were quantified using ImageJ software and shown as the bar graph. Columns, mean of triplicate experiments; bars, ± SD. *P<0.05.
Interfering with the expression of Gli1/Gli2 inhibits TGF-β1-induced EMT in SK-N-SH cells
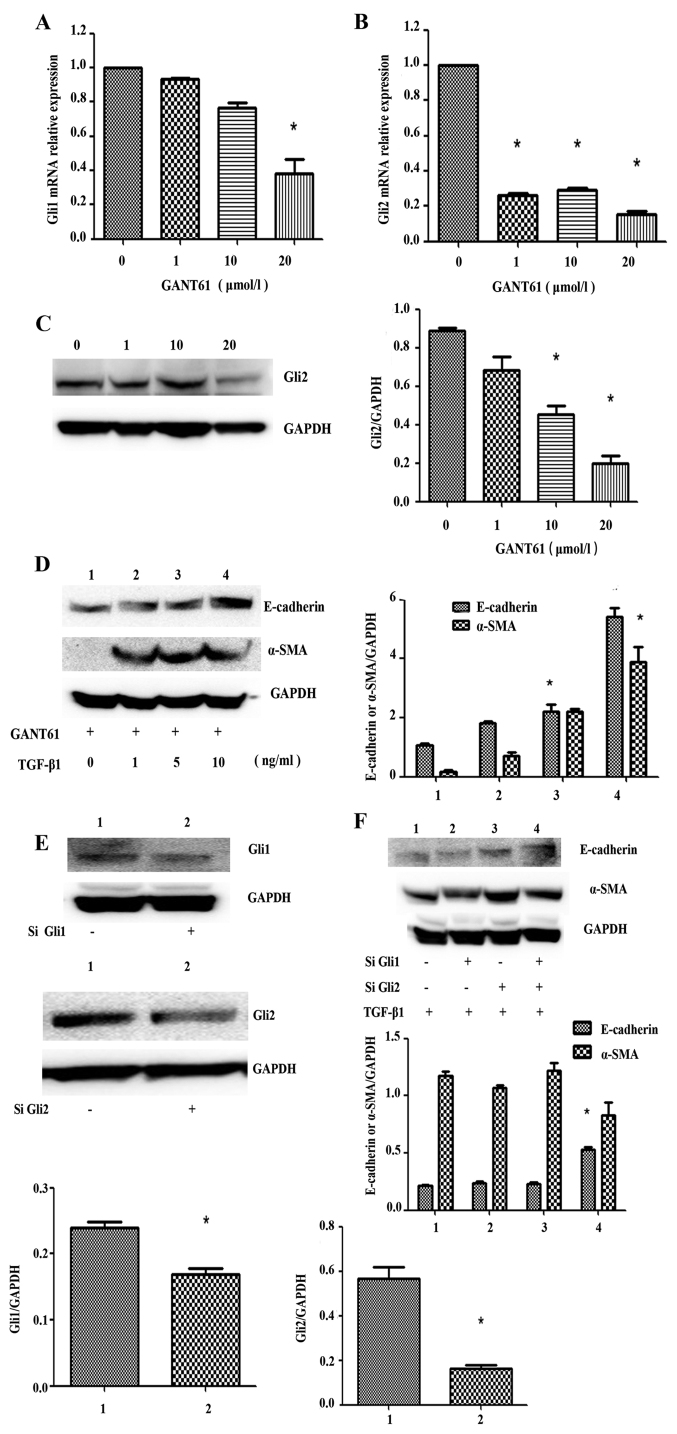
GANT61, a small-molecule inhibitor of Hedgehog signaling effector Gli protein, was reported to have a cytotoxic effect on neuroblastoma cell lines (14). After SK-N-SH cells were treated with different concentrations (0, 1, 10 and 20 µmol/l) of GANT61 for 72 h, RT-qPCR showed that Gli1 and Gli2 mRNA expression were decreased compared to the control group (F=42.29, P=0.0017; F=701.6, P<0.0001) (Fig. 5A and B). It was found that the inhibition of Gli2 was more obvious than Gli1, so Gli2 was used as the main research object in the subsequent experiments. Western blot analysis showed that the protein expression levels of the transcription factors Gli2 were decreased by GANT61 compared to the control group (F=42.24, P=0.0017) (Fig. 5C). SK-N-SH cells were treated with GANT61 (5 µmol/l) for 72 h, followed by treatment with different concentrations of TGF-β1 for 72 h. Western blot analysis showed that the expression levels of E-cadherin and α-SMA were significantly increased (F=93.93, P=0.0004; F=40.50, P=0.0019) (Fig. 5D), indicating that inhibiting the expression of Gli1/2 interfered with the expression of E-cadherin, a key regulator of EMT.
Figure 5.
Gli2 expression level is decreased in SK-N-SH cells treated with Gli2 specific inhibitor GANT61, E-cadherin and α-SMA expression are affected by TGF-β1 after inhibition of Gli1/2. (A and B) The SK-N-SH cells were treated with GANT61 for 72 h, cells were collected and mRNA was extracted, reverse transcription was performed and mRNA level of Gli1/2 was quantified and shown as the bar graph. Columns, mean of triplicate experiments; bars, ± SD. *P<0.05. (C) SK-N-SH cells were treated with GANT61 for 72 h, the protein expression of Gli2 was detected by western blot analysis. (D) The SK-N-SH cells were plated and treated with GANT61 for 72 h. Cells were collected and the cell lysates were subjected to western blot analysis for E-cadherin and α-SMA. (E) The SK-N-SH cells were plated and transfected with SiGli1/2, cells were collected and the cell lysates were subjected to western blot analysis for Gli1/2. (F) With TGF-β1 stimulation, the SK-N-SH cells were plated and transfected with SiGli1/2, after 72-h culture, E-cadherin and α-SMA were detected by western blot analysis. For western blot analysis, GAPDH served as a loading control. Results are representative of three independent experiments. The band was analyzed using ImageJ software and shown as the bar graph. Columns, mean of triplicate experiments; bars, ± SD. *P<0.05.
Transfecting SK-N-SH cells with SiRNA against Gli1 and Gli2 for 72 h significantly knocked down the protein expression levels of Gli1 and Gli2 compared with the control group (P=0.043, 0.018) (Fig. 5E). The protein expression of E-cadherin failed to decrease after transfection with SiRNA against Gli1 or Gli2 and subsequent treatment with TGF-β1 for 72 h. In fact, the expression of E-cadherin significantly increased in cells co-transfected with SiRNA against Gli1 and Gli2 compared with the control group (F=87.80, P=0.0004). The protein expression of α-SMA was decreased, but this decrease was not significant (F=6.386, P=0.0526) (Fig. 5E and F). Thus, inhibiting Gli1/Gli2 expression inhibited TGF-β1-induced EMT in SK-N-SH cells.
GANT61 decreases cell viability and promotes apoptosis in neuroblastoma cells
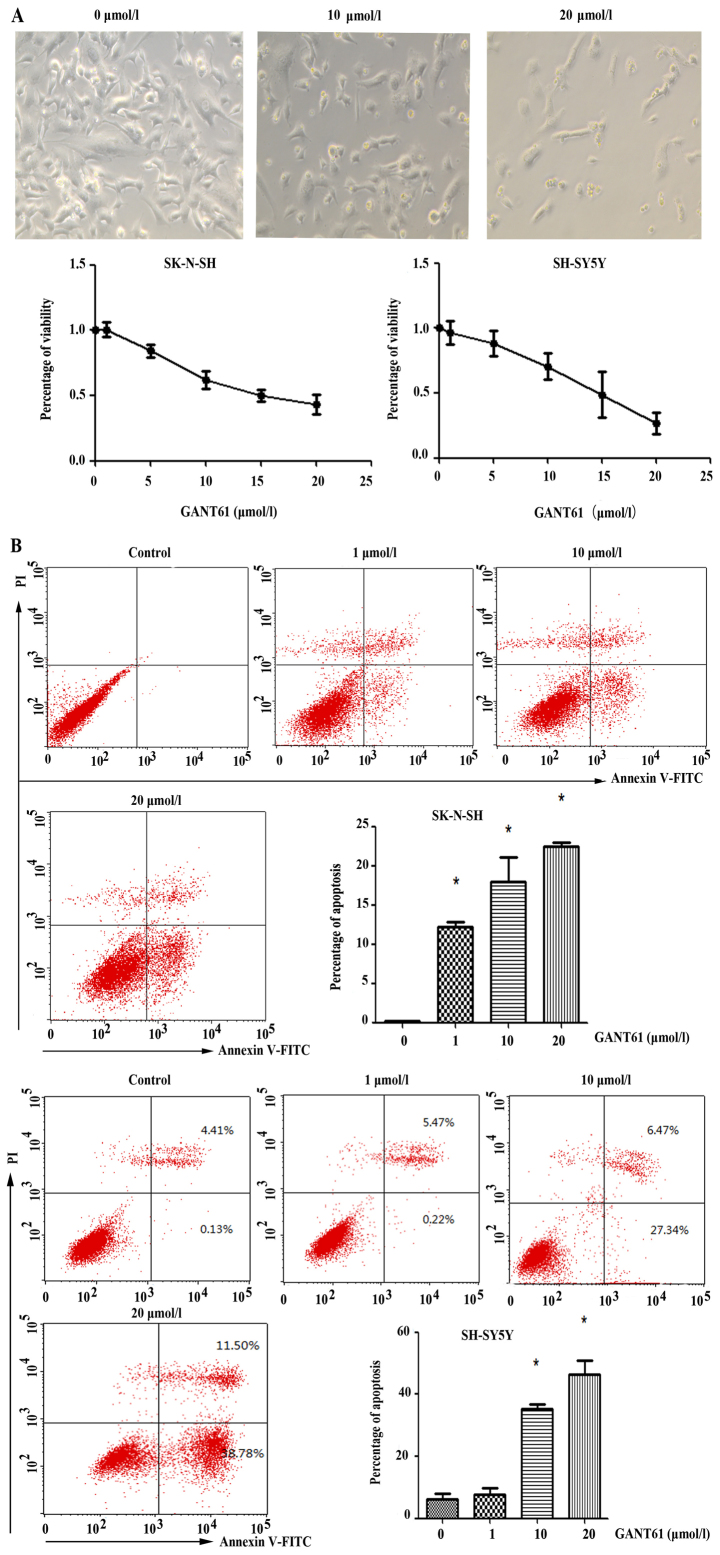
Using CCK8 assay, we evaluated the viability of SK-N-SH and SH-SY5Y cells under various concentrations of GANT61 (0–20 µmol/l). Treating neuroblastoma cells with GANT61 for 72 h significantly reduced the number of cells, as observed by microscopy (Fig. 6A). The low concentration of GANT61 did not affect cell viability obviously, while the higher concentration of GANT61 significantly reduced the number of neuroblastoma cells. SH-SY5Y cells had a fewer viable cells at high cencentration of GNAT61, with 26.9% live cells at 20 µmol/l GANT61, whereas SK-N-SH cells had 43.34% live cells under the same concentration of GANT61.
Figure 6.
GANT61 decreases cell viability and promotes cell apoptosis. (A) The viability detection was performed after treatment of GANT61 for 72 h in SK-N-SH and SH-SY5Y cells. (B) Cells treated with GANT61 for 72 h were collected and Annexin V/propidium iodide (PI) staining was conducted to detect apoptosis by flow cytometry.
We used Annexin V-FITC/PI double staining to evaluate apoptotic status of neuroblastoma cells after GANT61 treatment. Indeed, flow cytometry showed the number of apoptotic cells increased with the concentration of GANT61 in both neuroblastoma cell lines (P<0.05) (Fig. 6B). The sum of early apoptotic cells (PI−/Annexin-FITC+) and late apoptotic/necrotic cells (PI+/Annexin-FITC+) increased in both cell lines.
Discussion
Metastasis is an important step in cancer progression and an important cause of death in patients with malignant tumors. A variety of regulatory mechanisms are involved in tumor metastasis, and one of the most important mechanisms that promotes tumor cell metastasis is EMT (15,16). During EMT, specific cytokines transform cells from an epithelial to a mesenchymal phenotype. EMT is required for normal embryonic development, but this process can also trigger certain disease processes, including tissue fibrosis, tumor formation, and tumor cell migration (17).
EMT generally does not occur in normal adult cells, but EMT can be activated by external stimuli or internal signaling factors. Although EMT is known to be the first step of cell migration, the role of EMT in the spread of cancer cells has not received significant attention until recently (18). After EMT, cell adhesion is weakened, whereas cell migration characteristics are enhanced. During tumorigenesis, normal epithelial cells undergo EMT and subsequently develop into primary cancer. The cancer cells then continue to progress and spread locally via EMT before invading the lymphatic and blood vessels to ultimately metastasize. During this process, both cell phenotypes and cell markers change (19); specifically, the expression of epithelial markers, such as E-cadherin, is reduced, whereas that of mesenchymal markers, such as vimentin, N-cadherin, and α-SMA, is increased. TGF-β, an important member of the TGF-β family, has received increasing attention as a major inducer of EMT (20–22) that participates in tumor initiation and progression as well as the development of fibrotic diseases (23–25). In recent years, TGF-β1 has been identified in a variety of tumors in which EMT is closely related to primary infiltration and secondary metastasis, such as colon, liver, and breast cancer (26), and limited studies of neuroblastoma have been performed in children.
In this study, three days of treatment with TGF-β1 transformed the originally spindle-shaped cells into cells with elongated cell bodies that had a more pronounced spindle-shaped appearance, whereas cells exhibited other shapes did not show significant changes. Furthermore, most cells were spindle-shaped after 14 days of TGF-β1 treatment, i.e., most cells exhibited a mesenchymal phenotype, which suggested that EMT had occurred. To further confirm that EMT had occurred in neuroblastoma cells, we used western blot analysis to examine the expression of EMT-related marker proteins. The results showed that the epithelial cell marker E-cadherin was downregulated, and the expression of the mesenchymal cell marker α-SMA was increased. These results were confirmed by RT-qPCR, which suggested that the tumor cells had undergone EMT. Because EMT can increase the metastasis and invasion of cancer cells, scratch and Transwell migration assays were used to show that the migration of cells significantly increased after treatment with TGF-β1. Therefore, EMT enhanced the migration of neuroblastoma cells.
The signaling pathways by which TGF-β1 induces EMT in neuroblastoma cells remain unknown. TGF-β signaling pathways mainly include two types of signal transduction pathways: Smad-dependent pathways and Smad-independent pathways (21). Smad2 and Smad3 are receptor-regulated proteins and are the key proteins in Smad-dependent signaling. Accordingly, neuroblastoma cells were transfected with SiRNA against Smad2/3, but TGF-β1 treatment continued to decrease E-cadherin expression in these cells. Thus, the Smad signaling pathway was not directly involved in TGF-β1-induced EMT in neuroblastoma cells, suggesting that this process is mediated by Smad-independent signaling.
An increasing body of evidence has shown that Smad-independent pathways, such as p38, JNK-MAPK, PI3K-AKT-mTOR, and others, are of great significance in cancer development because they regulate cell survival, proliferation, migration, invasion and EMT (27–31). Recently, many studies have shown that TGF-β1 induces EMT in lung (32) and breast (33) cancer and that this process relies on the Sonic-Hedgehog-Gli (SHH) signaling pathway.
The SHH signaling pathway was originally found to play an extremely important role in embryonic neural crest development, and recently, it was found to be associated with tumor initiation, progression, and invasion (11,34,35). SHH binds to the Patched-1 (Ptch1) transmembrane receptor and then activates its downstream receptor Smoothened (Smo), which results in a signaling cascade that includes the downstream activation of Gli1 and Gli2 and the downregulation of Gli3 expression.
Yue et al reported that SHH pathway components were aberrantly expressed in lung cancer tissue. Specifically, Gli1 expression was inversely associated with the expression of the EMT markers E-cadherin and β-catenin in lung cancer specimens (36). Moreover, the excessive activation of the SHH signaling pathway was directly related to the nervous system and other cancers (37,38). Souzaki et al found that most patients with neuroblastoma who did not exhibit v-myc avian myelocytomatosis viral oncogene neuroblastoma derived homolog (MYCN) amplification were positive for Shh, Gli1, and Ptch1. In cases without MYCN amplification, the high expression of Gli1 was significantly associated with early clinical stage and a good prognosis of the patients. Furthermore, the activation of the SHH signaling pathway in neuroblastoma may be associated with the differentiation of neuroblastoma (39).
In this study, immunofluorescence staining detected Gli1, Gli2 and Gli3 protein expression in SK-N-SH cells, suggesting that the SHH signaling pathway was activated in neuroblastoma cells. After TGF-β1 induced EMT in neuroblastoma cells, western blots showed that the protein expression levels of Gli1, Gli2 and Gli3 were significantly increased compared to the control group, suggesting that the SHH signaling pathway can be further activated after EMT in neuroblastoma cells. TGF-β1 treatment increased Gli2 expression, irrespective of Smad2/Smad3 overexpression or knocked down, indicating that Smad2 or Smad3 was not related to the expression of Gli2.
Treating neuroblastoma cells with GANT61, a small-molecule inhibitor of Gli1/2, cell viability was decreased and apoptosis was increased, which indicated that Gli1/2 inhibition decreased tumor cell viability and promoted their apoptosis. Therefore, Gli1/2 may be a potential target for the treatment of neuroblastoma.
Inhibiting Gli1/2 expression by SiRNA or GANT61 in neuroblastoma cells attenuated TGF-β1-mediated decreasing in E-cadherin. Inhibiting Gli1/2 affected the expression of key EMT molecules, suggesting that transcription factor Gli was involved in TGF-β1-mediated EMT in neuroblastoma cells. Moreover, the inhibition of the transcription factor Gli may reduce the malignant behavior of neuroblastoma cells, and the SHH signaling pathway may be a key target for the treatment of neuroblastoma. The knockdown of the Gli1/2 gene reportedly inhibited the expression of key EMT regulatory proteins in human trophoblasts and skin tumors (13,40). We confirmed that TGF-β1 increased Gli expression, and Gli was related to the occurrence of EMT in neuroblastoma cells. The molecular mechanism by which Gli affected EMT appeared not to be directly related to Smad, but this mechanism requires further study.
Acknowledgments
This study was supported by grants from Shanghai Municipal Science and Technology Commission' key project (no. 12411952405) and Shanghai Municipal Health Bureau (no. 201440432).
References
- 1.Park JR, Eggert A, Caron H. Neuroblastoma: Biology, prognosis, and treatment. Hematol Oncol Clin North Am. 2010;24:65–86. doi: 10.1016/j.hoc.2009.11.011. [DOI] [PubMed] [Google Scholar]
- 2.London WB, Castel V, Monclair T, Ambros PF, Pearson AD, Cohn SL, Berthold F, Nakagawara A, Ladenstein RL, Iehara T, et al. Clinical and biologic features predictive of survival after relapse of neuroblastoma: A report from the International Neuroblastoma Risk Group project. J Clin Oncol. 2011;29:3286–3292. doi: 10.1200/JCO.2010.34.3392. [DOI] [PMC free article] [PubMed] [Google Scholar]
- 3.Pearson AD, Pinkerton CR, Lewis IJ, Imeson J, Ellershaw C, Machin D, European Neuroblastoma Study Group. Children's Cancer and Leukaemia Group (CCLG formerly United Kingdom Children's Cancer Study Group) High-dose rapid and standard induction chemotherapy for patients aged over 1 year with stage 4 neuroblastoma: A randomised trial. Lancet Oncol. 2008;9:247–256. doi: 10.1016/S1470-2045(08)70069-X. [DOI] [PubMed] [Google Scholar]
- 4.London WB, Boni L, Simon T, Berthold F, Twist C, Schmidt ML, Castleberry RP, Matthay KK, Cohn SL, De Bernardi B. The role of age in neuroblastoma risk stratification: The German, Italian, and children's oncology group perspectives. Cancer Lett. 2005;228:257–266. doi: 10.1016/j.canlet.2004.12.054. [DOI] [PubMed] [Google Scholar]
- 5.Iwatsuki M, Mimori K, Yokobori T, Ishi H, Beppu T, Nakamori S, Baba H, Mori M. Epithelial-mesenchymal transition in cancer development and its clinical significance. Cancer Sci. 2010;101:293–299. doi: 10.1111/j.1349-7006.2009.01419.x. [DOI] [PMC free article] [PubMed] [Google Scholar]
- 6.Micalizzi DS, Farabaugh SM, Ford HL. Epithelial-mesenchymal transition in cancer: Parallels between normal development and tumor progression. J Mammary Gland Biol Neoplasia. 2010;15:117–134. doi: 10.1007/s10911-010-9178-9. [DOI] [PMC free article] [PubMed] [Google Scholar]
- 7.Zhen ZJ, Guo XF, Liao R, Yang KB, Ye LT, You ZY. Involvement of IL-10 and TGF-β in HLA-E-mediated neuroblastoma migration and invasion. Oncotarget. 2016;7:44340–44349. doi: 10.18632/oncotarget.10041. [DOI] [PMC free article] [PubMed] [Google Scholar]
- 8.Lynch J, Fay J, Meehan M, Bryan K, Watters KM, Murphy DM, Stallings RL. MiRNA-335 suppresses neuroblastoma cell invasiveness by direct targeting of multiple genes from the non-canonical TGF-β signalling pathway. Carcinogenesis. 2012;33:976–985. doi: 10.1093/carcin/bgs114. [DOI] [PMC free article] [PubMed] [Google Scholar]
- 9.Xu Y, Sun J, Sheard MA, Tran HC, Wan Z, Liu WY, Asgharzadeh S, Sposto R, Wu HW, Seeger RC. Lenalidomide overcomes suppression of human natural killer cell anti-tumor functions by neuroblastoma microenvironment-associated IL-6 and TGFβ1. Cancer Immunol Immunother. 2013;62:1637–1648. doi: 10.1007/s00262-013-1466-y. [DOI] [PMC free article] [PubMed] [Google Scholar]
- 10.Turley EA, Veiseh M, Radisky DC, Bissell MJ. Mechanisms of disease: Epithelial-mesenchymal transition - does cellular plasticity fuel neoplastic progression? Nat Clin Pract Oncol. 2008;5:280–290. doi: 10.1038/ncponc1089. [DOI] [PMC free article] [PubMed] [Google Scholar]
- 11.Ingham PW, McMahon AP. Hedgehog signaling in animal development: Paradigms and principles. Genes Dev. 2001;15:3059–3087. doi: 10.1101/gad.938601. [DOI] [PubMed] [Google Scholar]
- 12.Oue T, Yoneda A, Uehara S, Yamanaka H, Fukuzawa M. Increased expression of the hedgehog signaling pathway in pediatric solid malignancies. J Pediatr Surg. 2010;45:387–392. doi: 10.1016/j.jpedsurg.2009.10.081. [DOI] [PubMed] [Google Scholar]
- 13.Tang C, Mei L, Pan L, Xiong W, Zhu H, Ruan H, Zou C, Tang L, Iguchi T, Wu X. Hedgehog signaling through GLI1 and GLI2 is required for epithelial-mesenchymal transition in human trophoblasts. Biochim Biophys Acta. 2015;1850:1438–1448. doi: 10.1016/j.bbagen.2015.04.005. [DOI] [PubMed] [Google Scholar]
- 14.Wang J, Gu S, Huang J, Chen S, Zhang Z, Xu M. Inhibition of autophagy potentiates the efficacy of Gli inhibitor GANT-61 in MYCN-amplified neuroblastoma cells. BMC Cancer. 2014;14:768. doi: 10.1186/1471-2407-14-768. [DOI] [PMC free article] [PubMed] [Google Scholar]
- 15.Jechlinger M, Grünert S, Beug H. Mechanisms in epithelial plasticity and metastasis: Insights from 3D cultures and expression profiling. J Mammary Gland Biol Neoplasia. 2002;7:415–432. doi: 10.1023/A:1024090116451. [DOI] [PubMed] [Google Scholar]
- 16.Thiery JP. Epithelial-mesenchymal transitions in tumour progression. Nat Rev Cancer. 2002;2:442–454. doi: 10.1038/nrc822. [DOI] [PubMed] [Google Scholar]
- 17.Fan QM, Jing YY, Yu GF, Kou XR, Ye F, Gao L, Li R, Zhao QD, Yang Y, Lu ZH, et al. Tumor-associated macrophages promote cancer stem cell-like properties via transforming growth factor-beta1-induced epithelial-mesenchymal transition in hepatocellular carcinoma. Cancer Lett. 2014;352:160–168. doi: 10.1016/j.canlet.2014.05.008. [DOI] [PubMed] [Google Scholar]
- 18.Zhao M, Kong L, Liu Y, Qu H. dbEMT: An epithelial-mesenchymal transition associated gene resource. Sci Rep. 2015;5:11459. doi: 10.1038/srep11459. [DOI] [PMC free article] [PubMed] [Google Scholar]
- 19.Jang MJ, Baek SH, Kim JH. UCH-L1 promotes cancer metastasis in prostate cancer cells through EMT induction. Cancer Lett. 2011;302:128–135. doi: 10.1016/j.canlet.2011.01.006. [DOI] [PubMed] [Google Scholar]
- 20.Xu J, Lamouille S, Derynck R. TGF-β-induced epithelial to mesenchymal transition. Cell Res. 2009;19:156–172. doi: 10.1038/cr.2009.5. [DOI] [PMC free article] [PubMed] [Google Scholar]
- 21.Zhao B, Chen YG. Regulation of TGF-β signal transduction. Scientifica (Cairo) 2014;2014:874065. doi: 10.1155/2014/874065. [DOI] [PMC free article] [PubMed] [Google Scholar]
- 22.Chen HN, Yuan K, Xie N, Wang K, Huang Z, Chen Y, Dou Q, Wu M, Nice EC, Zhou ZG, et al. PDLIM1 stabilizes the E-cadherin/β-catenin complex to prevent epithelial-mesenchymal transition and metastatic potential of colorectal cancer cells. Cancer Res. 2016;76:1122–1134. doi: 10.1158/0008-5472.CAN-15-1962. [DOI] [PubMed] [Google Scholar]
- 23.Kasai H, Allen JT, Mason RM, Kamimura T, Zhang Z. TGF-β1 induces human alveolar epithelial to mesenchymal cell transition (EMT) Respir Res. 2005;6:56. doi: 10.1186/1465-9921-6-56. [DOI] [PMC free article] [PubMed] [Google Scholar]
- 24.Ellenrieder V, Hendler SF, Boeck W, Seufferlein T, Menke A, Ruhland C, Adler G, Gress TM. Transforming growth factor β1 treatment leads to an epithelial-mesenchymal transdifferentiation of pancreatic cancer cells requiring extracellular signal-regulated kinase 2 activation. Cancer Res. 2001;61:4222–4228. [PubMed] [Google Scholar]
- 25.Rees JR, Onwuegbusi BA, Save VE, Alderson D, Fitzgerald RC. In vivo and in vitro evidence for transforming growth factor-β1-mediated epithelial to mesenchymal transition in esophageal adenocarcinoma. Cancer Res. 2006;66:9583–9590. doi: 10.1158/0008-5472.CAN-06-1842. [DOI] [PubMed] [Google Scholar]
- 26.Yap AS, Crampton MS, Hardin J. Making and breaking contacts: the cellular biology of cadherin regulation. Curr Opin Cell Biol. 2007;5:508–514. doi: 10.1016/j.ceb.2007.09.008. [DOI] [PMC free article] [PubMed] [Google Scholar]
- 27.Yang G, Lu W, Yu D, Sun C, Guo J, Li Z, Guan F. Quantitative analysis of differential proteome expression in epithelial-to-mesenchymal transition of bladder epithelial cells using SILAC method. Molecules. 2016;21:84. doi: 10.3390/molecules21010084. [DOI] [PMC free article] [PubMed] [Google Scholar]
- 28.Derynck R, Muthusamy BP, Saeteurn KY. Signaling pathway cooperation in TGF-β-induced epithelial-mesenchymal transition. Curr Opin Cell Biol. 2014;31:56–66. doi: 10.1016/j.ceb.2014.09.001. [DOI] [PMC free article] [PubMed] [Google Scholar]
- 29.Fruman DA, Rommel C. PI3K and cancer: Lessons, challenges and opportunities. Nat Rev Drug Discov. 2014;13:140–156. doi: 10.1038/nrd4204. [DOI] [PMC free article] [PubMed] [Google Scholar]
- 30.Lamouille S, Connolly E, Smyth JW, Akhurst RJ, Derynck R. TGF-β-induced activation of mTOR complex 2 drives epithelial-mesenchymal transition and cell invasion. J Cell Sci. 2012;125:1259–1273. doi: 10.1242/jcs.095299. [DOI] [PMC free article] [PubMed] [Google Scholar]
- 31.Dennler S, André J, Alexaki I, Li A, Magnaldo T, ten Dijke P, Wang XJ, Verrecchia F, Mauviel A. Induction of sonic hedgehog mediators by transforming growth factor-beta: Smad3-dependent activation of Gli2 and Gli1 expression in vitro and in vivo. Cancer Res. 2007;67:6981–6986. doi: 10.1158/0008-5472.CAN-07-0491. [DOI] [PubMed] [Google Scholar]
- 32.Maitah MY, Ali S, Ahmad A, Gadgeel S, Sarkar FH. Up-regulation of sonic hedgehog contributes to TGF-β1-induced epithelial to mesenchymal transition in NSCLC cells. PLoS One. 2011;6:e16068. doi: 10.1371/journal.pone.0016068. [DOI] [PMC free article] [PubMed] [Google Scholar] [Retracted]
- 33.Takebe N, Warren RQ, Ivy SP. Breast cancer growth and metastasis: Interplay between cancer stem cells, embryonic signaling pathways and epithelial-to-mesenchymal transition. Breast Cancer Res. 2011;13:211. doi: 10.1186/bcr2876. [DOI] [PMC free article] [PubMed] [Google Scholar]
- 34.Campbell V, Copland M. Hedgehog signaling in cancer stem cells: A focus on hematological cancers. Stem Cells Cloning. 2015;8:27–38. doi: 10.2147/SCCAA.S58613. [DOI] [PMC free article] [PubMed] [Google Scholar]
- 35.Pandolfi S, Stecca B. Cooperative integration between HEDGEHOG-GLI signalling and other oncogenic pathways: Implications for cancer therapy. Expert Rev Mol Med. 2015;17:e5. doi: 10.1017/erm.2015.3. [DOI] [PMC free article] [PubMed] [Google Scholar]
- 36.Yue D, Li H, Che J, Zhang Y, Tseng HH, Jin JQ, Luh TM, Giroux-Leprieur E, Mo M, Zheng Q, et al. Hedgehog/Gli promotes epithelial-mesenchymal transition in lung squamous cell carcinomas. J Exp Clin Cancer Res. 2014;33:34. doi: 10.1186/1756-9966-33-34. [DOI] [PMC free article] [PubMed] [Google Scholar]
- 37.Choudhry Z, Rikani AA, Choudhry AM, Tariq S, Zakaria F, Asghar MW, Sarfraz MK, Haider K, Shafiq AA, Mobassarah NJ. Sonic hedgehog signalling pathway: A complex network. Ann Neurosci. 2014;21:28–31. doi: 10.5214/ans.0972.7531.210109. [DOI] [PMC free article] [PubMed] [Google Scholar]
- 38.Zhou J, Zhu G, Huang J, Li L, Du Y, Gao Y, Wu D, Wang X, Hsieh JT, He D, et al. Non-canonical GLI1/2 activation by PI3K/AKT signaling in renal cell carcinoma: A novel potential therapeutic target. Cancer Lett. 2016;370:313–323. doi: 10.1016/j.canlet.2015.11.006. [DOI] [PubMed] [Google Scholar]
- 39.Souzaki R, Tajiri T, Souzaki M, Kinoshita Y, Tanaka S, Kohashi K, Oda Y, Katano M, Taguchi T. Hedgehog signaling pathway in neuroblastoma differentiation. J Pediatr Surg. 2010;45:2299–2304. doi: 10.1016/j.jpedsurg.2010.08.020. [DOI] [PubMed] [Google Scholar]
- 40.Fan Q, Gu D, Liu H, Yang L, Zhang X, Yoder MC, Kaplan MH, Xie J. Defective TGF-β signaling in bone marrow-derived cells prevents hedgehog-induced skin tumors. Cancer Res. 2014;74:471–483. doi: 10.1158/0008-5472.CAN-13-2134-T. [DOI] [PMC free article] [PubMed] [Google Scholar]


