Abstract
We herein demonstrate the first 96-well plate platform to screen effects of micro- and nanotopographies on cell growth and proliferation. Existing high-throughput platforms test a limited number of factors and are not fully compatible with multiple types of testing and assays. This platform is compatible with high-throughput liquid handling, high-resolution imaging, and all multiwell plate-based instrumentation. We use the platform to screen for topographies and drug-topography combinations that have short- and long-term effects on T cell activation and proliferation. We coated nanofabricated “trench-grid” surfaces with anti-CD3 and anti-CD28 antibodies to activate T cells and assayed for interleukin 2 (IL-2) cytokine production. IL-2 secretion was enhanced at 200 nm trench width and >2.3 μm grating pitch; however, the secretion was suppressed at 100 nm width and <0.5 μm pitch. The enhancement on 200 nm grid trench was further amplified with the addition of blebbistatin to reduce contractility. The 200 nm grid pattern was found to triple the number of T cells in long-term expansion, a result with direct clinical applicability in adoptive immunotherapy.
Keywords: High-throughput screening, nanotechnology, T cell, interleukin-2, Lck, long-term expansion
Graphical Abstract
Surface topography can influence cell shape, expansion, proliferation, differentiation, and motility.1–5 This topography can include three-dimensional structures such as gels6 and fibrous scaffolds,7,8 as well as two-dimensional surfaces patterned with features on the micro- and nanometer scale. Microscale topographies such as gratings can influence the shape and motility of attached cells.9 Nanoscale gratings have also been used to study the differentiation and proliferation of human mesenchymal stem cells (hMSCs).10 Alternatively, limiting the adhesion area on flat substrates by microprinting proteins on flat substrates can shape the 2D geometry of attached cells.11 Nanoscale cues can arise from clustering of integrins and other adhesion molecules to features in the extracellular matrix (ECM).12–14 Artificial ECMs to control integrin clustering have used fibrous materials, rough surfaces, microtopographies of adhesive islands, and other parameters.7,8,11,15,16 Lymphocytes have surface features such as microvilli and ruffles that have nanoscale dimensions and may interface with nanofabricated features such as a surface trenches presented in a grating or grid pattern.17
The complexity of cellular interactions with nanotopography has motivated development of high-throughput platforms in which many such patterns can be studied at once. Three such systems are summarized in Table 1. In particular, the TopoChip system18 has 2176 nanotopographies on a single surface and has been used to identify unique topographies able to affect human mesenchymal stromal cells proliferation and osteogenic differentiation. The BSSA system19 consists of a 3 × 3 mm chip area consisting of 504 different microstructures and has been used to study expansion and differentiation of embryonic stem cells. Optimal topography for directing the differentiation of primary murine neural progenitor cells was identified by the customizable multiarchitecture chip (MARC).20
Table 1.
Comparison of High Throughput Screening Systems
| IMP | TopoChip | BSSA | MARC | |
|---|---|---|---|---|
| pattern format | single or multiple pattern per well. 96, 384 well plate. | 2176 patterns on 2 cm × 2 cm area. Circles, isosceles triangles, thin rectangles | 169 squares, each covers 3 mm × 3 mm area | 6 × 6 array of 18 patterns on 2.2 cm ×2.2 cm |
| transmission microscopy | yes | yes | no | no |
| high NA microscopy | yes | no | no | no |
| form factor | tissue culture plate | microarray chip | microarray chip | microarray chip |
| automated fluidic handling | yes | no | no | no |
| plate scanner readout | yes | no | no | no |
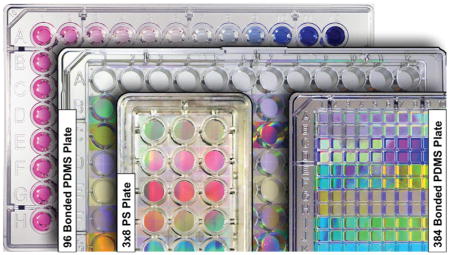
Here we demonstrate an integrated mechanobiology platform (IMP) that, like these systems, allows the study of cell growth and proliferation on multiple nanotopographies. The IMP consists of a standard, high-throghput well plate frame bonded with bottoms made from polydimethylsiloxane (PDMS) that present different surfaces in each compartment. Integration into the well-plate format is the key distinction of the IMP and provides three important advantages over the prior art. First, isolation of each pattern into a separate well allows testing of behaviors that can be affected by cross-contamination of soluble factors, such as cell proliferation and differentiation. Second, the well plate format allows for implementation of new assays, such as flow cytometry and ELISA, that require cell populations and supernatant that are separated into distinct wells. Third, this format allows for robotic liquid handling and high-throughput screening using the broad technology base developed around multiwell plates. As a final added advantage, the PDMS can be cast to the thickness of standard coverslips to allow high-resolution microscopy.
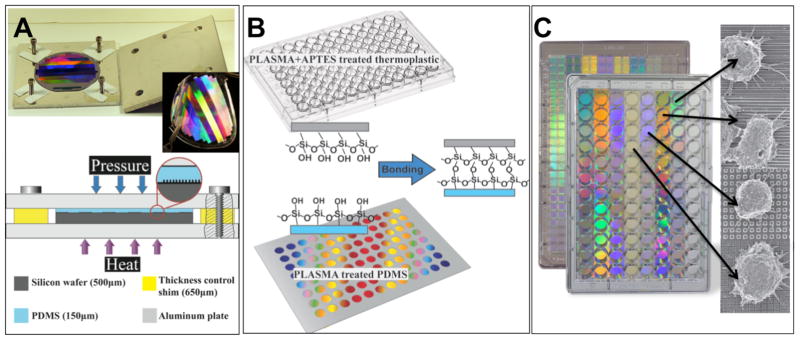
Figure 1 shows the process to fabricate the IMP. First, we use electron-beam lithography and plasma etching to create a silicon mold. PDMS is then molded from this pattern in a jig that allows for well-controlled thickness. The PDMS is then bonded to a standard bottomless microplate through oxygen plasma and aminosilane-mediated treatment.21 Irreversible bonding is formed in the interface of the PDMS and polystyrene (PS) thermoplastic under pressure. Here, the system is demonstrated on 96-well plates but has also been tested on 384-well plates and is easily extended to plates with smaller well sizes (up to 9600 wells).
Figure 1.
IMP fabrication process. A. Bonded plates assembly, PDMS thickness is controlled by changing the relative thickness of Si wafer and the shims in four corners, PDMS sheet thickness is ~150 μm; B. Thermoplastic plate is first O2 plasma treated for 1 min and then treated with 1.5% of APTES solution for 20 min, patterned PDMS substrate is O2 plasma treated for 1 min, a silane coupling reaction followed by amine–epoxy bond formation at the interfaces of treated thermoplastic and PDMS at room temperature; C. Integrated mechanobiology platform, in a 96 well plate configuration. The bottom surface of the plate is composed of PDMS nanotopographies.
We herein demonstrate the versatility of the IMP by assaying the effects of various nanoscale topographies on the activation and proliferation of human T cells. The adaptive immune response is initiated by interaction of a T cell with an antigen presenting cell (APC).22–25 Studies of the T cell-APC interface have demonstrated that the micro- and nanoscale organization of signaling complexes between the APC and the T cell modulate initial signaling, including the interdigitated nanoscale projections and transfer of nanoscale vesicles.26,27 The development of a controllable platform for ex vivo activation of T cells is central to immunotherapy for the treatment of variety of diseases, including cancer and chronic viral infections as well as basic studies of T cell signal transduction.28,29 In several adoptive immunotherapy strategies, populations of T cells are isolated from the patient and expanded ex vivo in order to produce clinically effective numbers of cells and carry out manipulations including introduction of genes needed for targeting; the resultant cellular product is then transfused back into the patient. The expansion process begins with cellular activation, most commonly with antibodies to the T cell antigen receptor (anti-CD3) and the costimulatory receptor CD28 (anti-CD28),30 both attached to a rigid support. Previous studies have shown that altered substrate rigidity can further enhance T cell expansion in ex vivo cultures,31 indicating that mechanical interaction with the substrate can affect the expansion process.
T cell responses to antibody-coated substrates progresses in stages. Initially, the T cell binds and spreads on antibody-coated substrates.32 After several hours the cells detach while secreting IL-2 and other cytokines that act as paracrine growth and differentiation factors.33 The cells increase in volume and the first round of mitosis occurs within 3 days. They continue to undergo rapid mitosis for a week or longer depending on the exact culturing conditions.31 Our platform enables us to collect and correlate data through all three stages of cell culture. Specifically, we imaged cell morphology within 1–4 h of exposure to expansion culture with fluorescent confocal microscopy; we also imaged fixed cells at high resolution using scanning electron microscopy (SEM). We identified early divisions within 3 days using flow cytometry and measured IL-2 secretion using ELISA.34 Further, we performed flow cytometry over a period of 2 weeks to measure doublings initiated by the substrates with varied topography. Finally, we repeated some of the experiments with addition of cytoskeleton inhibitors to analyze effects of topography–drug combinations on cell expansion. Dynabeads immobilized with anti-CD3/CD28 antibodies are currently the standard substrates for T cell expansion for immunotherapy applications.35 Thus, flat surfaces and Dynabeads coated with anti-CD3/CD28 were applied in our experiments as controls to compare with the effects from micro- and nanoscale topographies.
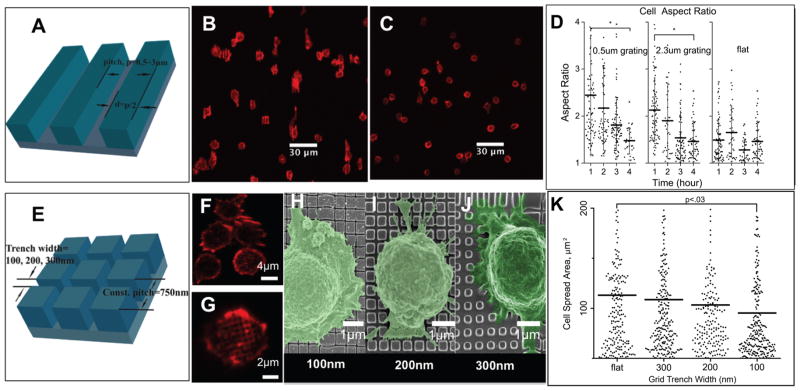
Because T cell surfaces are covered with protrusions at steady state that undergo remodeling during activation, we concentrated on topographies with trenches of variable nanoscale width and varying pitch in a simple grating and grid patterns, as shown in Figure 2A and E. The gratings we tested had a pitch of 3.0–0.3 μm with 50% duty cycle and a depth of 800 nm. The grids were composed of 300 nm deep trenches, 300–65 nm wide, in a square pattern with 750 nm pitch unless specified otherwise. Within 1 h of attachment to these patterns, the cells spread over the antibody-coated substrates, after which they slowly contract and mostly detach after 4 h. Therefore, we fixed and stained the cells for actin after 1, 2, 3, and 4 h of culture and quantified the shape of more than 1000 cells by ImageJ. Cells cultured on gratings spread along the grating direction within the first hour. After initial spreading, the length and aspect ratios decreased as the cells contracted, Figure 2D. The gratings also inhibited spreading perpendicular to the grating direction, Supporting Figure 1A. Likewise, the alignment of the cell major axis to the grating was largest in the first hour and decreased as cells contracted, Supporting Figure 1B. Cells on grids demonstrated reduced spreading area as the trench width decreased, as seen in Figure 2K. Confocal and SEM imaging revealed that the cell spreading is arrested at the narrowest trenches, Figure 2F–J. Whereas the T cells were able to spread by protruding into the wider trenches, the leading edge of the cell is apparently not able to protrude into the narrowest trenches, nor to “hop” over them.
Figure 2.
IMP compatibility with various imaging microscopy. A. 3D perspective of grating geometry; 50% duty cycle and the pitch varies from 500 to 3000 nm; B. The cells spread along the direction of the grating (vertical) within the first hour; C. The cells stop spreading and start contracting after 4 h; D. Aspect ratio of T cells activated on grating and flat PDMS; E. 3D perspective of grid, grid geometry is a square lattice of trenches on a 750 nm pitch, trench width is 100–300 nm; F–G. High-resolution confocal imaging of actin in T cells on 100 and 300 nm grid geometries; H–J. High-resolution imaging of colorized scanning electron micrograph (SEM) of T cells on grid geometries; K. T cell spreading area on grid geometries.
We hypothesize that the observed differences in interaction of T cells with these nanopatterns will have effects on cell signaling and cell fate. For instance, we expect that better spreading will lead to increased initial TCR engagement, resulting in enhanced phosphorylation and better activation. Actin polymerization and tyrosine kinase activation drive the protrusion formation along the gratings.36 When the cells are fully activated, there will be less activation of actin polymer; however, the myosin will exert a centripetal contraction force that maintains at certain level to keep synaptic integrity over time.37,38 Decreasing the protrusion force of actin will make contraction behavior by myosin dominant.
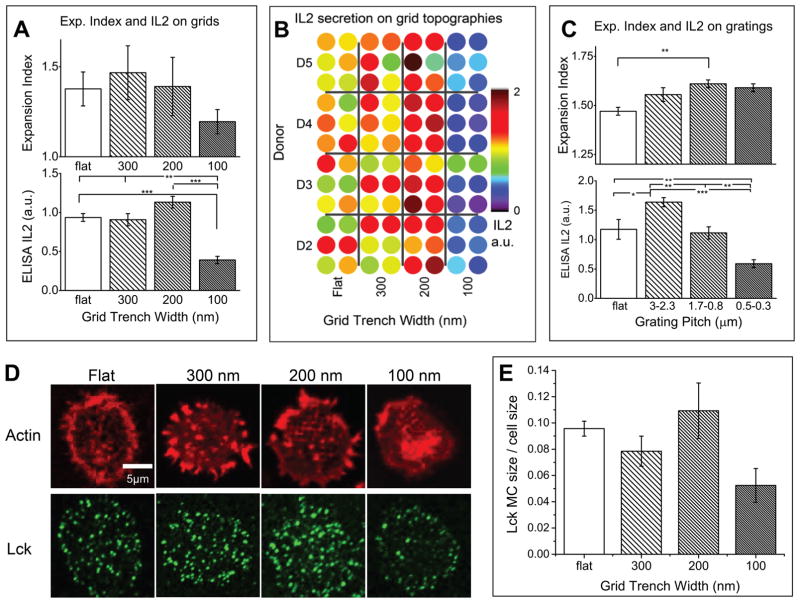
We next demonstrate that different spreading patterns on the nanotopographies leads to different levels of T cell proliferation and activation as indicated by secretion of cytokines such as IL-2 and expansion index. The IMP system enables high-throughput measurement of proliferation by fluorescence-activated cell sorting (FACS) and IL-2 secretion by ELISA. Both were measured after 2 days. Proliferation is measured based on expansion index, which measures the fold-expansion of the overall culture. For example, expansion index of 2 means the total cell count is doubled after a certain period of culturing. IL-2 concentration was analyzed by Multiskan FC (Thermo Scientific) plate reader with two readings at 450 and 540 nm. An added advantage of the IMP is easy testing of multiple samples, which allows us to examine the variability due to the use of multiple donors in human T cell experiments: IL-2 baseline secretion may vary from donor to donor due to factors such as genetics, age, gender, and health. The heat map of IL-2 secretion in Figure 3B shows IL-2 levels from T cells from four different donors, tested on four different grid geometries, with six replicates for each combination. IL-2 secretion on each pattern was normalized to each donor baseline secretion and seen to be consistent across different donors.
Figure 3.
IMP compatibility with plate readers. A. Expansion index and supernatant IL-2 from T cells activated on grating geometries; B. ELISA IL-2 measurements from a well plate with 96 samples of four donors and four different topographies tested; C. Expansion index and supernatant IL-2 from T cells activated on grid topographies after 2–3 days culturing; D. Actin and Lck microcluster staining after 1 h culture on grid patterns; E. Statistical analysis of Lck microcluster size versus total cell size, and the percentage trend correlates with IL-2 secretion shown in A (*, p < 0.01; **, p < 0.005; ***, p < 0.00005).
For grid geometries, we tested a wide range of grid geometry parameters to separate the effects of trench width, trench pitch, and area of the pedestal isolated by the trench, Supporting Figure 2A. Briefly, the trench width was found to be the most significant variable modifying secretion of IL-2, with significant inhibition for 100 nm trench widths. However, even 100 nm trenches spaced significantly far apart no longer inhibited IL-2 secretion, Supporting Figure 2B. IL-2 secretion levels for 750 nm pitch grids with 100, 200, and 300 nm trenches, as well as flat substrates, are shown in Figure 3A; the 100 nm trenches show a 2-fold decrease in IL-2 secretion compared to the flat substrate, while 200 nm trenches showed a 30% increase. Grating geometries demonstrated similar trends: IL-2 secretion was higher for longer grating pitches, and for short pitches, there is an obvious IL-2 secretion inhibition, Figure 3C. Cell proliferation, as measured by the expansion index, is shown for each pattern in Figure 3A and C. For grids with 100 nm trenches, inhibition of IL-2 secretion also strongly correlated with decreased cell proliferation, but no increase in proliferation is seen for 200 nm trenches. Surprisingly, the opposite pattern is seen for gratings: proliferation increases for narrower pitches, while IL-2 decreases.
These results strongly suggest that physical interaction with different grid patterns directly affects the signaling leading to T cell activation. Because TCR signaling begins with phosphorylation of the CD3 complex units containing immunoreceptor tyrosine-based activation motifs (ITAMs) by the Src family tyrosine kinase Lck,39,40 we imaged Lck microclusters (MCs) on grids after 1 h of activation (Figure 3D). Compared to flat substrates, 300 nm grids show similar MC density, 200 nm grids show an increase, and 100 nm grids show the lowest density. This is confirmed by statistical analysis of Lck MC size versus the total cell size, Figure 3E. The trend in MC formation directly follows IL-2 secretion (Figure 3A), indicating that the IL-2 secretion variance on grids can be tracked back to early stage cell signaling. It has been shown that Lck phosphorylation activity is suppressed by the presence of tyrosine phosphatases such as CD45, which dephosphorylate ITAMs.41 Thus, the exclusion of CD45 will thus favor stronger T cell activation. We postulate that 100 nm grid pattern interacts with the T cell to create a channel for the entry of CD45 to the TCR engagement sites, resulting in fewer Lck MCs and suppressed IL-secretion. However, the details of this process are still unknown and motivate further study.
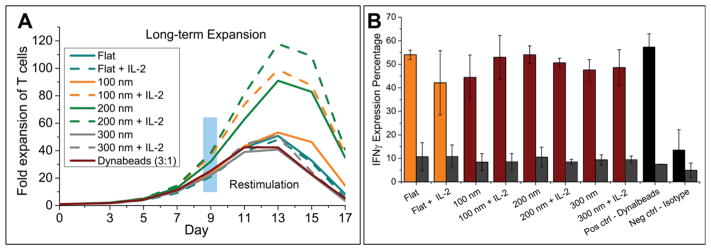
Another distinguishing advantage of IMP is that the well-plate format makes long-term culture straightforward, allowing study of proliferation over many days. In this study, mixed CD4+/CD8+ cells were isolated from whole blood from healthy patients and were seeded at 1 × 10⁶/mL (200 k cells in 200 μL) (37 °C, 5% CO2). Cell proliferation was assessed beginning on day 3 postseeding and on every other subsequent day. Proliferation index as well as the percentage of cells entering primary division was determined via carboxyfluorescein succinimidyl ester (CSFE) labeling prior to initiation of the culture tracking or proliferation by dye dilution on day 3 postseeding with flow cytometry (BD FACSCanto II). Cells were frozen down for restimulation upon completion of the initial blasting phase. In Figure 4A, two groups of experiments were carried out either with or without addition of IL-2 (50 ng/mL) at the beginning of culture to enhance the activation. Without added IL-2, 100- and 200 nm grid patterns outperformed Dyanbeads, with up to 3-fold increase in expansion (~1.5 more doublings, SFigure 4) and a maximum in cell expansion observed around day 13. With added IL-2, cell proliferation levels were increased, especially on 100 nm patterns. This is understandable given the fact that 100 nm grids showed the lowest IL-2 secretion at day 3 (Figure 3). Moreover, the rate of expansion was observed to be higher on patterned surfaces than on Dyanbeads: cultures expanded on Dynabeads reached peak fold expansion on day 11, whereas the 200 nm grids yield the same level 2 days earlier on day 9. Following expansion, T cells functionality was evaluated by the IFN-γ expression level. Figure 4B shows that cells stimulated on our patterned surfaces and Dyanbeads showed similar IFN-γ expression profiles, confirming that grids provide improved expansion with no significant loss in functionality, indicating that these findings have direct clinical applicability in adoptive immunotherapy.
Figure 4.
T cell long-term expansion and restimulation on grid patterns. A. Two groups experiments carried out, one without additional IL-2 and the other group with 50 ng/mL IL-2 addition at the beginning of cell culture. Cell induction and proliferation were assayed by CFSE dilution every 2 days from day 3 and at day 9 cells were frozen down for restimulation; B. Cells were restimulated by Dynabeads and IFN-γ expression percentage is analyzed for the study of cell functionality, grid patterns showed less but comparable percent of IFN-γ comparing with Dynabeads.
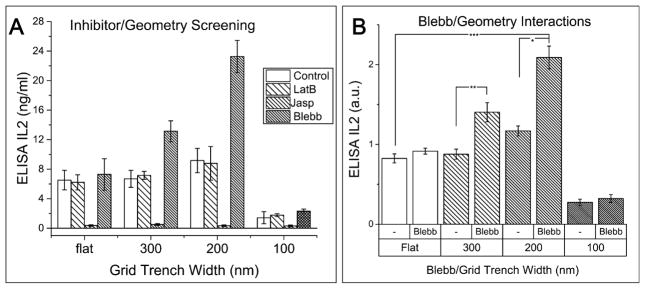
The microplate format of IMP also allows straightforward study of the combined effects of drugs and topography, to determine whether chemical factors can interact with geometric cues and affect cell activation metrics. Actin polymerization and myosin contractions are believed to play a central role in actomyosin retrograde flow, MCs centralization and sustained Ca2+ signaling, which are critical for T cell signaling and activation.38 Therefore, we screened several cytoskeleton inhibitors (latrunculin B, jasplakinolide, and blebbistatin) in combination with grid geometries. Latrunculin B (LatB) is an F-actin depolymering agent inhibiting formation of micro-cluster.36 Jasplakinolide (Jasp) is an F-actin stabilizing agent that perturbs actin turnover.42 Blebbistatin (Blebb) is a inhibitor of myosin II ATPase activity.43 All inhibitors were added 5 min post cell-seeding. Figure 5A shows that IL-2 secretion on grids is comparable for controls and LatB treated cells and strongly suppressed for Jasp. Surprisingly, we found strong drug/geometry interaction in T cells cultured on grids and exposed to blebbistatin. The general trend follows the one from IL-2 study of Figure 3C; however, the enhancement or inhibition of the IL-2 secretion was amplified with the addition of blebbistatin. In particular, we observed a 162% enhancement in IL-2 secretion after 2–3 days of culture (Figure 5B). The lack of an effect due to Lat B is explained by the rapid (<5 min.) assembly of microclusters:38 although LatB inhibits the formation of new MCs by actin depolymerization, existing MCs are stable. On the other hand, Jasp perturbs actin turnover, freezing the actin networks, and causing the loss of phosphor-PLCγ1 in T cell activation, and further shutting down Ca2+ signaling. The detailed mechanism for the geometry-dependent effects of Blebbistatin is still unknown; however, we postulate that the loss of myosin contraction enhances the effect of segregation of CD45 on 200 nm grids and the entry of CD45 on 100 nm grid.
Figure 5.
IMP compatibility for study of topography–drug combinations on cell expansion. A. Three inhibitors (latrunculin B, jasplakinolide, and blebbistatin) were tested for a drug/geometry combination effects on cell behavior. There is a drug/geometry interaction with 200 nm grids and blebbistatin; B. IL-2 secreted in supernatant after 2–3 days of culture on grid geometries with and without Blebbistatin. Two-way repeated measure ANOVA analysis shows significant enhancement in IL-2 secretion with Blebb and 200 nm trench geometry combination. (*, p < 0.02; **, p < 0.3; ***, p < 0.0002).
In conclusion, we have demonstrated an integrated mechaniobiology platform to study cellular interactions with nanotopographies. The IMP system uses a standard well plate format and is compatible with existing high throughput technologies such as plate readers, multi channel pipettes, and fluidic handling robots. These enable us to incorporate new high throughput assays such as ELISA, long-term expansion, and drug-topography effects. As a demonstration, the IMP was used to screen the effects of nanotopographies on activation of T cells. In a study of 100s of samples over a dozen geometries, we discovered significant changes in T cell activation response in grids with gaps from 300 to 100 nm. In particular, the 200 nm grid pattern provided a 3-fold increase in expansion with no change in functionality. These findings confirm that cell expansion and restimulation can be strongly modified by early stage physical interaction with the substrate topography, as confirmed by imaging of MC formation and drug inhibition studies. They further motivate future research into the details of the geometric interaction, for instance to measure and understand CD45 segregation on grid patterns. The IMP format directly facilitates these findings by allowing efficient exploration of multiple geometries in separate wells for independent long-term culture, combined with compatibility with multiple assays of cell behavior.
Supplementary Material
Acknowledgments
This work was supported by National Institutes of Health (PN2EY016586). As members of the Nanomedicine Center for Mechanobiology, we thank all the researchers in the center for the discussion of this work. We also thank Professor Lance C. Kam for providing lab space and consumables at the beginning of this project. We thank Geraldine Goebrecht for assistance with flow cytometery. In addition, we thank Dr. Joung-Hyun Lee from Prof. Lance C. Kam’s lab for the discussion on data presented in the paper.
Footnotes
Author Contributions
J.H. and A.A.G. contributed equally to this work. J.H., A.A.G., and A.P.D. designed the experiments. J.H., A.A.G., and A.P.D. carried out fabrication, performed the experiments, and analyzed data, and S.L. assisted with the fabrication. L.C.K., K.T.B., R.S.O., S.G., A.L., M.C.M., M.P.S., and M.L.D. provided assistance with data interpretation. J.H., A.A.G., and J.C.H. wrote the paper. L.C.K. and M.L.D. helped with revising the paper. All authors discussed the results and commented on the manuscript.
The authors declare no competing financial interest.
The Supporting Information is available free of charge on the ACS Publications website at DOI: 10.1021/acs.nano-lett.5b04364.
Information on IMP fabrication, cell preparation and analysis, along with details on the experimental measurements and methods, and supplementary Figures 1–4 (PDF)
References
- 1.Chen CS. Geometric Control of Cell Life and Death. Science. 1997;276:1425–1428. doi: 10.1126/science.276.5317.1425. [DOI] [PubMed] [Google Scholar]
- 2.Juliano RL, Haskill S. Signal transduction from the extracellular matrix. J Cell Biol. 1993;120:577–585. doi: 10.1083/jcb.120.3.577. [DOI] [PMC free article] [PubMed] [Google Scholar]
- 3.Flemming RG, Murphy CJ, Abrams GA, Goodman SL, Nealey PF. Effects of synthetic micro- and nano-structured surfaces on cell behavior. Biomaterials. 1999;20:573–588. doi: 10.1016/s0142-9612(98)00209-9. [DOI] [PubMed] [Google Scholar]
- 4.Bettinger CJ, Langer R, Borenstein JT. Engineering Substrate Topography at the Micro- and Nanoscale to Control Cell Function. Angew Chem, Int Ed. 2009;48:5406–5415. doi: 10.1002/anie.200805179. [DOI] [PMC free article] [PubMed] [Google Scholar]
- 5.Anselme K, et al. The interaction of cells and bacteria with surfaces structured at the nanometre scale. Acta Biomater. 2010;6:3824–3846. doi: 10.1016/j.actbio.2010.04.001. [DOI] [PubMed] [Google Scholar]
- 6.Tibbitt MW, Anseth KS. Hydrogels as extracellular matrix mimics for 3D cell culture. Biotechnol Bioeng. 2009;103:655–663. doi: 10.1002/bit.22361. [DOI] [PMC free article] [PubMed] [Google Scholar]
- 7.Freed LE, et al. Biodegradable Polymer Scaffolds for Tissue Engineering. Bio/Technology. 1994;12:689–693. doi: 10.1038/nbt0794-689. [DOI] [PubMed] [Google Scholar]
- 8.Lee J, Cuddihy MJ, Kotov NA. Three-Dimensional Cell Culture Matrices: State of the Art. Tissue Eng, Part B. 2008;14:61–86. doi: 10.1089/teb.2007.0150. [DOI] [PubMed] [Google Scholar]
- 9.Yim E, et al. Nanopattern-induced changes in morphology and motility of smooth muscle cells. Biomaterials. 2005;26:5405–5413. doi: 10.1016/j.biomaterials.2005.01.058. [DOI] [PMC free article] [PubMed] [Google Scholar]
- 10.Yim EKF, Pang SW, Leong KW. Synthetic nanostructures inducing differentiation of human mesenchymal stem cells into neuronal lineage. Exp Cell Res. 2007;313:1820–1829. doi: 10.1016/j.yexcr.2007.02.031. [DOI] [PMC free article] [PubMed] [Google Scholar]
- 11.Singhvi R, et al. Engineering cell shape and function. Science. 1994;264:696–698. doi: 10.1126/science.8171320. [DOI] [PubMed] [Google Scholar]
- 12.Werb Z. ECM and cell surface proteolysis: regulating cellular ecology. Cell. 1997;91:439–442. doi: 10.1016/s0092-8674(00)80429-8. [DOI] [PubMed] [Google Scholar]
- 13.von der Mark K, Park J, Bauer S, Schmuki P. Nanoscale engineering of biomimetic surfaces: cues from the extracellular matrix. Cell Tissue Res. 2010;339:131–153. doi: 10.1007/s00441-009-0896-5. [DOI] [PubMed] [Google Scholar]
- 14.Shen K, Milone MC, Dustin ML, Kam LC. In MRS Proceedings. Vol. 1209. Cambridge Univ Press; 2009. Nanoengineering of Immune Cell Function; p. 1209–YY03. [DOI] [PMC free article] [PubMed] [Google Scholar]
- 15.Dalby MJ, et al. The control of human mesenchymal cell differentiation using nanoscale symmetry and disorder. Nat Mater. 2007;6:997–1003. doi: 10.1038/nmat2013. [DOI] [PubMed] [Google Scholar]
- 16.Reynolds PM, Pedersen RH, Riehle MO, Gadegaard N. A Dual Gradient Assay for the Parametric Analysis of Cell-Surface Interactions. Small. 2012;8:2541–2547. doi: 10.1002/smll.201200235. [DOI] [PubMed] [Google Scholar]
- 17.Majstoravich S. Lymphocyte microvilli are dynamic, actin-dependent structures that do not require Wiskott-Aldrich syndrome protein (WASp) for their morphology. Blood. 2004;104:1396–1403. doi: 10.1182/blood-2004-02-0437. [DOI] [PubMed] [Google Scholar]
- 18.Unadkat HV, et al. An algorithm-based topographical biomaterials library to instruct cell fate. Proc Natl Acad Sci U S A. 2011;108:16565–16570. doi: 10.1073/pnas.1109861108. [DOI] [PMC free article] [PubMed] [Google Scholar]
- 19.Markert LD, et al. Identification of Distinct Topographical Surface Microstructures Favoring Either Undifferentiated Expansion or Differentiation of Murine Embryonic Stem Cells. Stem Cells Dev. 2009;18:1331–1342. doi: 10.1089/scd.2009.0114. [DOI] [PubMed] [Google Scholar]
- 20.Moe AAK, et al. Microarray with Micro- and Nano-topographies Enables Identification of the Optimal Topography for Directing the Differentiation of Primary Murine Neural Progenitor Cells. Small. 2012;8:3050–3061. doi: 10.1002/smll.201200490. [DOI] [PubMed] [Google Scholar]
- 21.Sunkara V, Cho YK. Investigation on the Mechanism of Aminosilane-Mediated Bonding of Thermoplastics and Poly-(dimethylsiloxane) ACS Appl Mater Interfaces. 2012;4:6537–6544. doi: 10.1021/am3015923. [DOI] [PubMed] [Google Scholar]
- 22.Smith-Garvin JE, Koretzky GA, Jordan MS. T Cell Activation. Annu Rev Immunol. 2009;27:591–619. doi: 10.1146/annurev.immunol.021908.132706. [DOI] [PMC free article] [PubMed] [Google Scholar]
- 23.Bashour KT, et al. CD28 and CD3 have complementary roles in T-cell traction forces. Proc Natl Acad Sci U S A. 2014;111:2241–2246. doi: 10.1073/pnas.1315606111. [DOI] [PMC free article] [PubMed] [Google Scholar]
- 24.Bashour KT, et al. Cross Talk between CD3 and CD28 Is Spatially Modulated by Protein Lateral Mobility. Mol Cell Biol. 2014;34:955–964. doi: 10.1128/MCB.00842-13. [DOI] [PMC free article] [PubMed] [Google Scholar]
- 25.Deeg J, et al. T Cell Activation is Determined by the Number of Presented Antigens. Nano Lett. 2013;13:5619–5626. doi: 10.1021/nl403266t. [DOI] [PMC free article] [PubMed] [Google Scholar]
- 26.Biggs MJP, Richards RG, Dalby MJ. Nanotopographical modification: a regulator of cellular function through focal adhesions. Nanomedicine. 2010;6:619–633. doi: 10.1016/j.nano.2010.01.009. [DOI] [PMC free article] [PubMed] [Google Scholar]
- 27.Choudhuri K, et al. Polarized release of T-cell-receptor-enriched microvesicles at the immunological synapse. Nature. 2014;507:118–123. doi: 10.1038/nature12951. [DOI] [PMC free article] [PubMed] [Google Scholar]
- 28.Dustin ML, Depoil D. New insights into the T cell synapse from single molecule techniques. Nat Rev Immunol. 2011;11:672–684. doi: 10.1038/nri3066. [DOI] [PMC free article] [PubMed] [Google Scholar]
- 29.Maus MV, et al. Ex vivo expansion of polyclonal and antigen-specific cytotoxic T lymphocytes by artificial APCs expressing ligands for the T-cell receptor, CD28 and 4–1BB. Nat Biotechnol. 2002;20:143–148. doi: 10.1038/nbt0202-143. [DOI] [PubMed] [Google Scholar]
- 30.Levine BL, et al. Effects of CD28 costimulation on long-term proliferation of CD4+ T cells in the absence of exogenous feeder cells. J Immunol. 1997;159:5921–5930. [PubMed] [Google Scholar]
- 31.O’Connor RS, et al. Substrate Rigidity Regulates Human T Cell Activation and Proliferation. J Immunol. 2012;189:1330–1339. doi: 10.4049/jimmunol.1102757. [DOI] [PMC free article] [PubMed] [Google Scholar]
- 32.Yu L, et al. Flow-through functionalized PDMS microfluidic channels with dextran derivative for ELISAs. Lab Chip. 2009;9:1243. doi: 10.1039/b816018j. [DOI] [PubMed] [Google Scholar]
- 33.Shen K, Thomas VK, Dustin ML, Kam LC. Micropatterning of costimulatory ligands enhances CD4+ T cell function. Proc Natl Acad Sci U S A. 2008;105:7791–7796. doi: 10.1073/pnas.0710295105. [DOI] [PMC free article] [PubMed] [Google Scholar]
- 34.Dong H, Zhu G, Tamada K, Chen L. B7-H1, a third member of the B7 family, co-stimulates T-cell proliferation and interleukin-10 secretion. Nat Med. 1999;5:1365–1369. doi: 10.1038/70932. [DOI] [PubMed] [Google Scholar]
- 35.Trickett A, Kwan YL. T cell stimulation and expansion using anti-CD3/CD28 beads. J Immunol Methods. 2003;275:251–255. doi: 10.1016/s0022-1759(03)00010-3. [DOI] [PubMed] [Google Scholar]
- 36.Bunnell SC, Kapoor V, Trible RP, Zhang W, Samelson LE. Dynamic actin polymerization drives T cell receptor–induced spreading: a role for the signal transduction adaptor LAT. Immunity. 2001;14:315–329. doi: 10.1016/s1074-7613(01)00112-1. [DOI] [PubMed] [Google Scholar]
- 37.Kumari S, Dustin ML. Immunology: Dendritic Cells Pull the T Cell’s Strings. Curr Biol. 2015;25:R413–R415. doi: 10.1016/j.cub.2015.03.040. [DOI] [PubMed] [Google Scholar]
- 38.Babich A, et al. F-actin polymerization and retrograde flow drive sustained PLCγ1 signaling during T cell activation. J Cell Biol. 2012;197:775–787. doi: 10.1083/jcb.201201018. [DOI] [PMC free article] [PubMed] [Google Scholar]
- 39.Weiss A, Littman DR. Signal Transduction by Lymphocyte Antigen Receptors. Cell. 1994;76:263–274. doi: 10.1016/0092-8674(94)90334-4. [DOI] [PubMed] [Google Scholar]
- 40.Palacios EH, Weiss A. Function of the Src-family kinases, Lck and Fyn, in T-cell development and activation. Oncogene. 2004;23:7990–8000. doi: 10.1038/sj.onc.1208074. [DOI] [PubMed] [Google Scholar]
- 41.Nika K, et al. Constitutively Active Lck Kinase in T Cells Drives Antigen Receptor Signal Transduction. Immunity. 2010;32:766–777. doi: 10.1016/j.immuni.2010.05.011. [DOI] [PMC free article] [PubMed] [Google Scholar]
- 42.Rubb MR, et al. Jasplakinolide, a Cytotoxic Natural Product, Induces Actin Polymerization and Competitively Inhibits the Binding of Phalloidin to F-actin. J Biol Chem. 1994;269:14869–14871. [PubMed] [Google Scholar]
- 43.Straight AF, et al. Dissecting Temporal and Spatial Control of Cytokinesis with a Myosin II Inhibitor. Science. 2003;299:1743–1747. doi: 10.1126/science.1081412. [DOI] [PubMed] [Google Scholar]
Associated Data
This section collects any data citations, data availability statements, or supplementary materials included in this article.


